
📍 PAD Prediction
💡 PAD Prediction lets you forecast completion delays across your project's WBS or Activity Code hierarchy. It uses PAD (Performance Against Duration) scores — computed from the historical performance of completed activities within the same hierarchy node (WBS or ACS) — to predict how long remaining work will actually take and by how much the project is expected to be delayed.
🔍 What you’ll learn:
- Understand how PAD scores are computed from completed activities and used to predict remaining work
- Explore the WBS or Activity Code hierarchy with Total Delay values per node
- Visualize the S Curve showing Actual, Plan, Early/Late, and PAD forecasted progress
- Review individual activities with PAD, PAD Duration, PAD Delay, and PAD Finish Date
- Inspect the completed activities used to compute the applied PAD score
- Configure the hierarchy (WBS or Activity Code) used to group activities
Overview
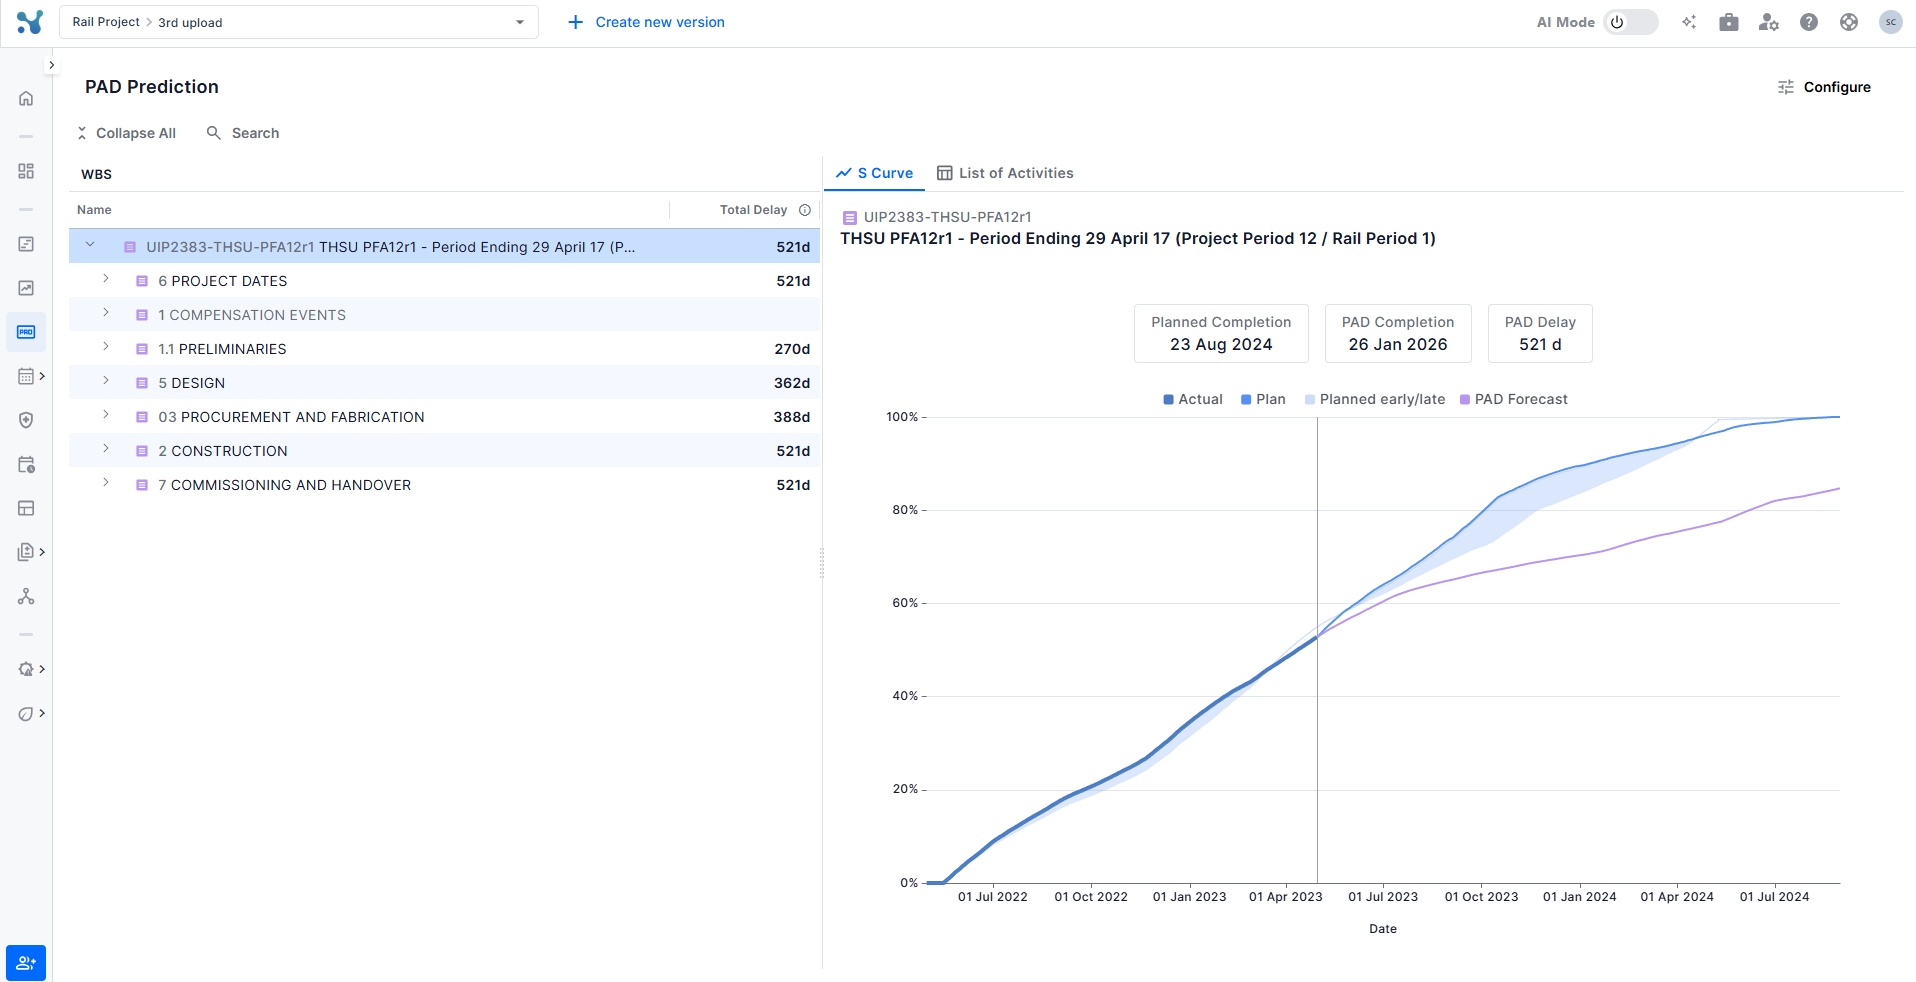
When you open PAD Prediction, the left panel displays your project's hierarchy — either the WBS tree or an Activity Code grouping. Each row shows a Total Delay value (in days) representing the total delay of the WBS activities after applying PAD.
S Curve View
When you select a WBS node, the right panel shows the S Curve tab — a visual chart displaying cumulative progress over time. This chart helps you understand both historical performance and the predicted trajectory going forward.
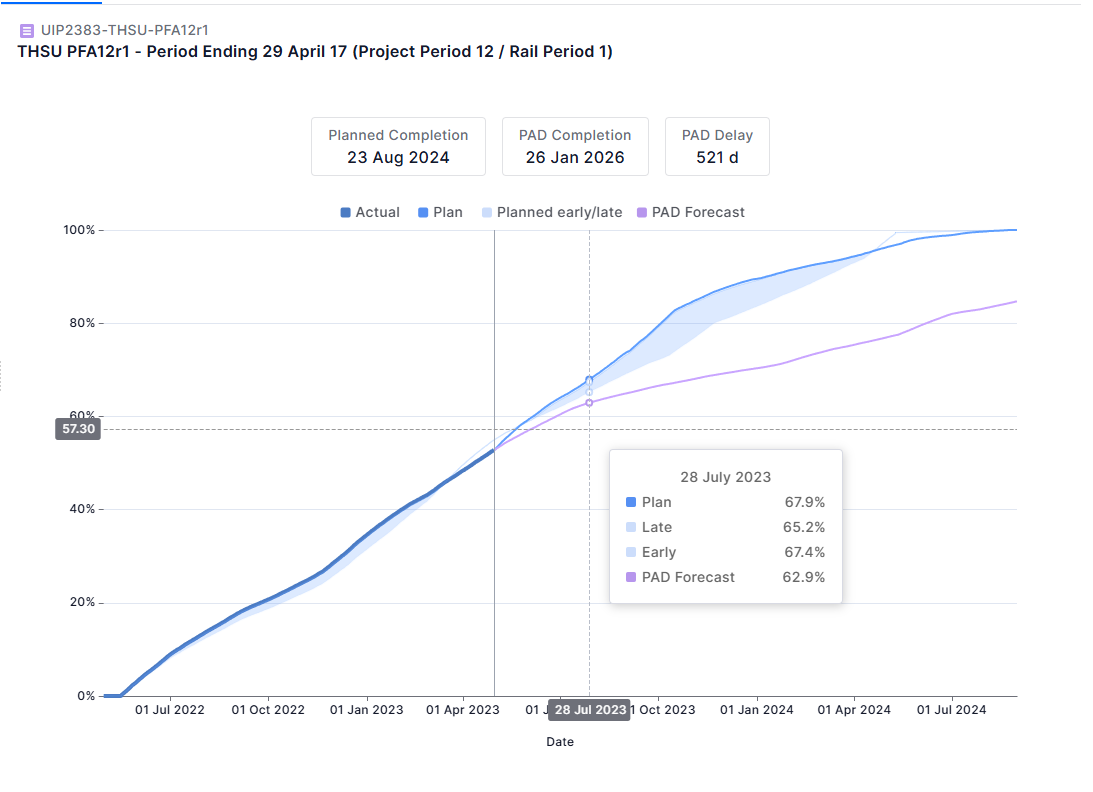
The S Curve header shows three key KPIs for the selected node:
- Planned Completion — The original planned finish date for the selected node
- PAD Completion — The predicted finish date, computed by applying the Applied PAD to remaining incomplete activities under the selected WBS/ACS
- Total Delay — The difference in days between Planned and PAD Completion
The chart displays four data series:
- Actual — The real cumulative progress recorded to date
- Plan — The originally planned cumulative progress curve
- Early / Late — A range band showing the early and late schedule boundary
- PAD — The predicted completion trajectory based on PAD multipliers
List of Activities View
The List of Activities tab, accessible next to the S Curve tab, shows every activity under the selected WBS node alongside its PAD data. This detailed view lets you pinpoint which specific activities are driving delay.
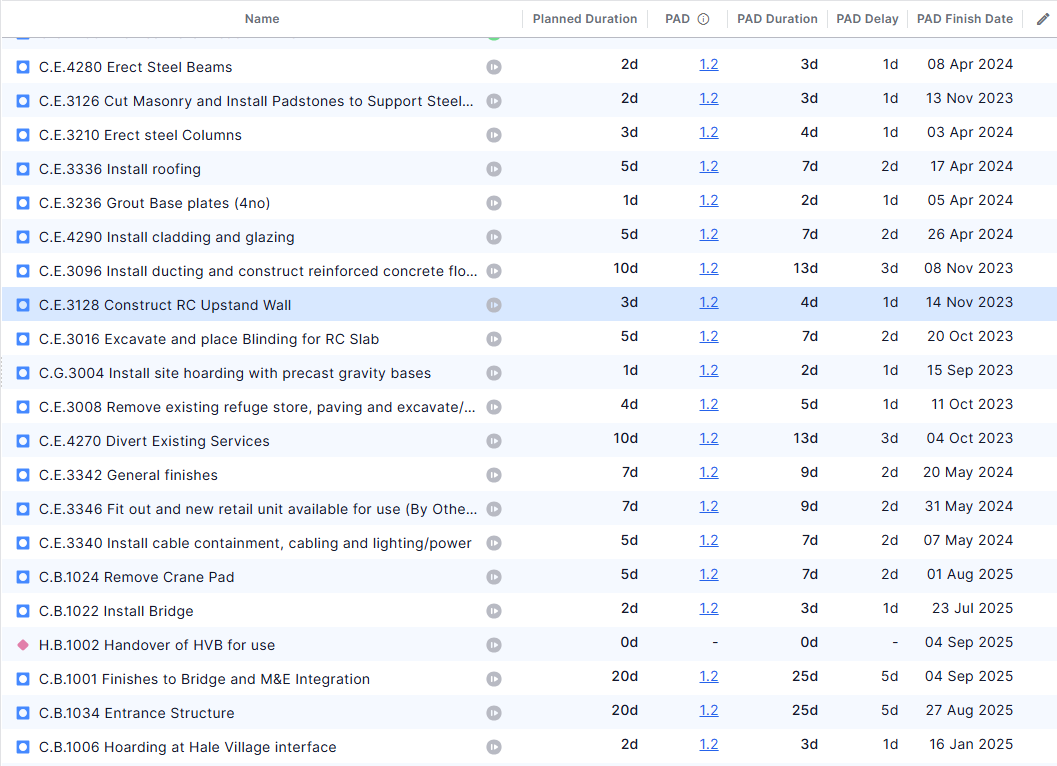
Each row in the activity list contains the following columns:
- Name — The activity name and status icon (complete, in progress, or not started)
- Planned Duration — The original planned duration of the activity in working days
- PAD — The PAD multiplier applied to this activity (clickable — opens the Applied PAD Details modal)
- PAD Duration — The predicted actual duration calculated as Planned Duration × PAD
- PAD Delay — The predicted delay for this activity in working days (PAD Duration − Planned Duration). Can be negative if the activity is predicted to finish faster than planned
- PAD Finish Date — The predicted completion date for this activity based on PAD analysis
You can customize which columns are displayed by clicking the edit icon (pencil) in the column header row. This opens an Edit Columns dialog where you can toggle additional columns such as Actual PAD, PAD Start Date, Planned Start Date, Planned Finish Date, and Total Float. Columns can also be reordered by dragging and dropping the column headers to your preferred position.
Applied PAD Details
Clicking on any PAD value (shown as a blue hyperlink in the PAD column) opens the Applied PAD Details modal. The modal explains that PAD is derived from the average of similar completed activities in the selected WBS/ACS, showing which WBS/ACS level was used for the calculation, the completed activities included, and their individual Actual PAD values.
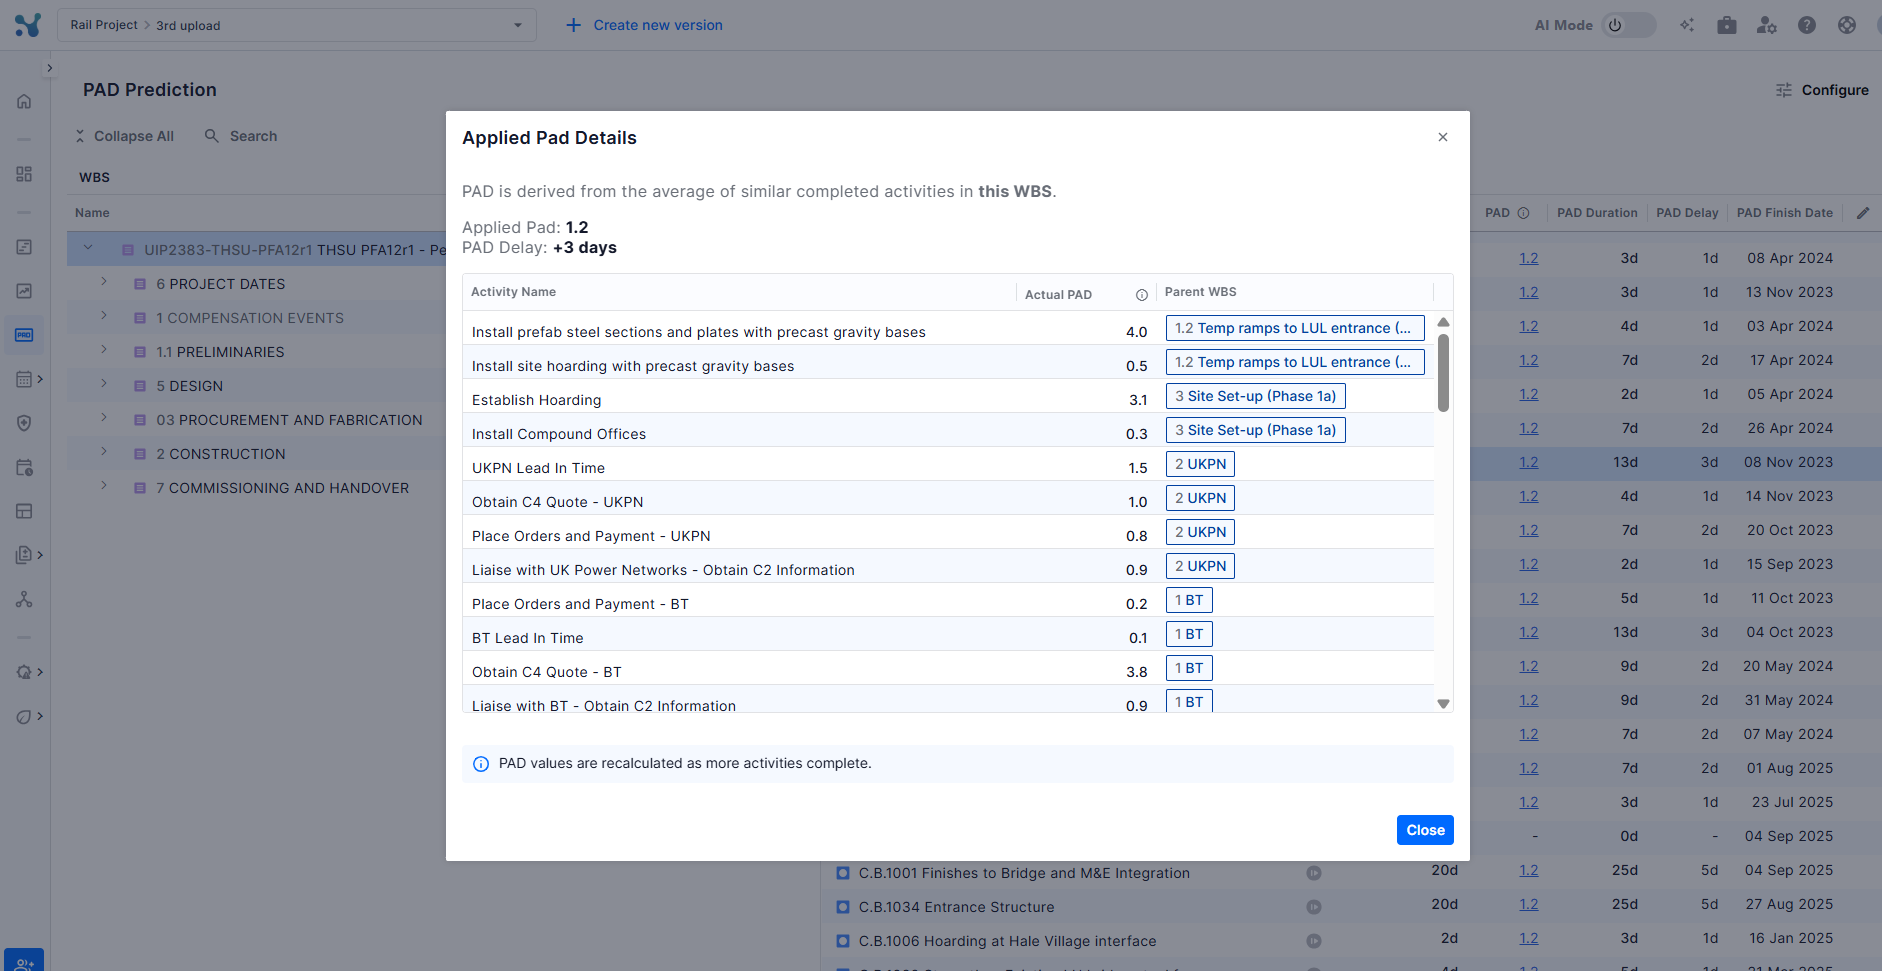
The modal contains:
- Applied PAD — The PAD multiplier value that has been applied to this activity
- Total Delay — The delay contribution from this activity
- A table of the completed activities from the applicable hierarchy level (WBS or ACS), with columns showing each activity's Actual PAD value (Actual Duration ÷ Planned Duration) and the Parent WBS/ACS node from which the data was sourced — the average of all Actual PAD values is the Applied PAD
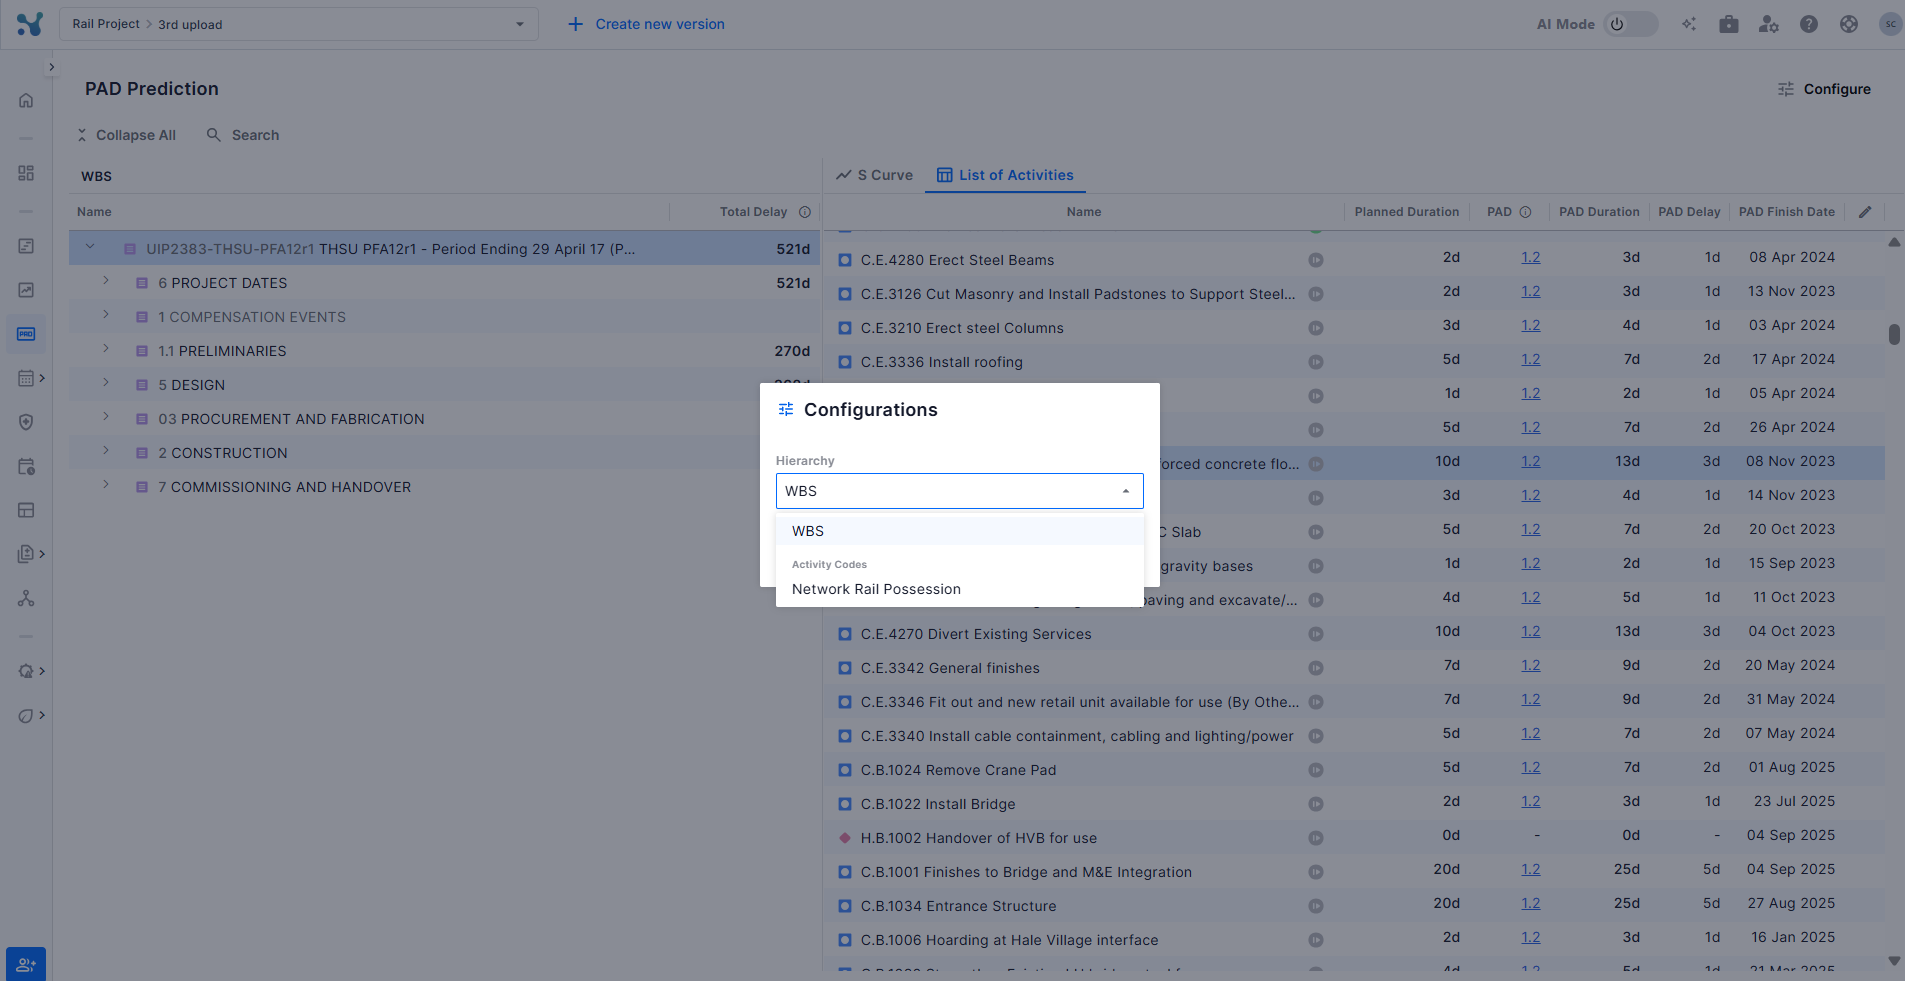
Configuring the Hierarchy
Use the Configure button (top right of the PAD Prediction page) to customize how the left-panel hierarchy is structured. This allows you to analyze PAD predictions across different organizational breakdowns.
In the Configurations panel:
- Hierarchy — A dropdown to select how activities are grouped. Options include WBS (the default project breakdown) or any Activity Code defined in the schedule (e.g. LOC1, LOC2, Area codes, Change codes, etc.)
Click Save to apply your selection. The left-panel will refresh to reflect the new hierarchy grouping.
Understanding PAD Values
PAD (Performance Against Duration) is the ratio of an activity's Actual Duration to its Planned Duration. For a given hierarchy node (WBS or ACS), the Applied PAD is the average of this ratio computed across all completed activities within that node.
- PAD = 1.0 — Activities are completing exactly on time (no delay expected)
- PAD > 1.0 — Activities are taking longer than planned (e.g. PAD of 1.33 means activities are taking 33% longer)
- PAD < 1.0 — Activities are completing faster than planned
- A dash ( - ) in the PAD column — No PAD could be computed (e.g. activity is already complete)
- 💡 How the Applied PAD is computed: For each hierarchy node (WBS or ACS), the system collects all completed activities and computes each one's individual PAD (Actual Duration ÷ Planned Duration). The average of these values becomes the Applied PAD. A minimum of 10 completed activities is required. If the current WBS node has fewer than 10, the system automatically escalates to the parent WBS level and repeats the check, continuing up the hierarchy until a level with at least 10 completed activities is found.