🛣️ Paths
Find the critical and near-critical paths that drive the delivery of any activity, fast and easy. Select the path that you care about and see the context using the Gantt chart. Export and share the information with a single click.
This screen enables you to:
- Find the paths that are driving the performance of your activity
- Find paths that drive activity and pass through another activity
- Export paths in a way that can be easily shared
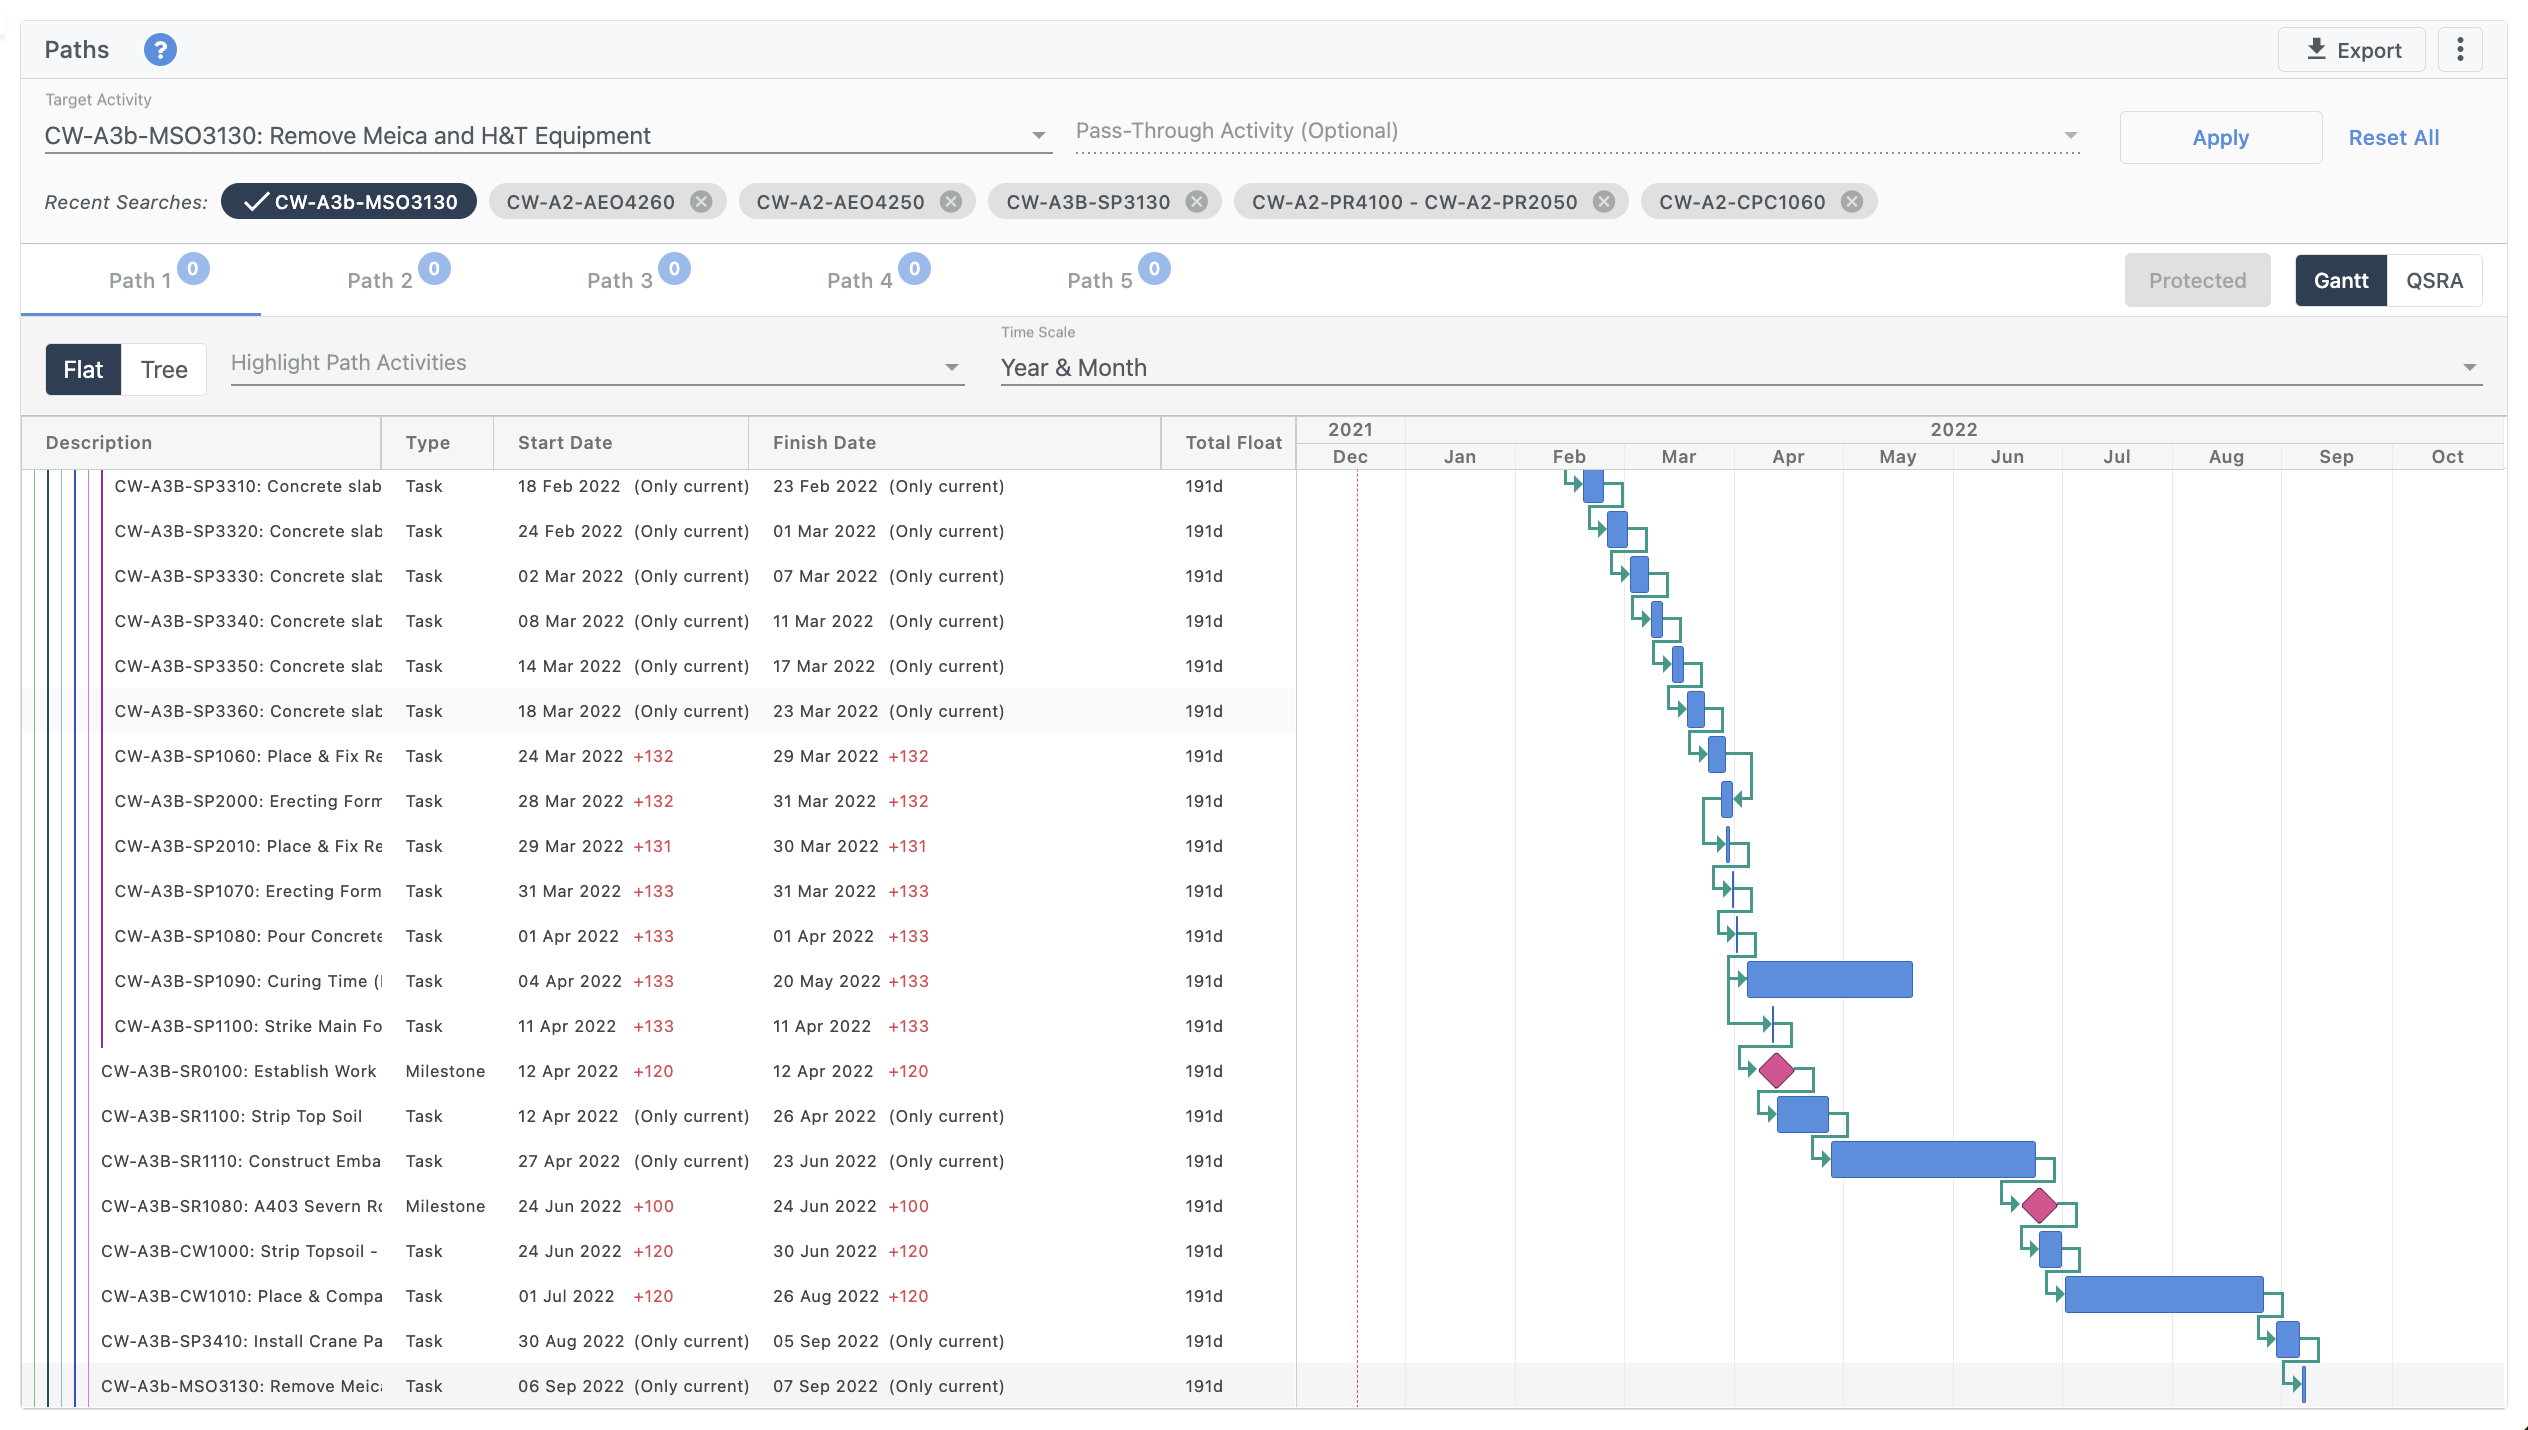
Find the paths that are driving the performance of your activity
This screen helps identify the top 5 most critical paths that drive the performance of any activity. This can include both critical and near-critical paths.
Once you select an activity, we find all the paths that lead up to the activity you have selected. We then rank these paths based on their total path float (i.e., the sum of free floats of all activities within any given path). The outcome is the Top 5 most important paths for your selection - this may include the project’s critical path and near-critical paths, depending on the position of your target activity.
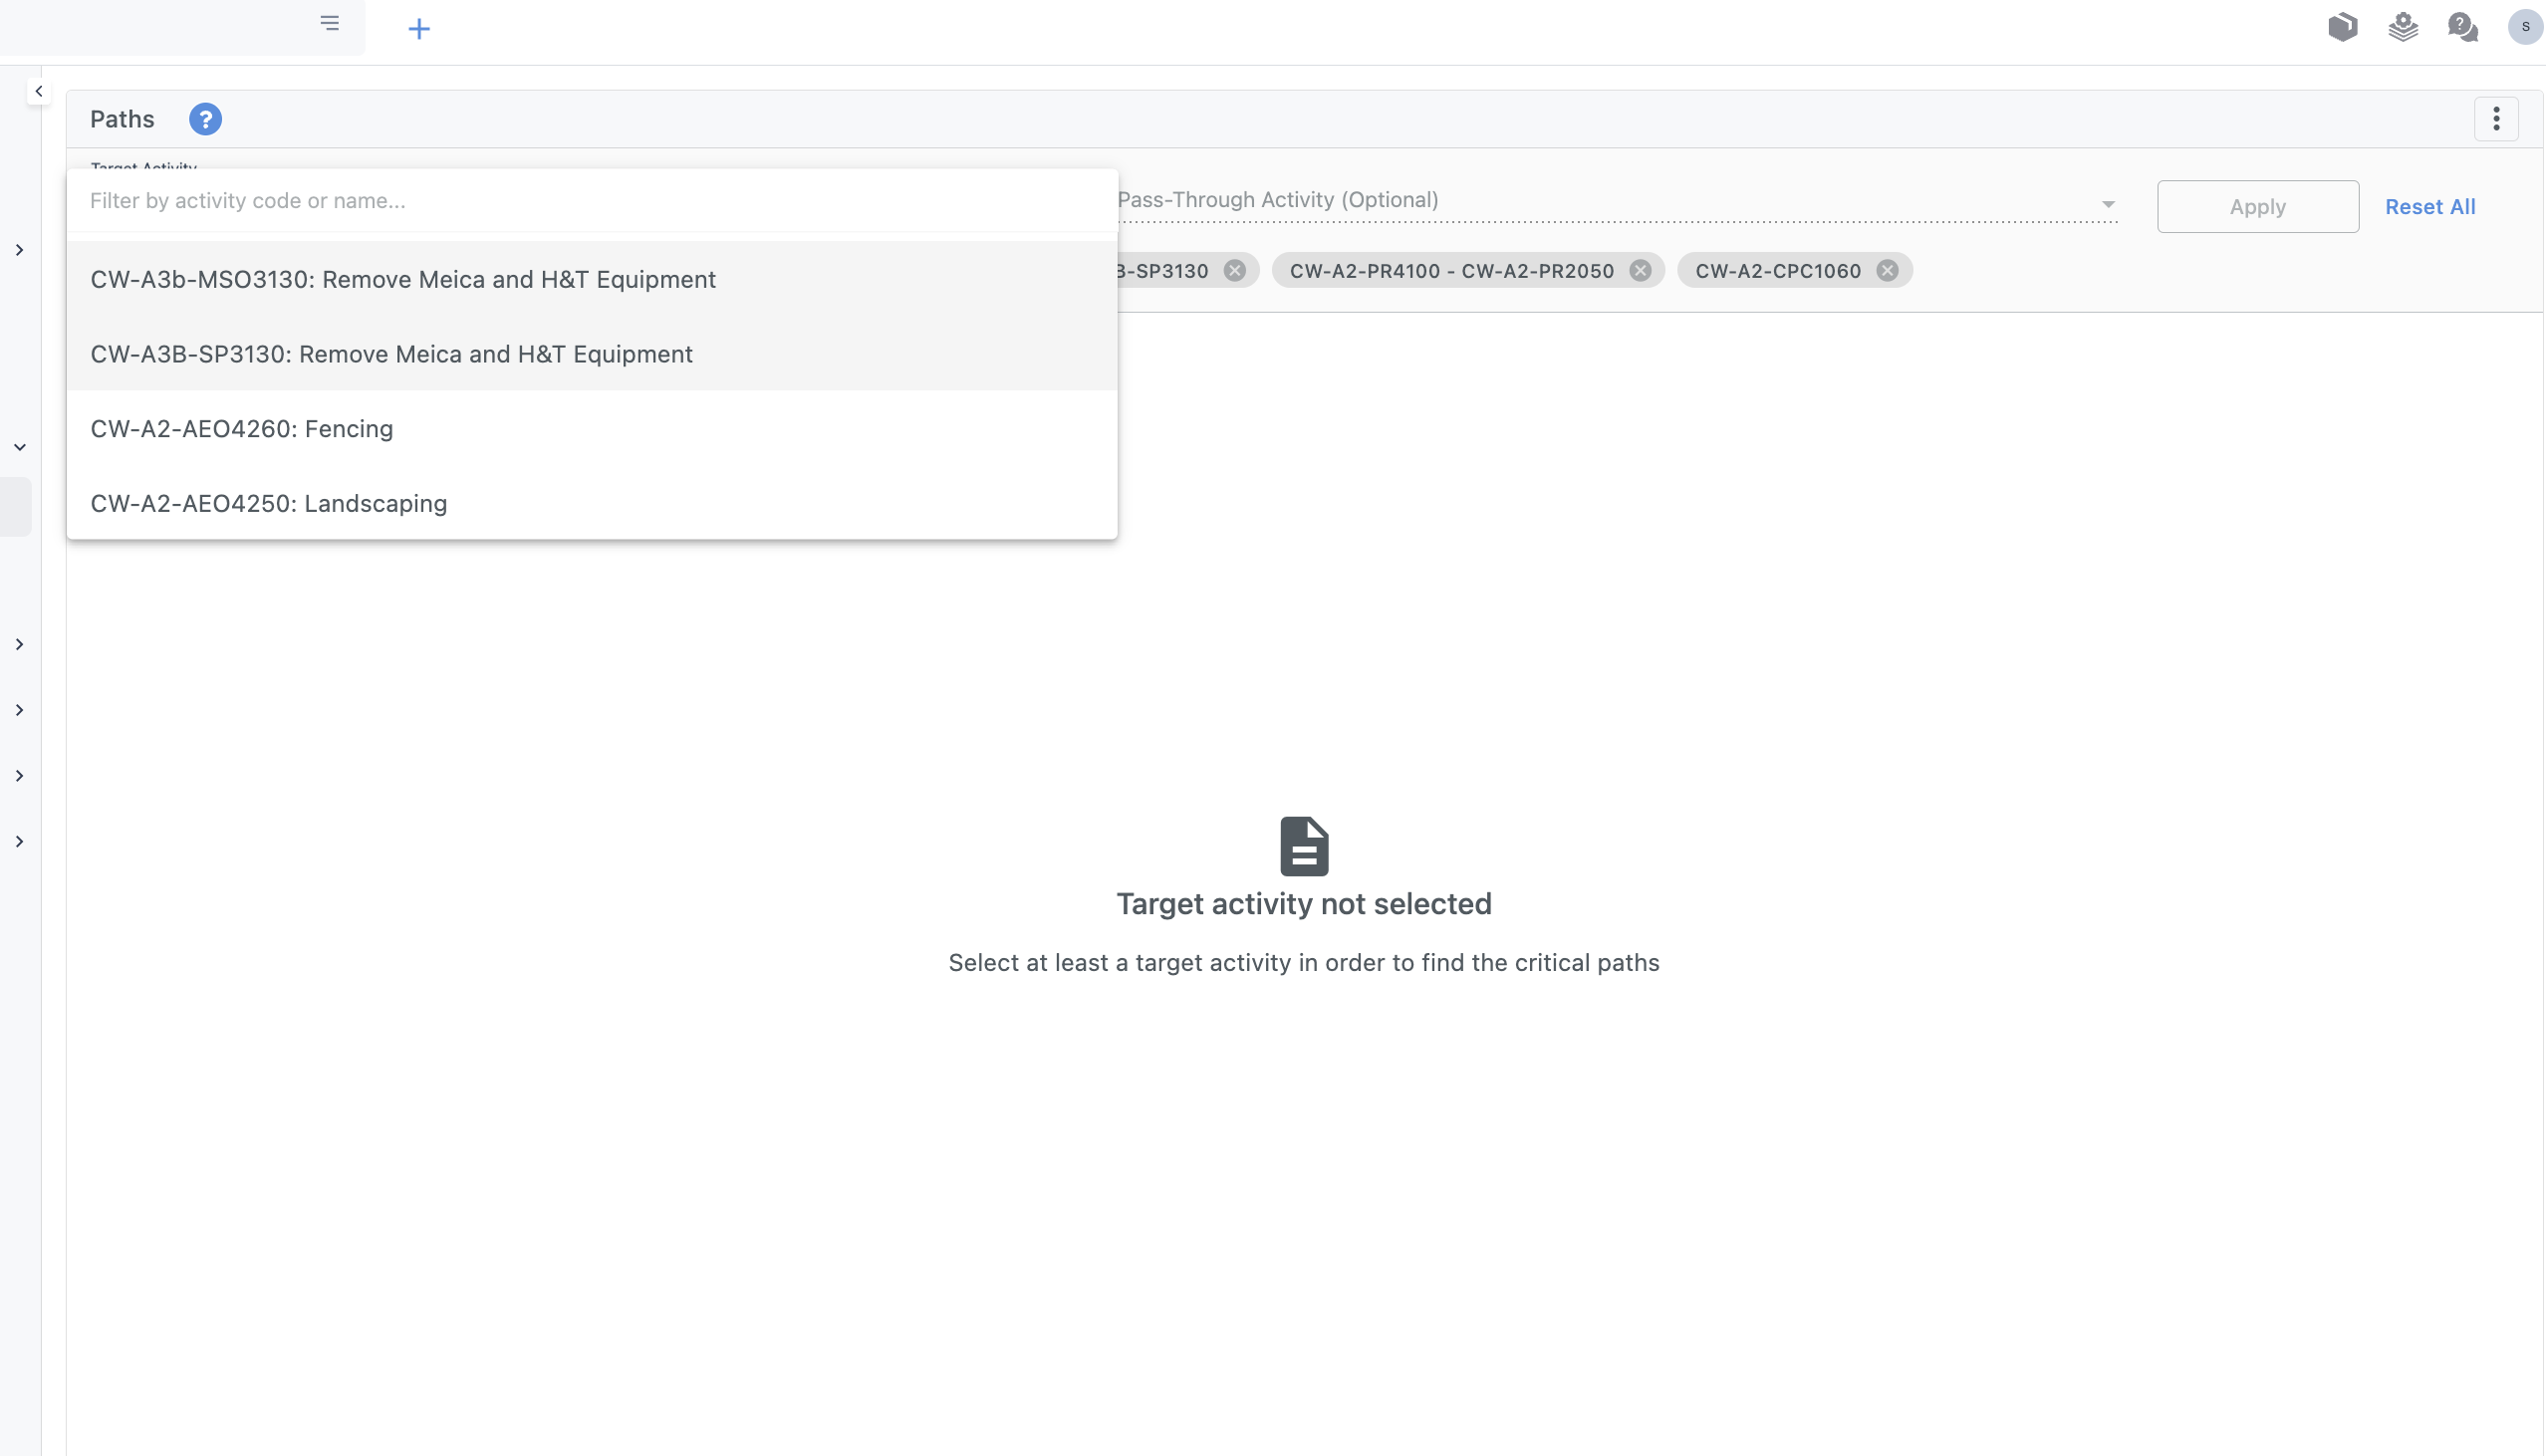
To use, simply use the drop-down on the left side of the top bar to find your activity. You can also type the name or ID of the activity to automatically search for it. Once you have selected your target activity, simply click apply and the Top 5 most important paths will pop up as tabs.
You will then see a visual of each of the 5 paths leading to your target activity. You can choose the best time scale that suits you best to view the paths (Year, Year & Quarte, and Year & Month) using the ‘Time Scale’ drop-down menu. You can also choose to highlight specific activities on the path using the ‘Highlight path Activities’ drop-down menu.
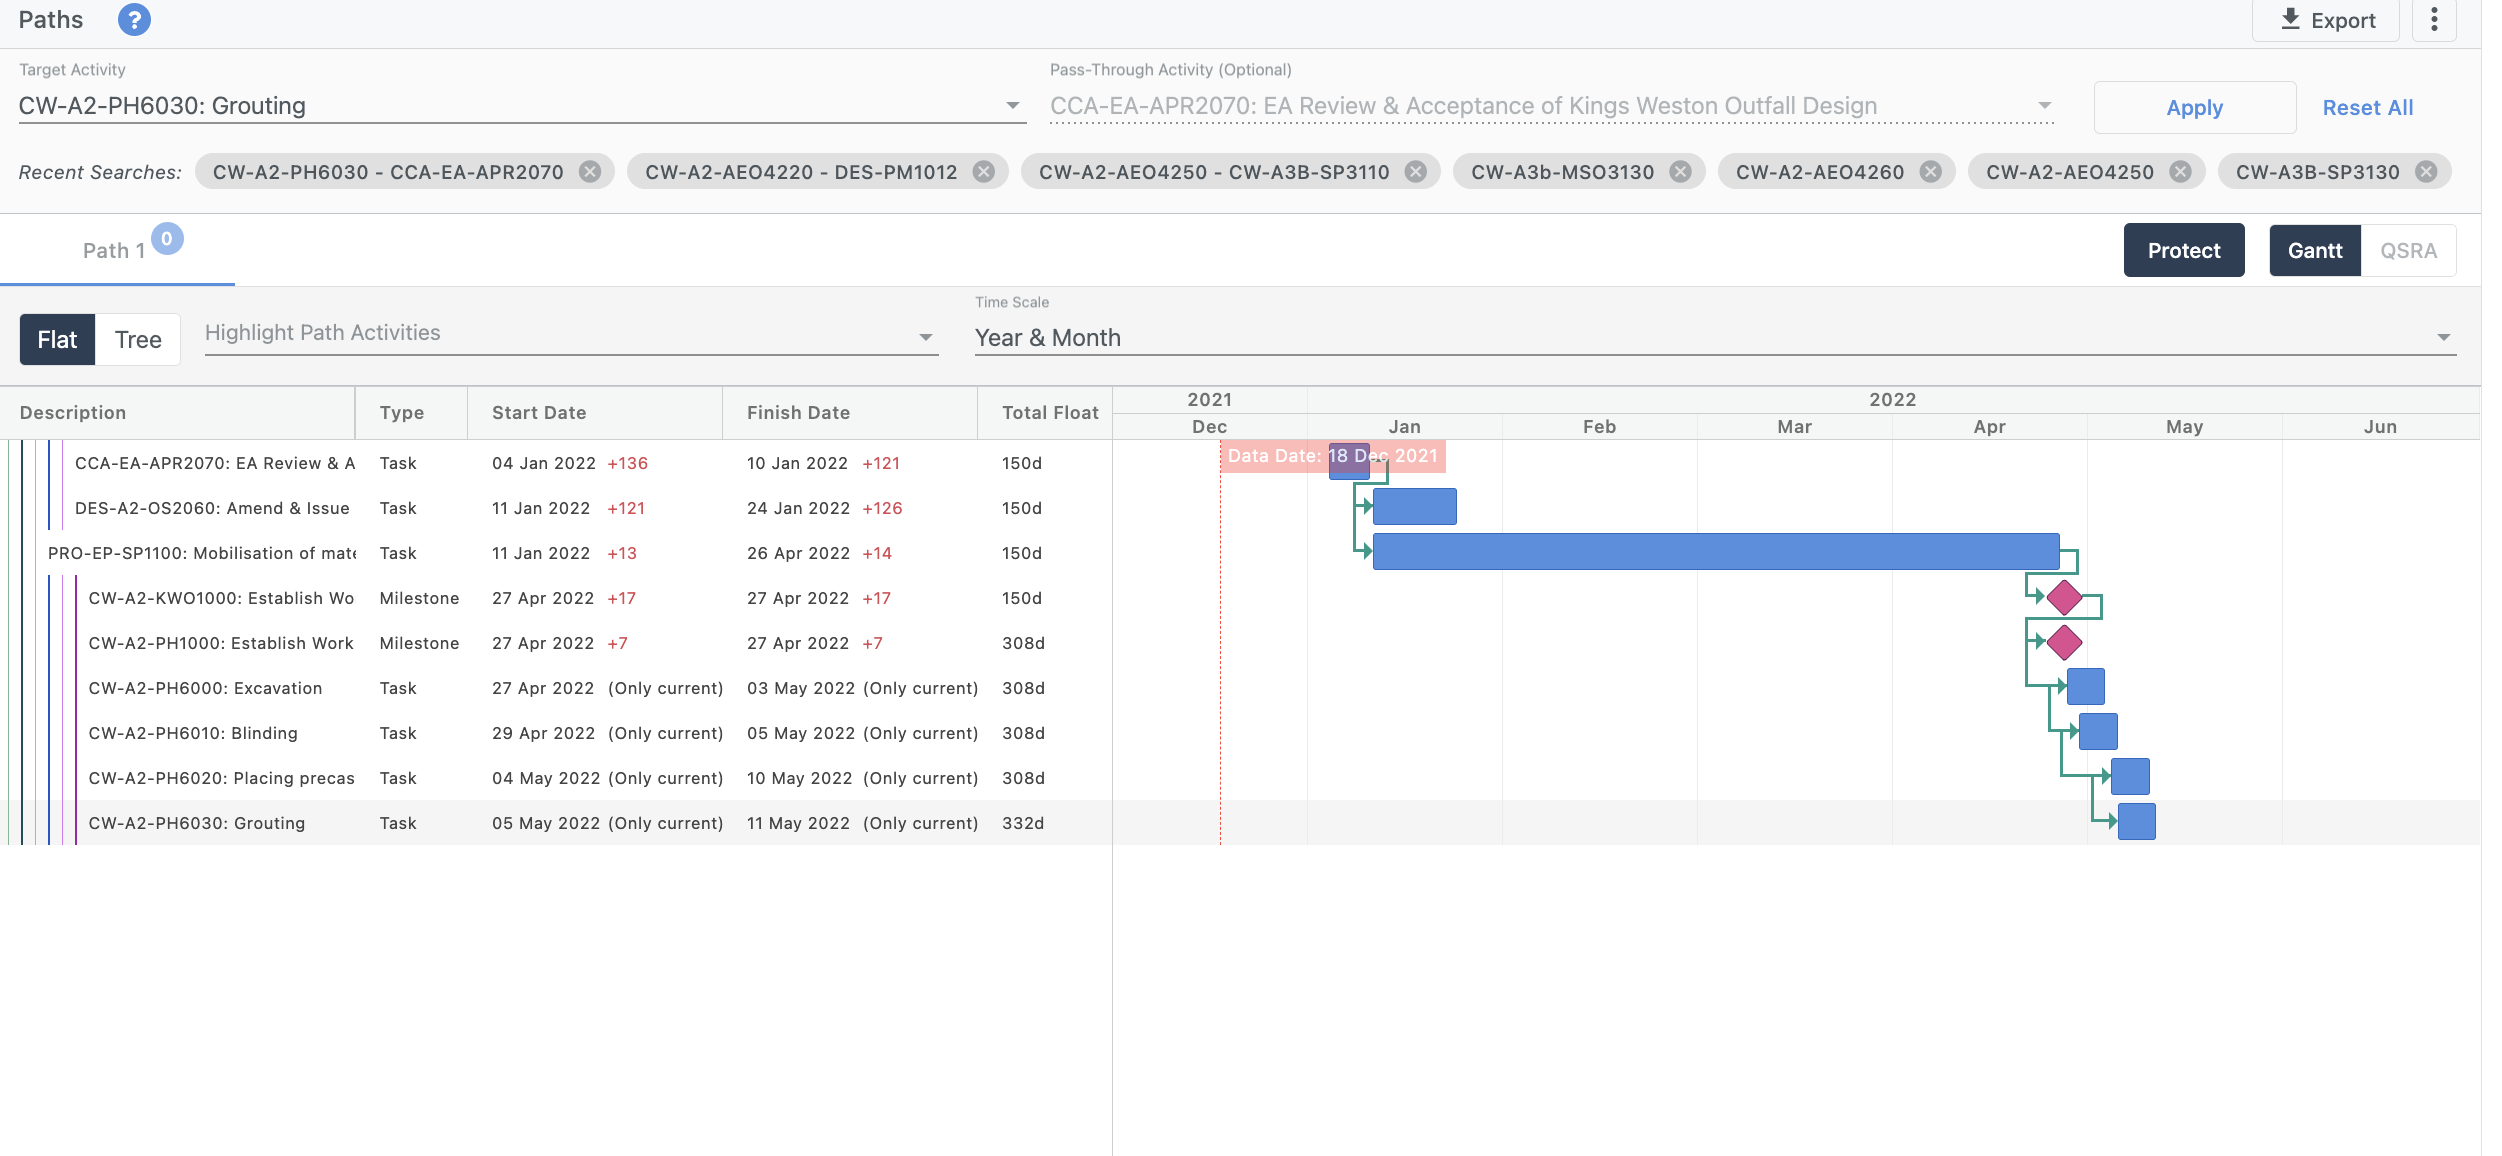
Find paths that drive activity and pass through another activity
Sometimes you may want to find the Top 5 paths that drive the performance of a particular actiivty and pass through another activity. In other words, you may want to find the Top 5 paths that drive activity A and pass through activity B. You can easily introduce this condition by choosing your target activity as before (top left dropdown) and select an additional activity from the Pass Through drop down menu (top center drop down). Note that this selection will only include activities that are part of paths that result in your target activity.
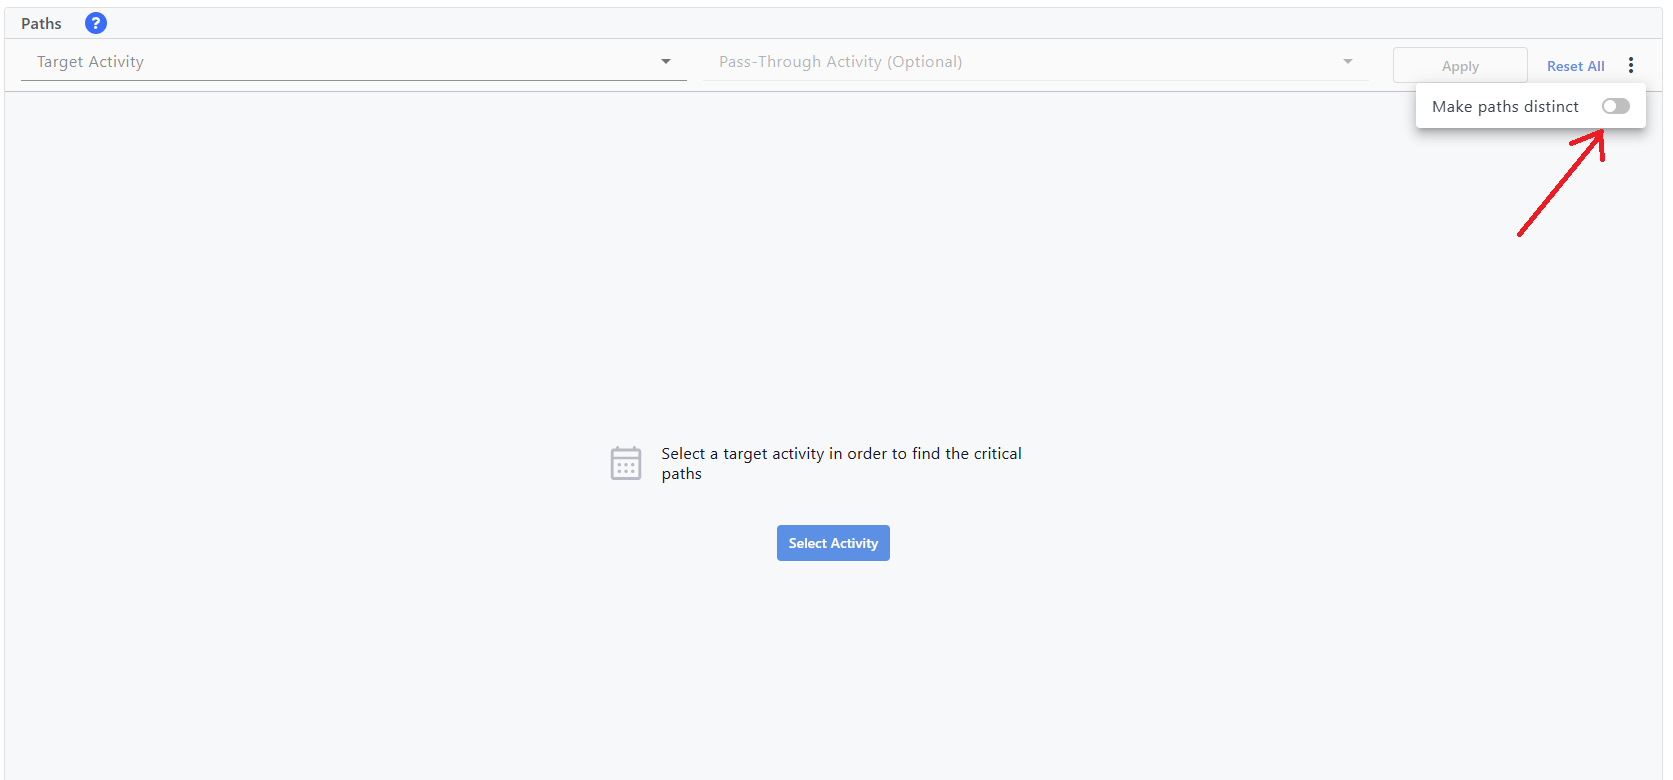
Explore distinct paths
The Paths screen includes a “Make paths distinct” toggle in the three-dot menu at the top-right corner.
- OFF: Paths may share intermediate activities.
- ON: Only paths that share no intermediate activities except the final destination are returned.
- Limits: Up to 5 distinct paths are shown; if fewer exist, only those are displayed.
This mode helps users explore alternative routes to a target activity without redundancy in intermediate steps.
Export paths in a way that can be easily shared
You can easily export the Top 5 paths that are driving a specific activity by simply clicking on the export button on the top right of the screen. You can choose the format of the export, between PDF or PNG.
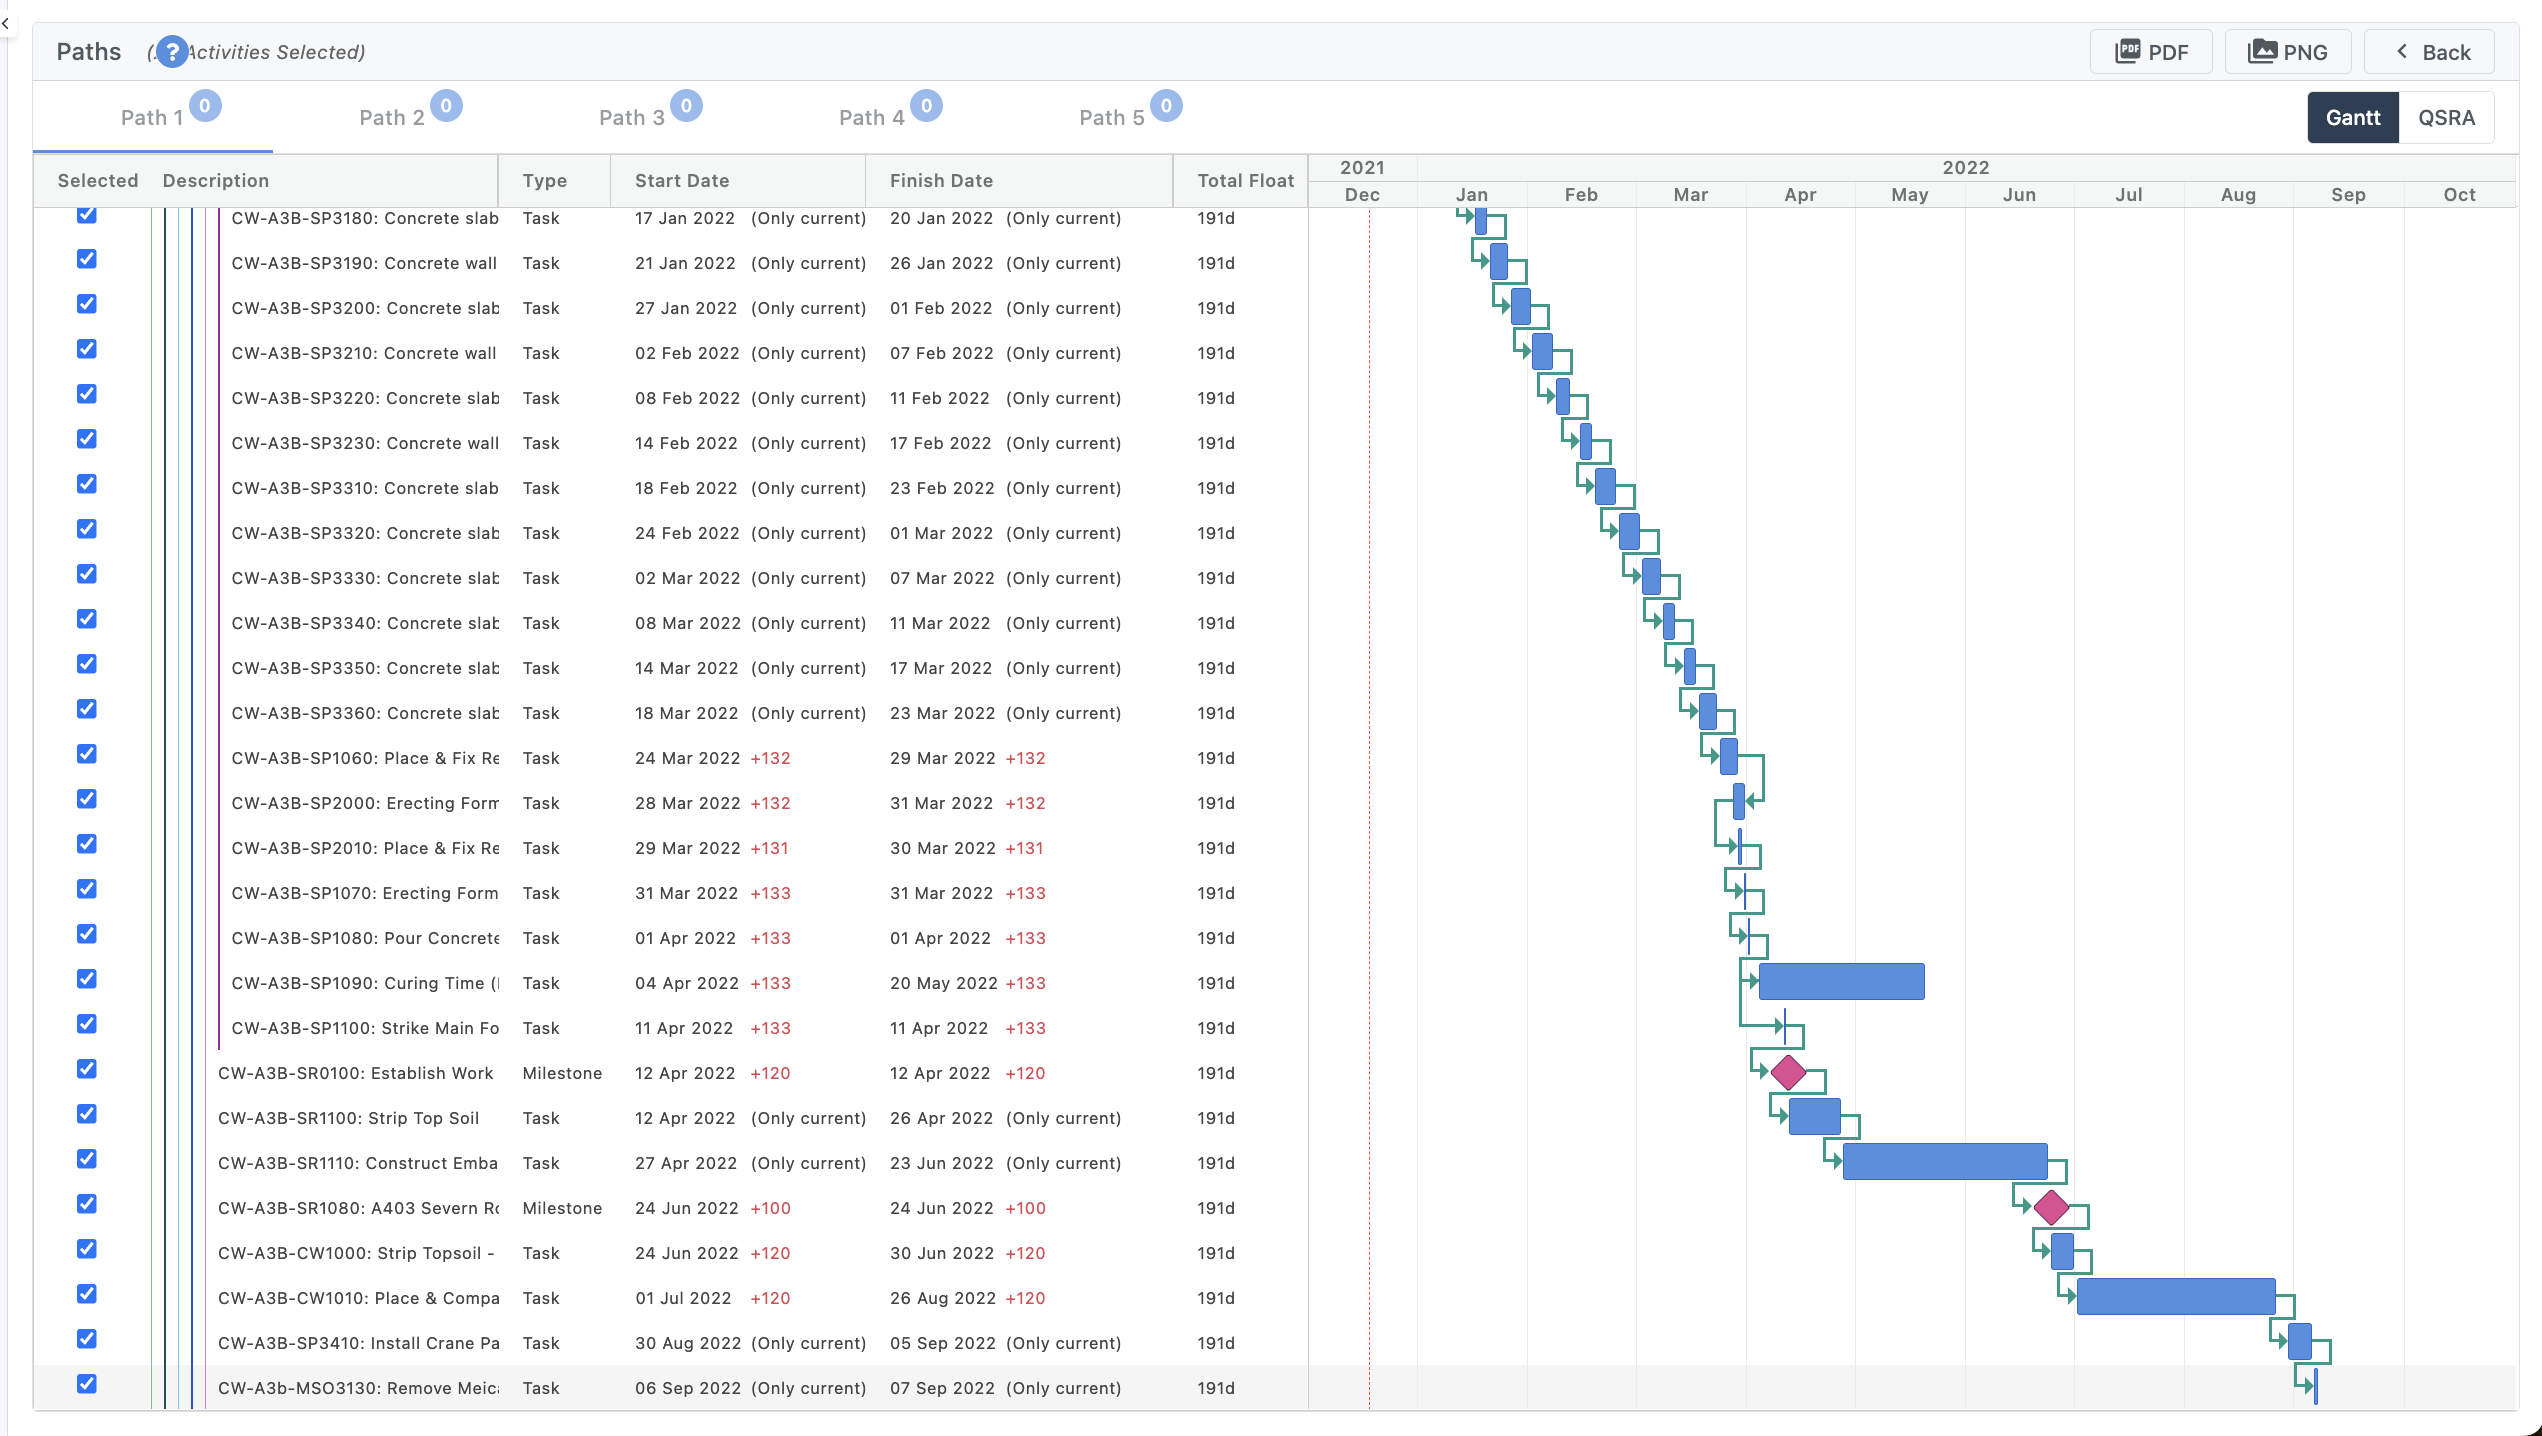
Technical Note: You can also choose to export a specific range of activities from the path by simply defining an export range using the ‘Selected Column’ at the left side of the table.
