🪴 Carbon
This screen enables you to:
- Get an overview of you schedule’s Carbon footprint.
- Drill down on your carbon footprint to an activity level.
- Understand the impact delays will have on your project, carbon wise.
Get an overview of your schedule’s Carbon footprint.
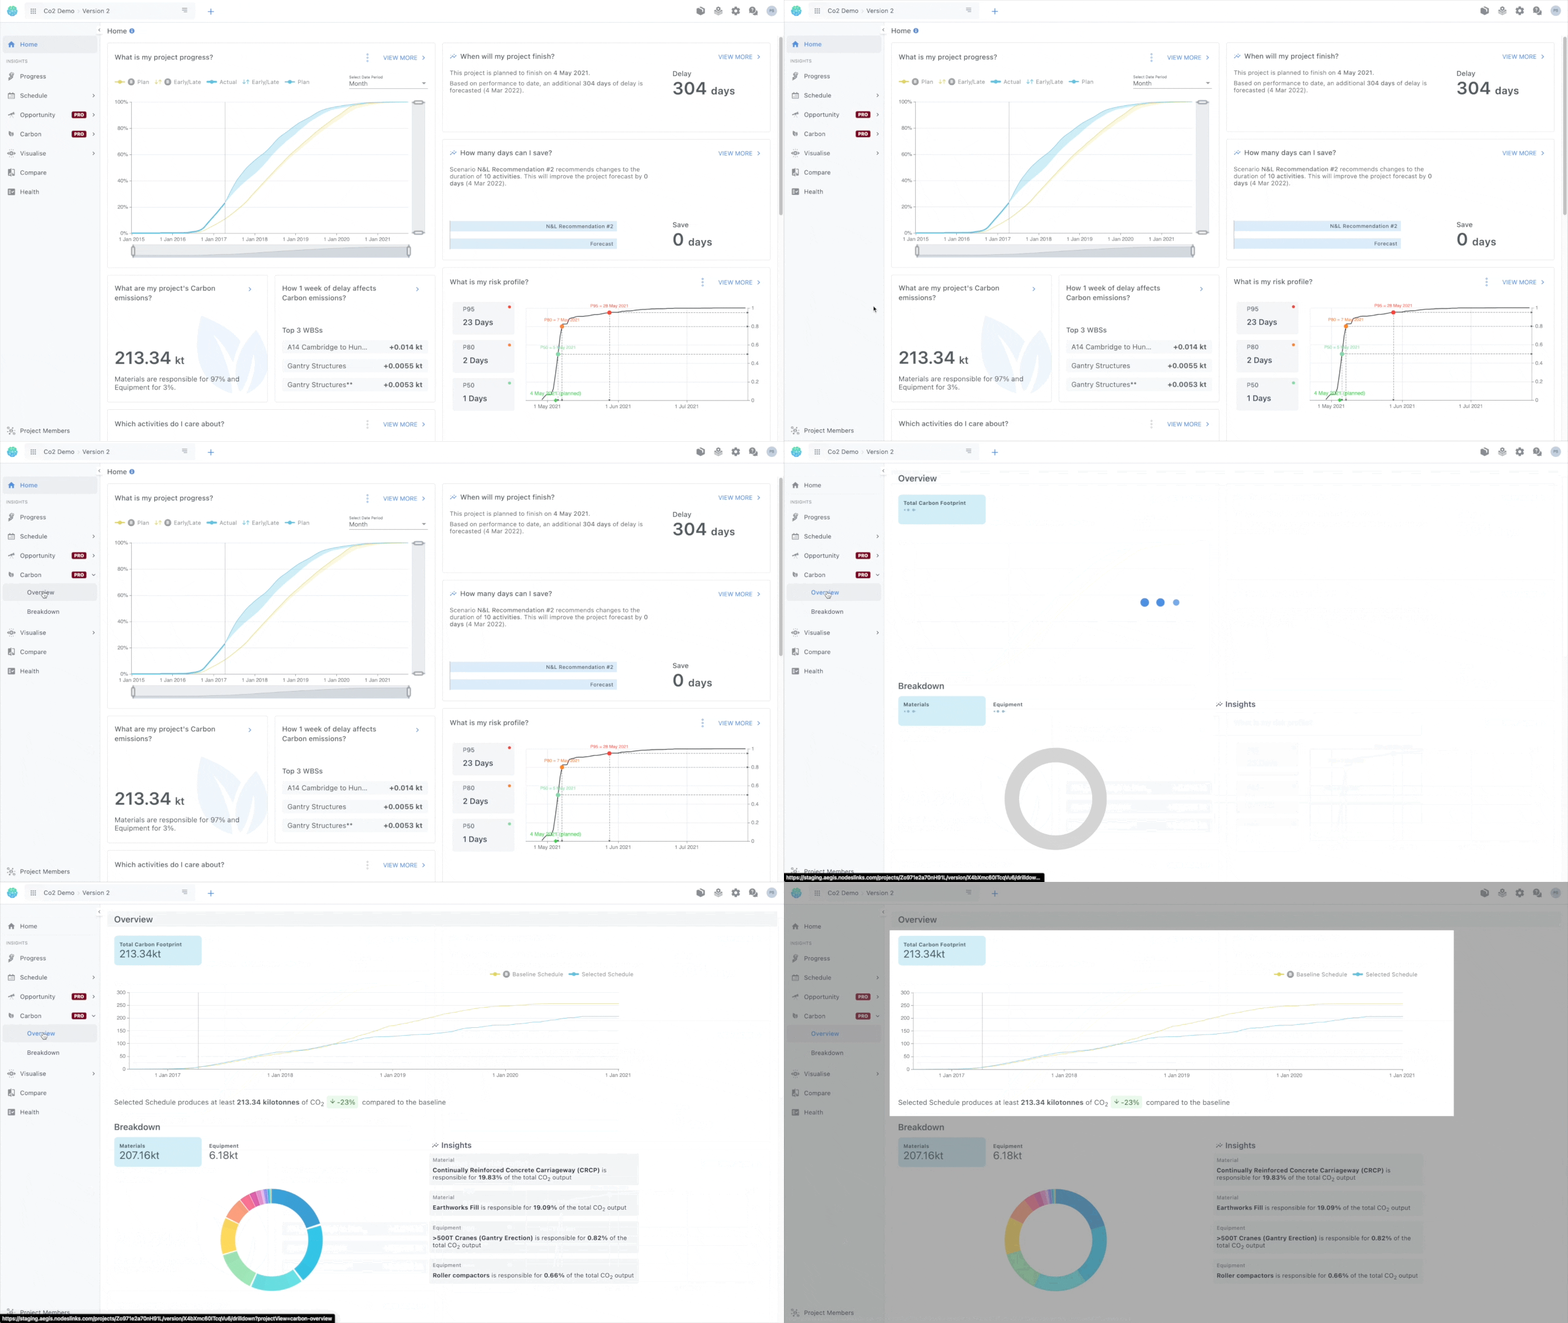
You can easily get an overview of your schedule carbon-wise by navigating to the Carbon overview page. There you will find an s curve widget showcasing:
- The accumulated carbon of your currently selected schedule
- The accumulated carbon of your baseline schedule.
- The total carbo production of your schedule in kilotonnes
- The difference between the two schedules percentage-wise
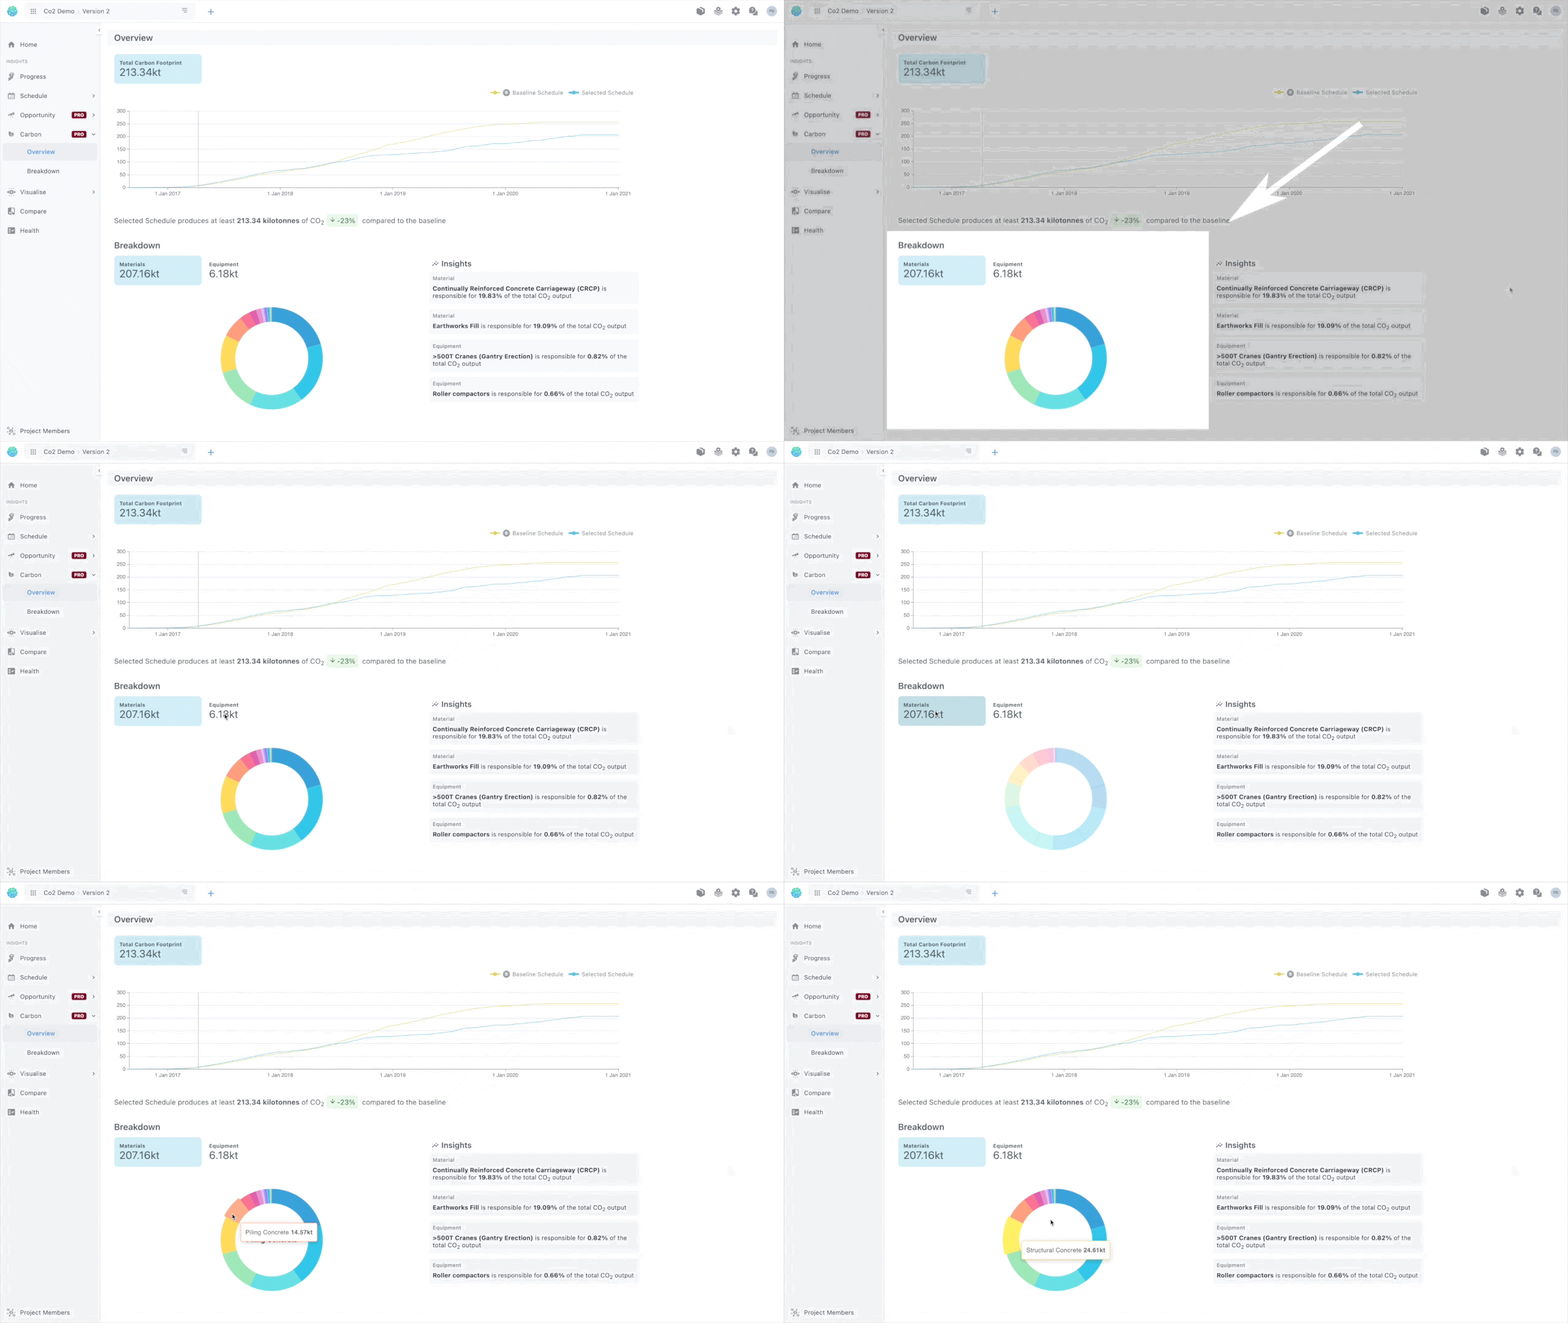
Finally, at the bottom right, you can quickly grasp the big carbon offenders by looking of the screen where you will be presented with 4 of the worst environmental performers, 2 for materials and 2 for equipment respectively.

At a glance: If you don’t want to dive into details, you can get your current schedule’s carbon footprint and the breakdown of materials and equipment percentage-wise just by looking at the home screen
Drill down on your carbon footprint to an activity level.
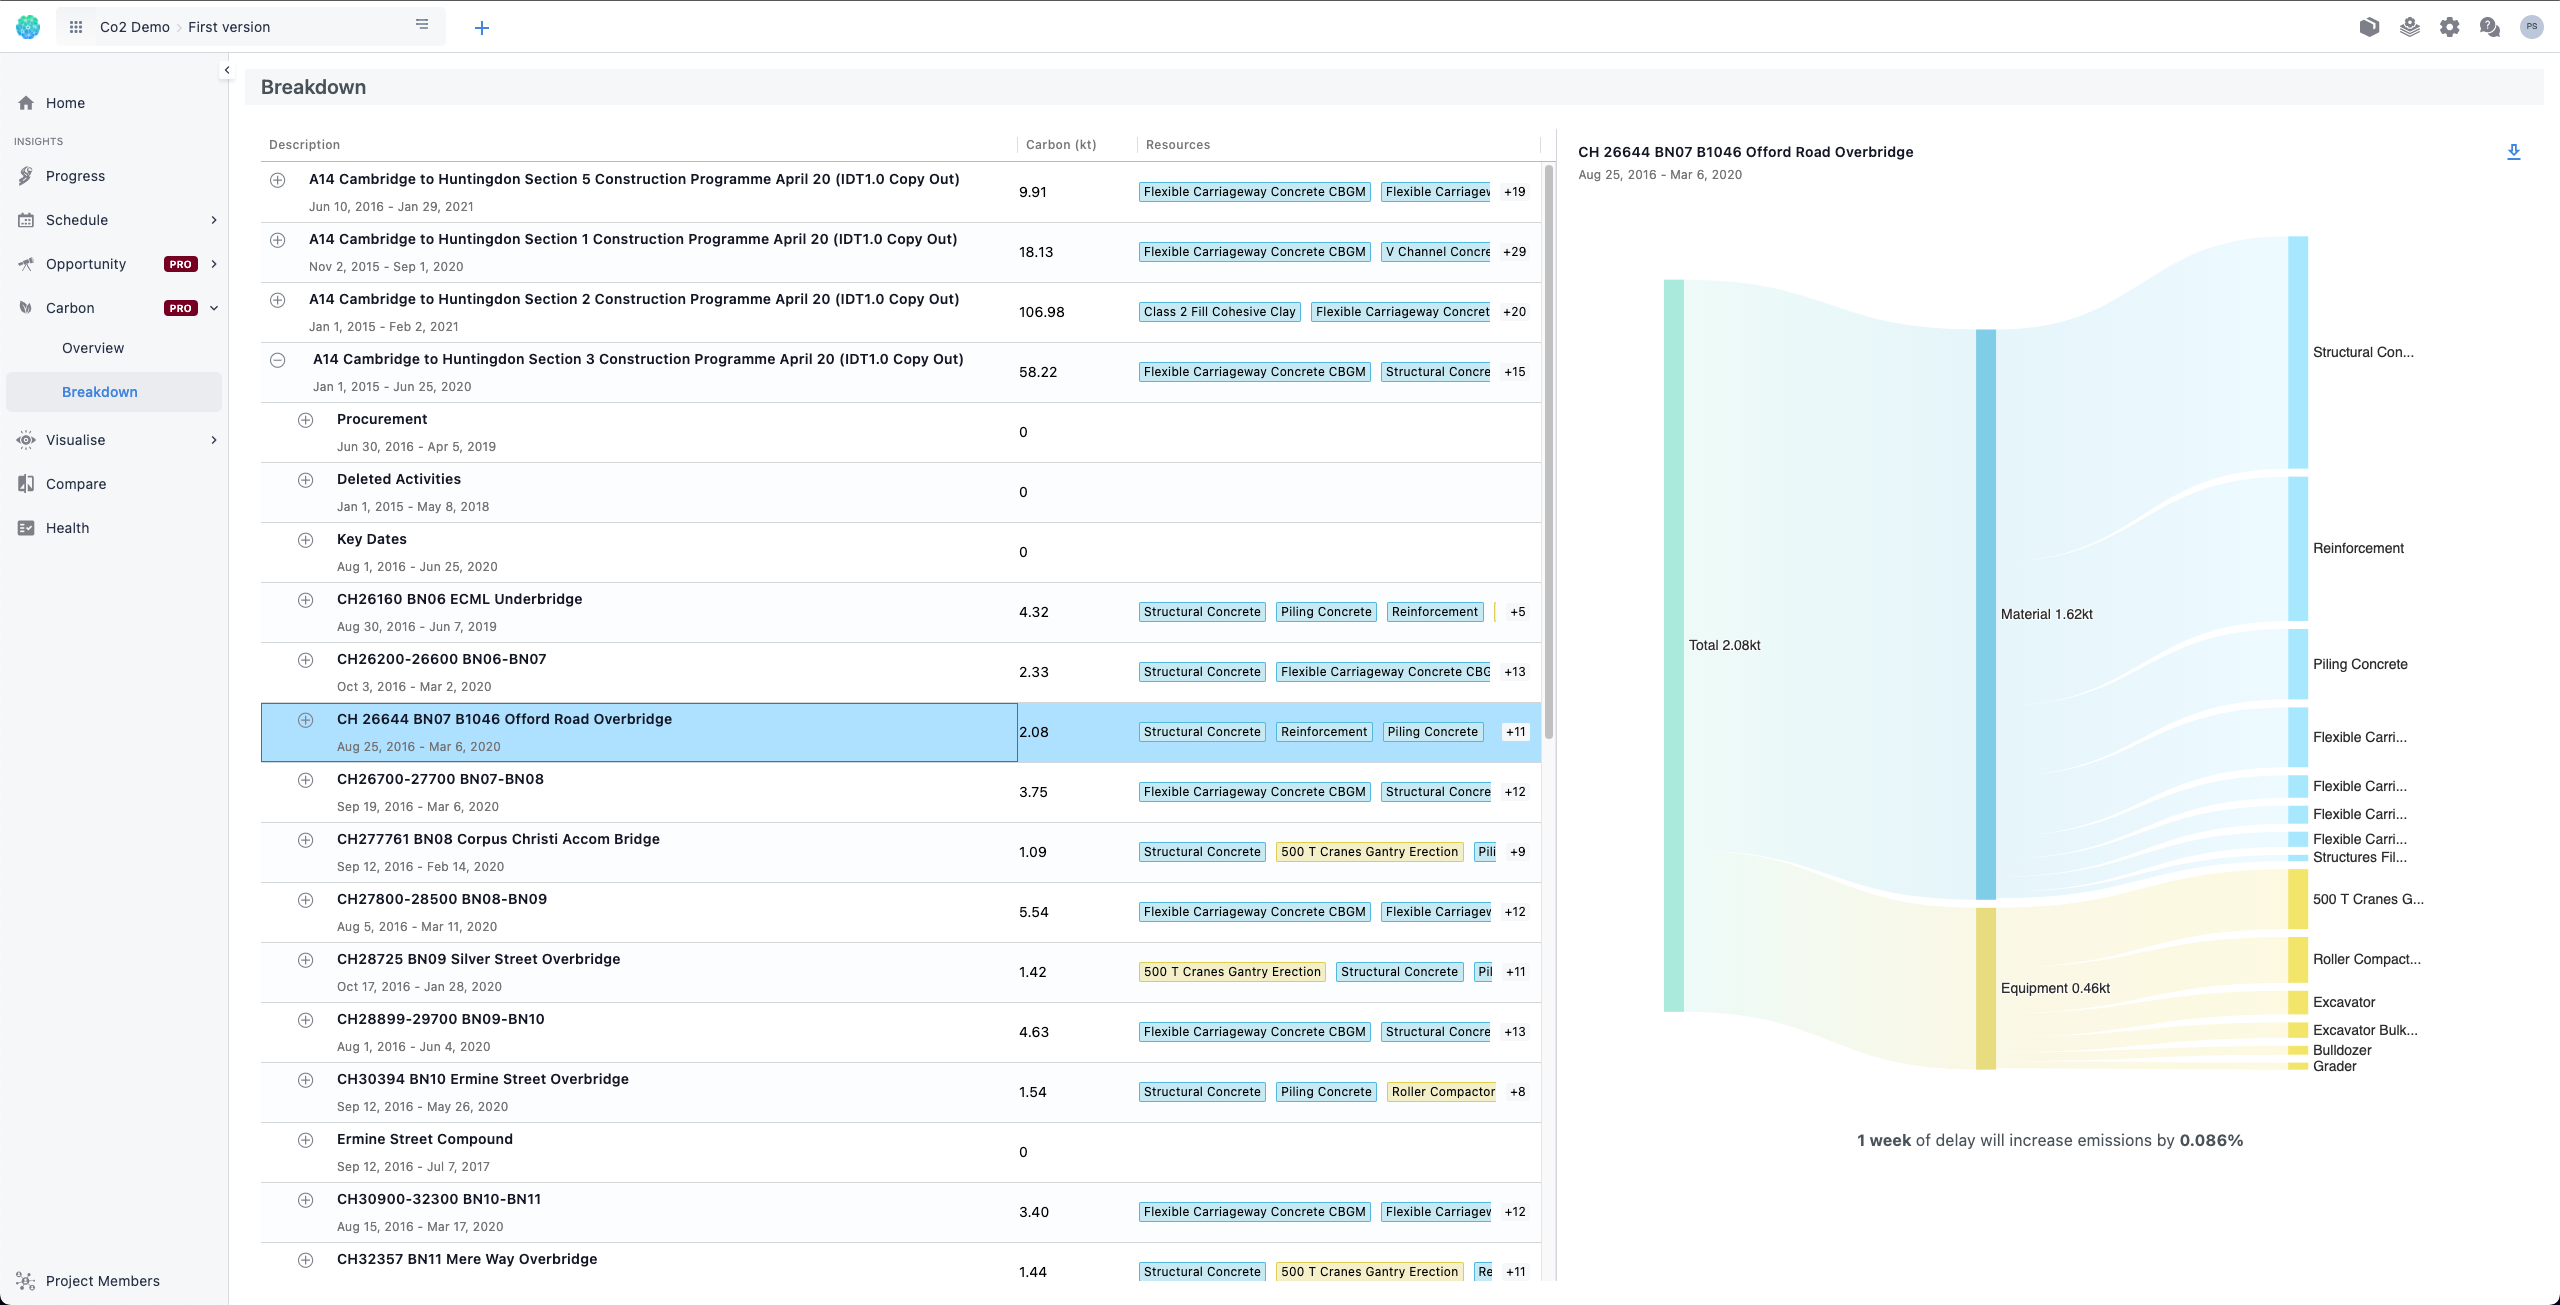
By accessing the Carbon breakdown page you can drill down looking for carbon to an activity level.
- On the left of the page, there is a WBS/Activity hierarchy tree.
- Clicking on any of the WBSs or activities will result in
- The sankey graph on the right depicts a breakdown of carbon per resource for selected WBS or activity.
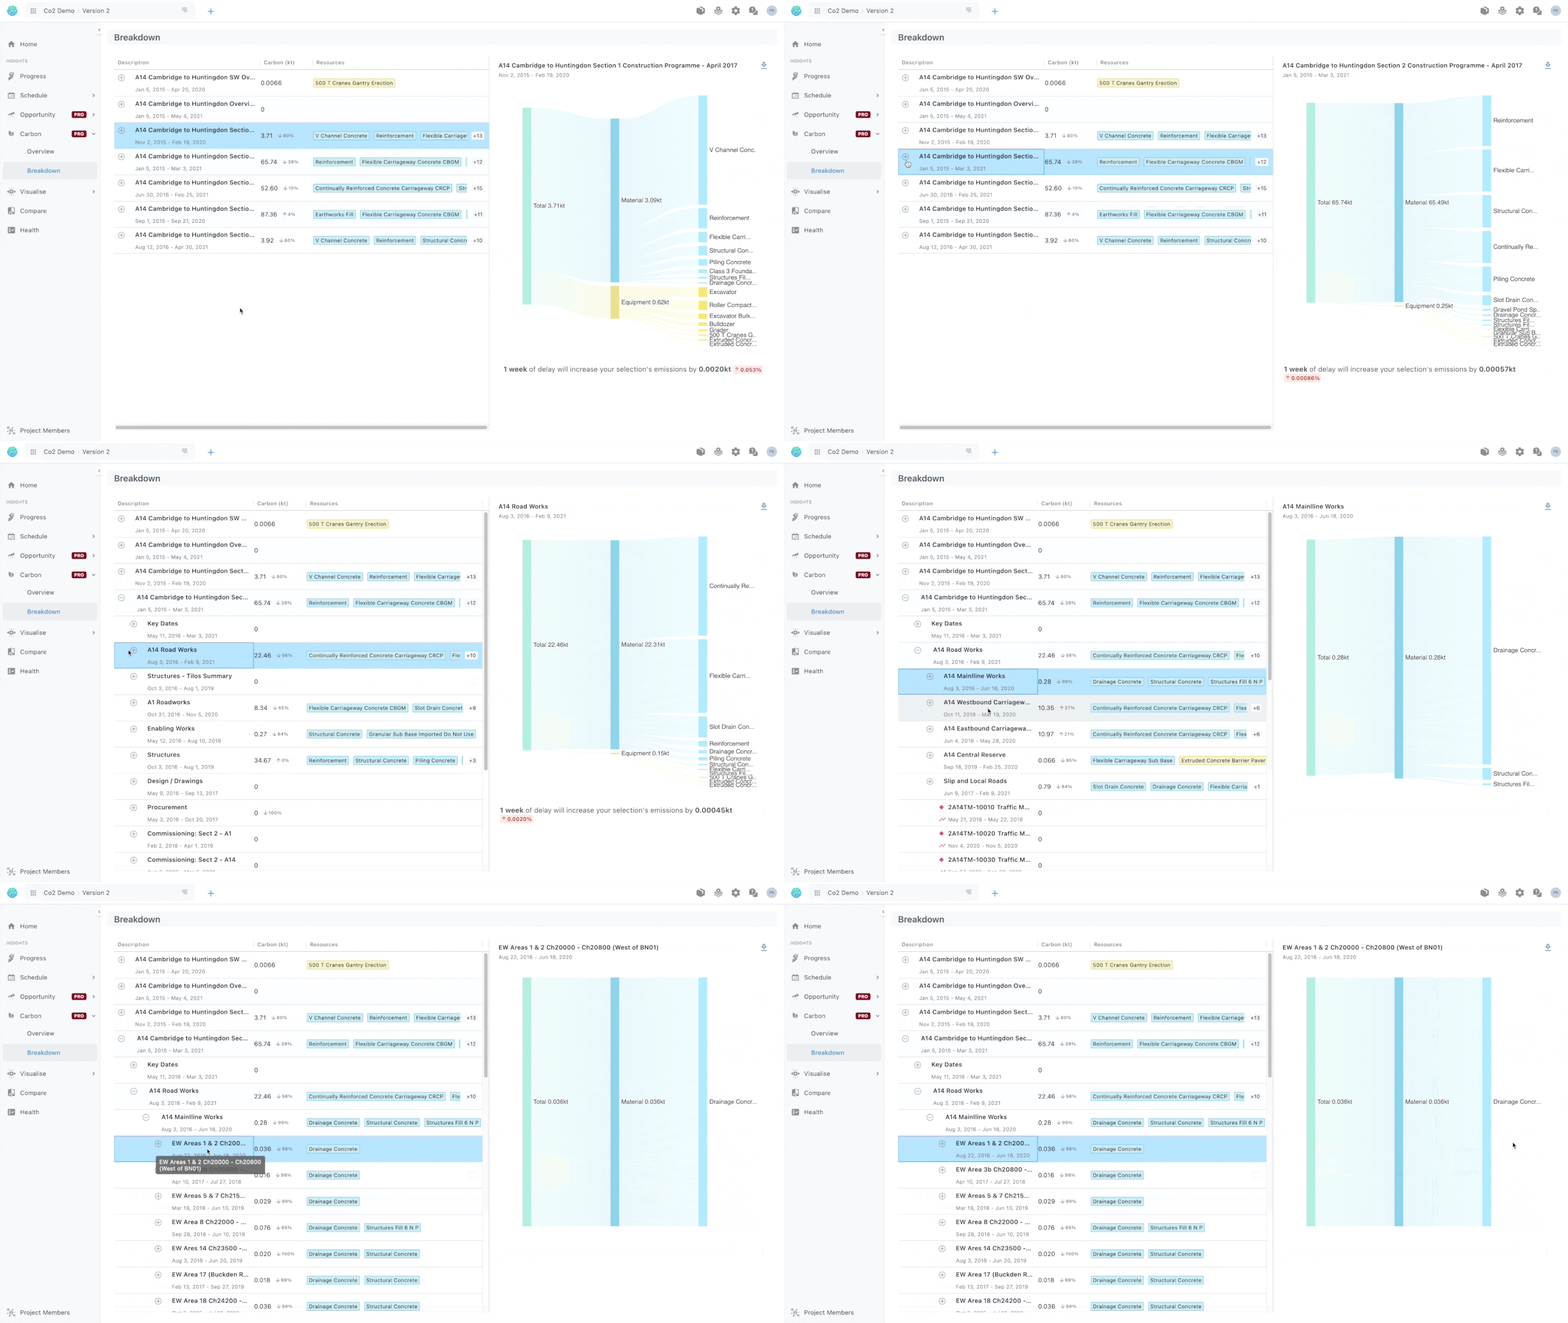
💡For every activity or WBS you also have a comparison with the baseline schedule available
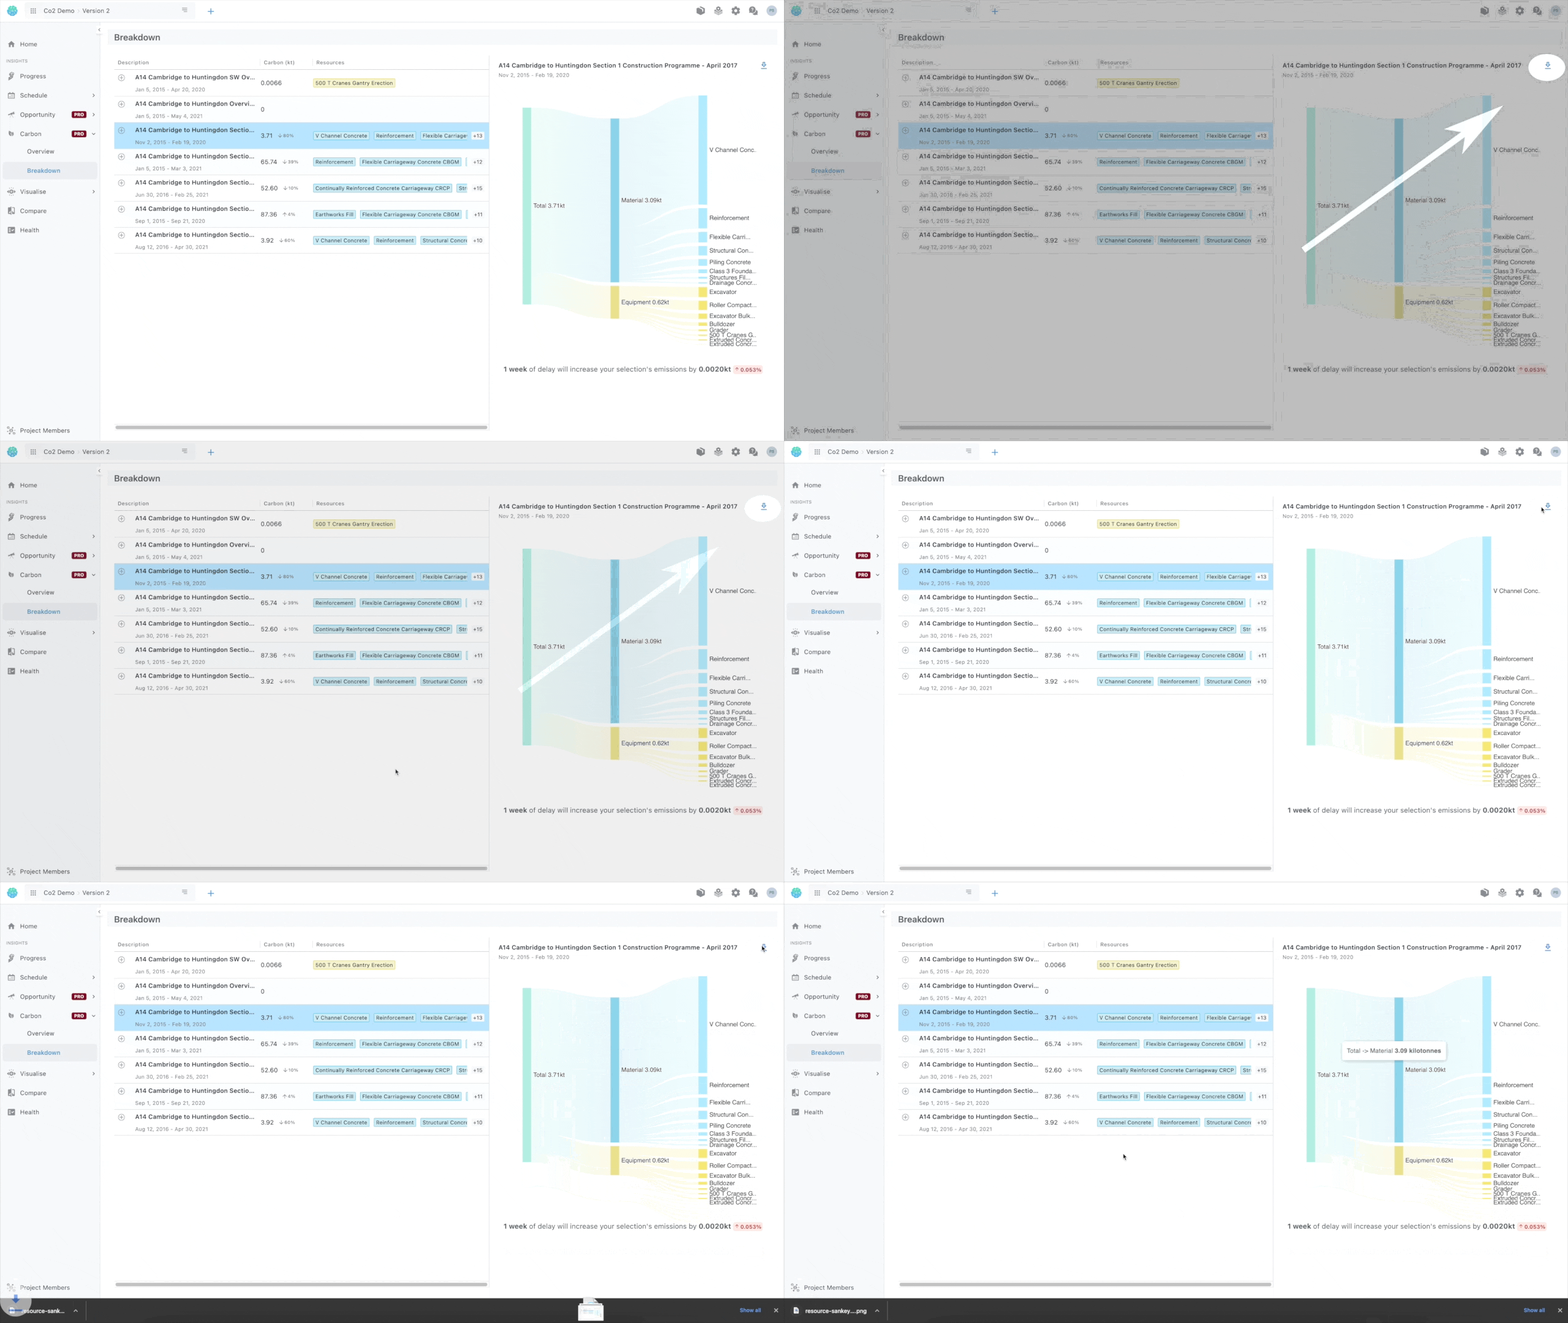
After finding a specific piece of information that you would like to convey, you can export the sankey graph depicting said information
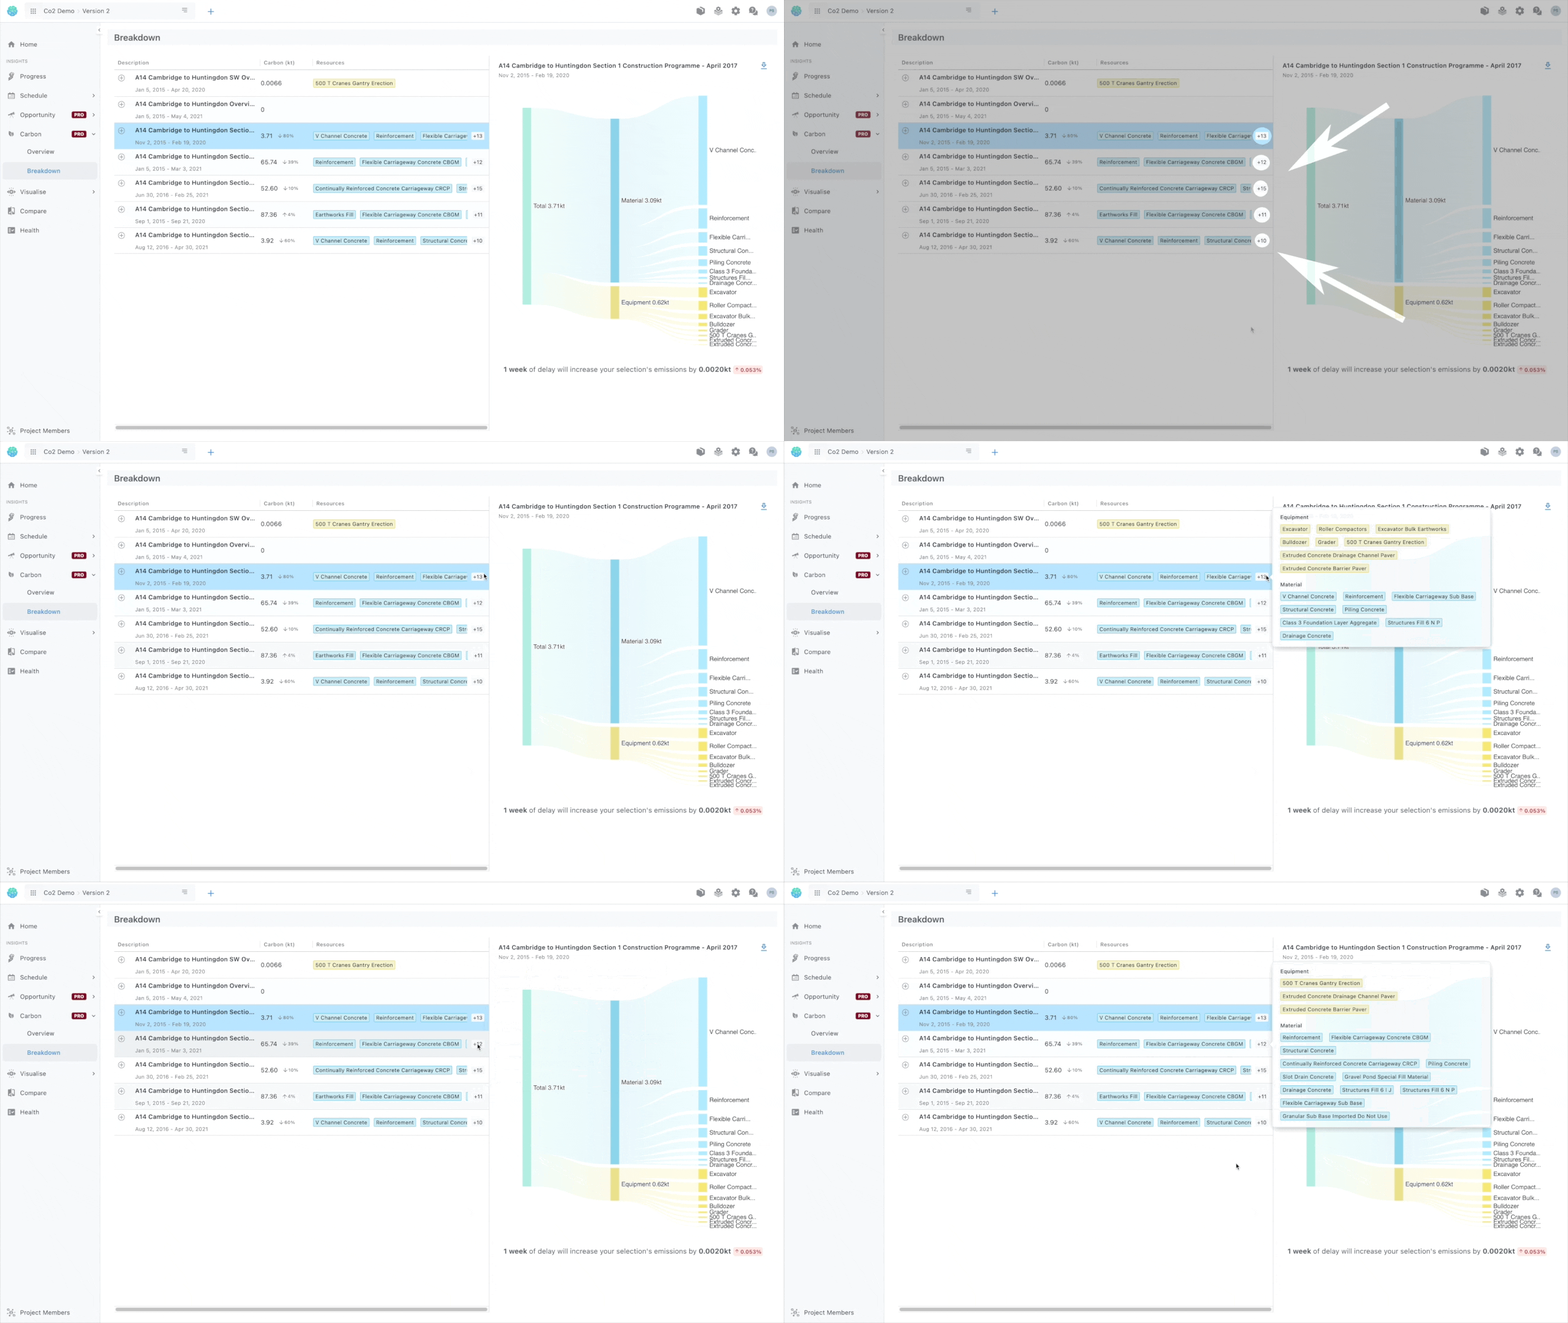
At a glance: Hovering on the ‘+13’ symbol at the end of each row, at the beak-down screen, will result in a popup containing all the resources of that activity or WBS, without having to click on that and inspect the sankey graph
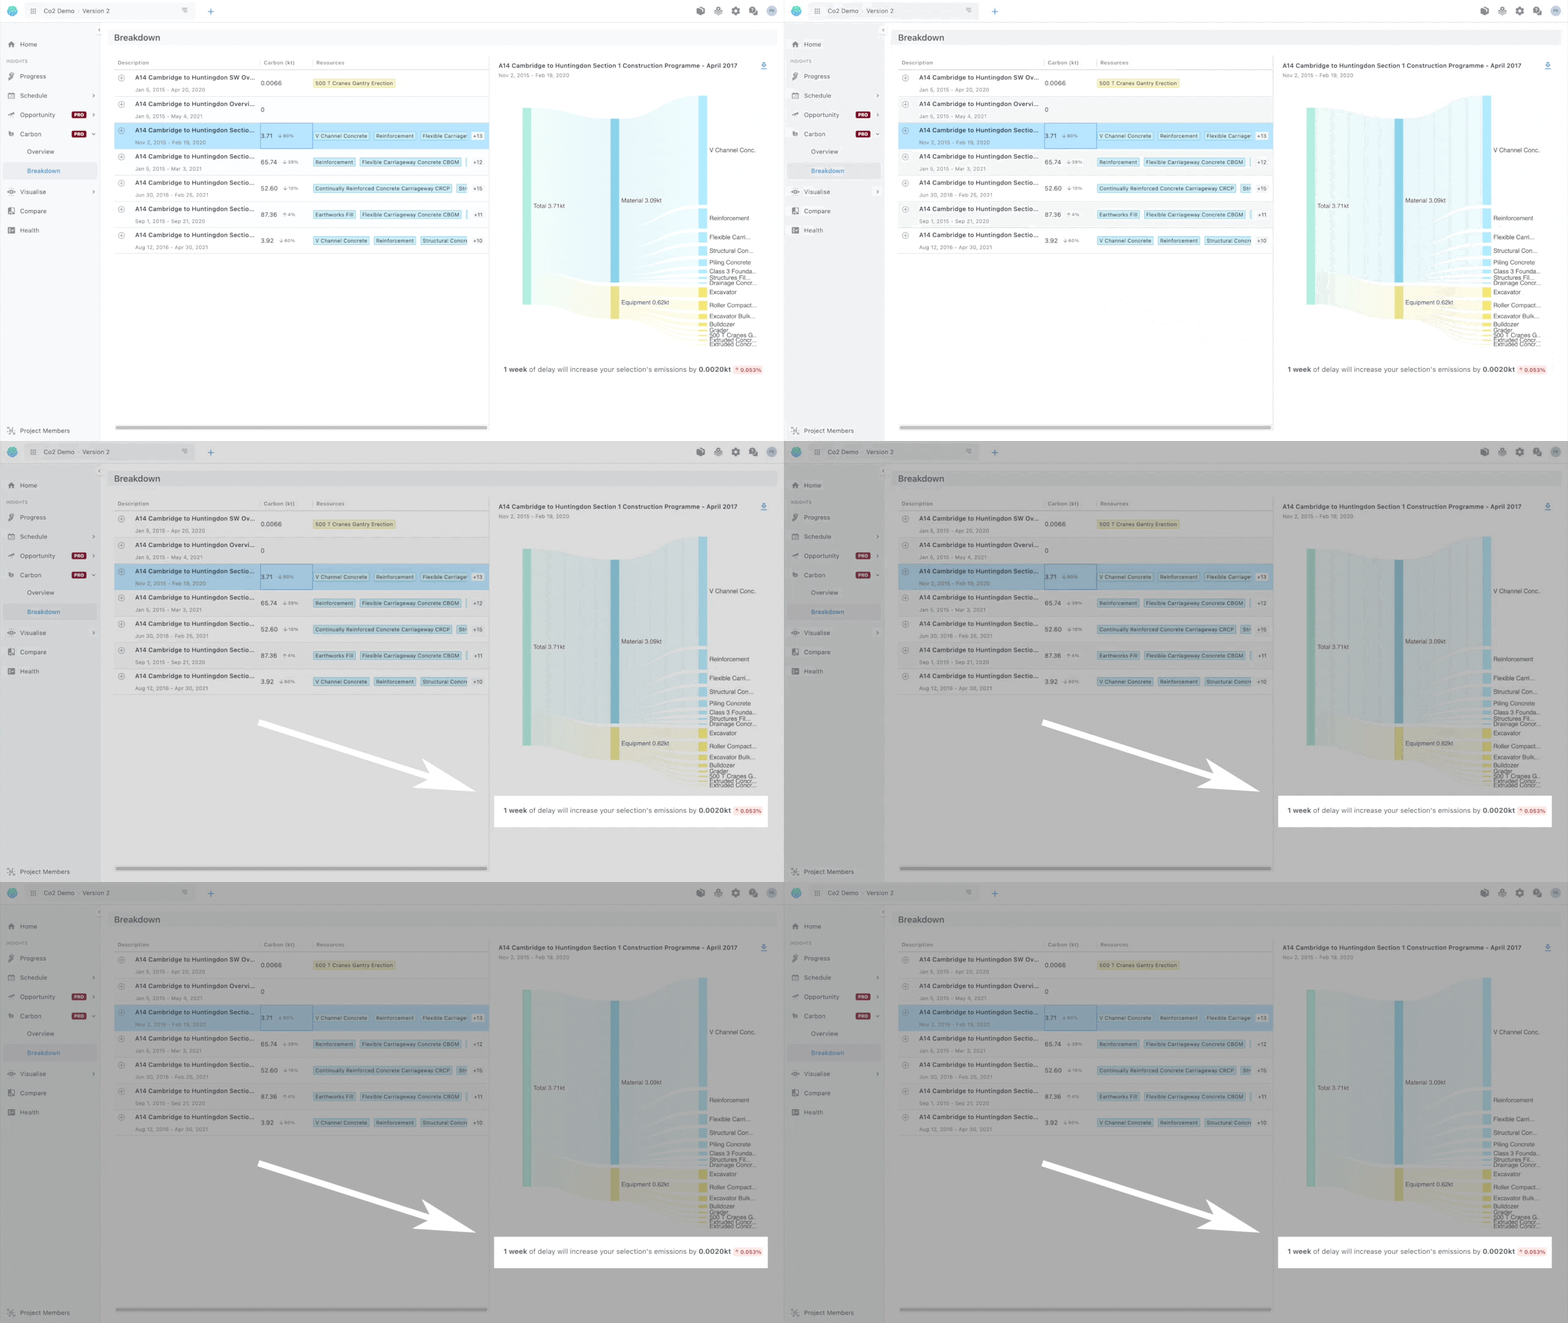
Understand the impact delays will have on your project, carbon-wise.
For every selected activity on the breakdown page you can see how 1 week of delay will affect it’s co2 footprint
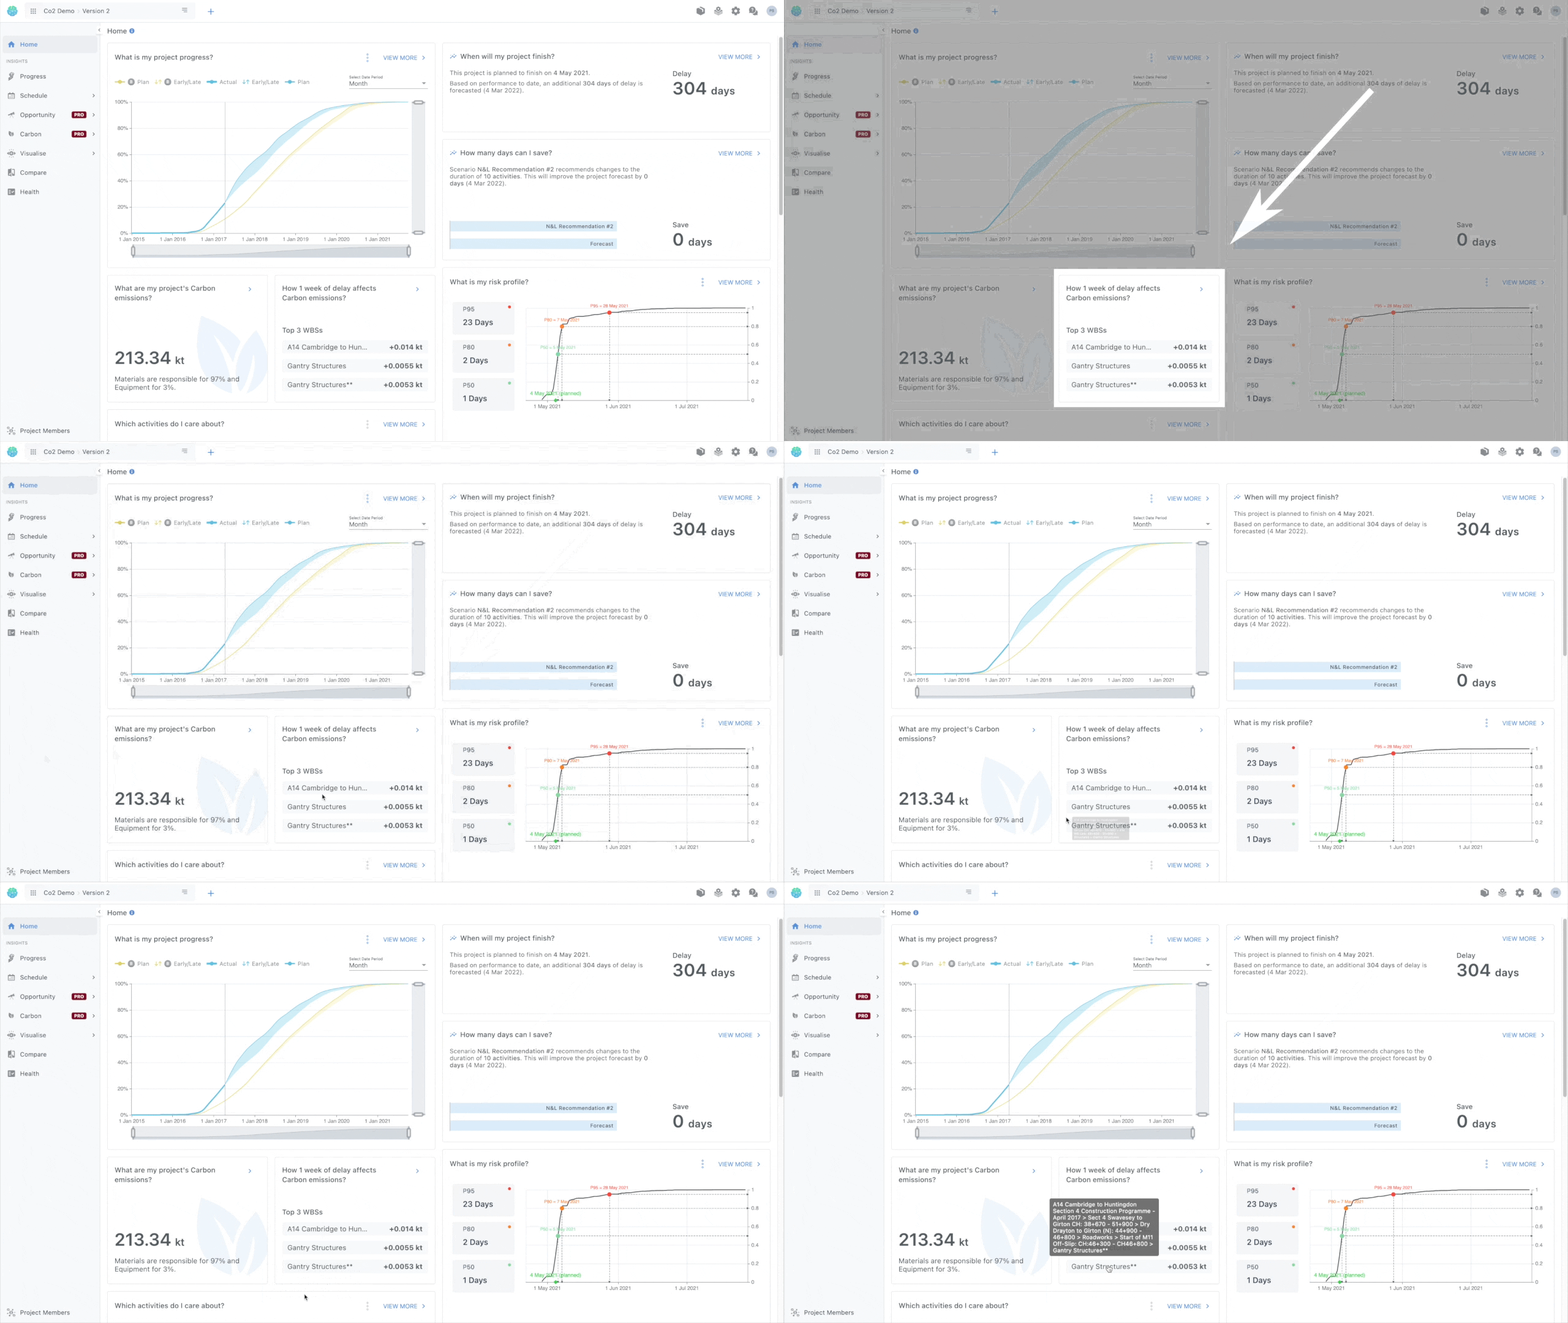
At a glance: If you are in a hurry , you can only take a quick look at the home screen where you will find how 1 week of delay will alter your carbon impact on your 3 worst WBSs environmentally
How does our NLP work?
We use a wide range of material and equipment but we can provide you a simplified list of resources that will help you streamline your work - if you just use this small list of resources, this will help you get super accurate values without having to play with more elaborate resource types.
What is the distinction between Materials and Equipment?
From a P6 point of view, nothing. You don’t have to do anything in P6 regarding that. We just use this distinction ourselves to make it easier to taxonomise resources.
Materials
| Resource Name | Default Units |
|---|---|
| Concrete | Cubic Meter |
| Reinforced concrete | Cubic Meter |
| Steel Reinforced Concrete | Cubic Meter |
| RCC | Cubic Meter |
| Asphalt | Tonne |
| Binder | Tonne |
| Base | Tonne |
| Surface Course | Tonne |
| SC | Tonne |
| Steel | Tonne |
| Reinforcement | Tonne |
| Steelwork | Tonne |
| Aluminium | Tonne |
| Timber | Cubic Meter |
| Formwork | Cubic Meter |
| Cement | Tonne |
| Aggregate | Tonne |
| Fill | Tonne |
| Sub base | Tonne |
| Lower Base | Tonne |
| Fencing | Meter |
| Timber Fencing | Meter |
| Fence | Meter |
Equipment
| Resource Name | Default Units | Primary Attribute |
|---|---|---|
| Excavator | Tonne | Mass |
| Digger | Tonne | Mass |
| Paver | Tonne | Mass |
| Loader | Tonne | Mass |
| Compactor | Tonne | Mass |
| Roller | Tonne | Mass |
| Grader | Tonne | Mass |
| Tractor | Tonne | Mass |
| Bulldozer | Tonne | Mass |
| Dozer | Tonne | Mass |
| Generator | KilloWat | Power |
| Compressor | Cubic Feet Per Minute | Volumetric Flow |
| Crane | Tonne | Mass |
| Dumper | Tonne | Mass |
The primary attribute is a distinct property of an equipment type, for example for excavators we distinguish them by their mass. This helps us understand what is the exact equipment given the equipment type. e.g., 10 tonne excavator should have a different CO2 rate compare to a 20 tonne excavator.
Am I supposed to do something with the Primary Attribute?
No this is just us being transparent about how we work. Units for equipment’s attributes cannot be inserted in P6 anyway We recognise them in the name of the equipment.
