🏝 Visualise (Connections)
This screen allows you to:
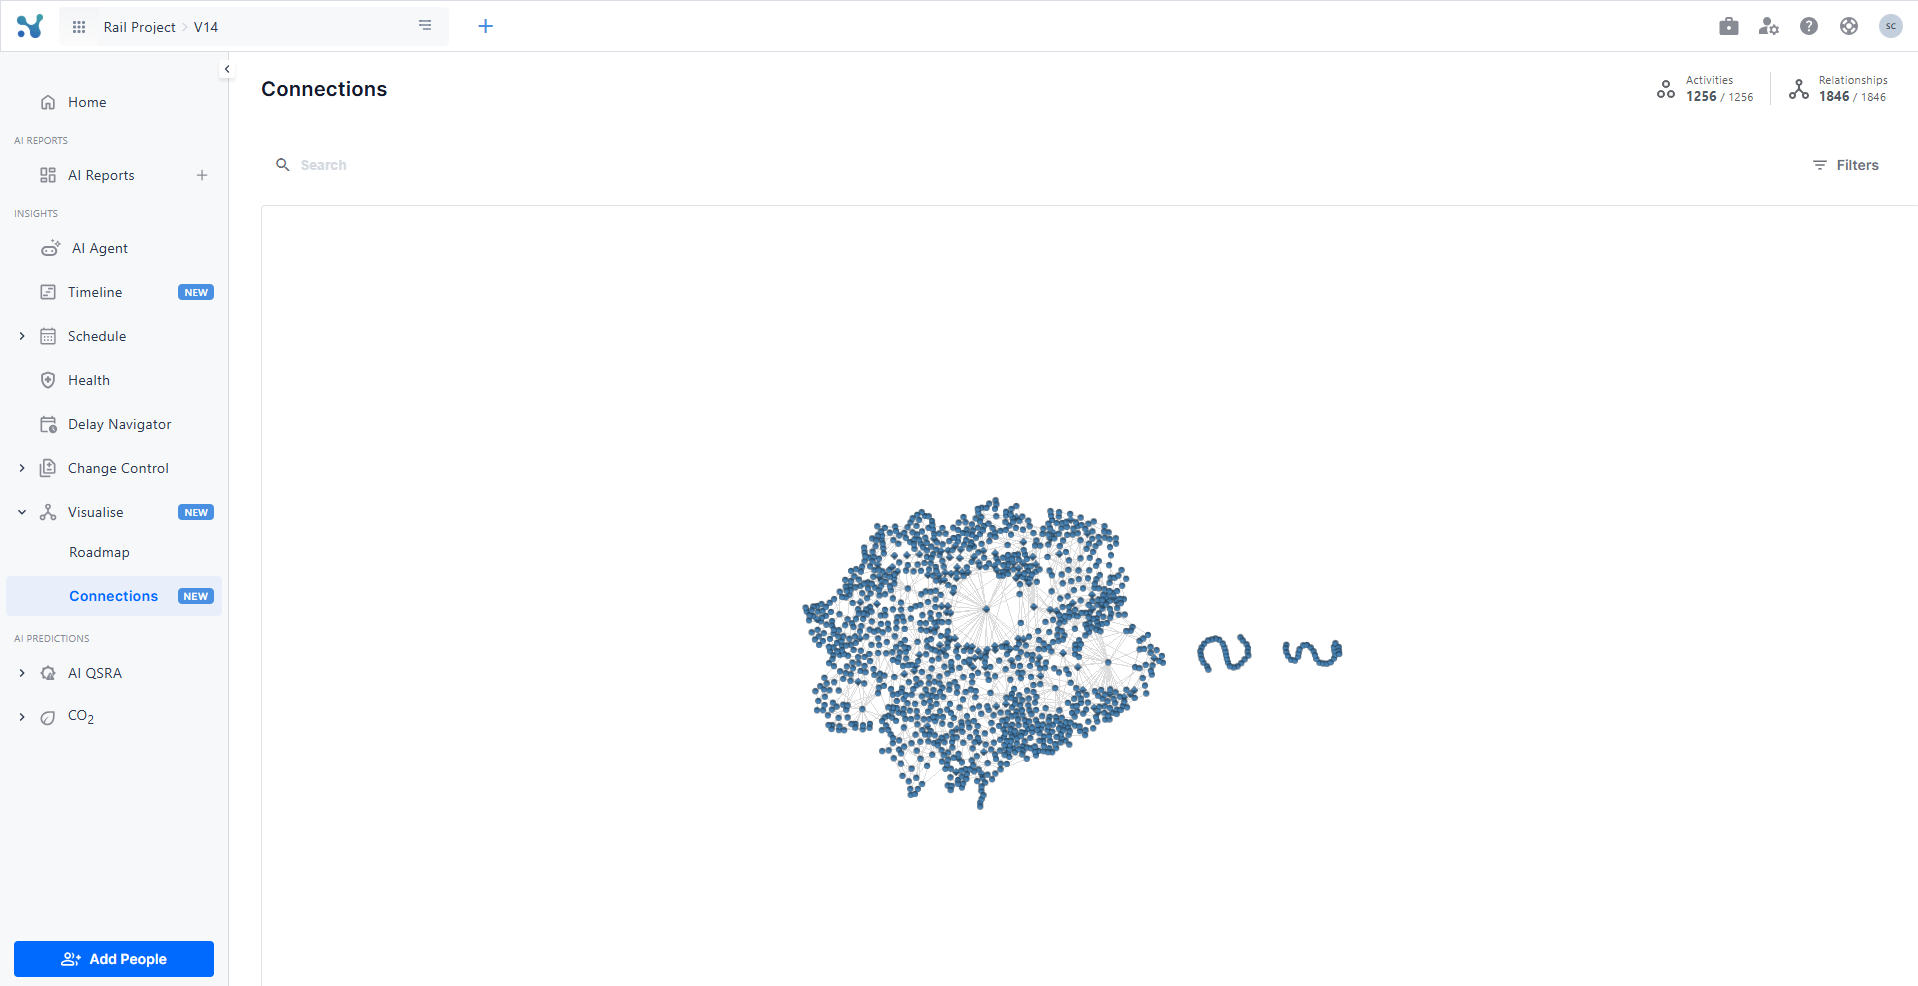
- Explore project activities and milestones in a dynamic force layout
- Find the linchpins of your project
- View activity details
- Filter activities
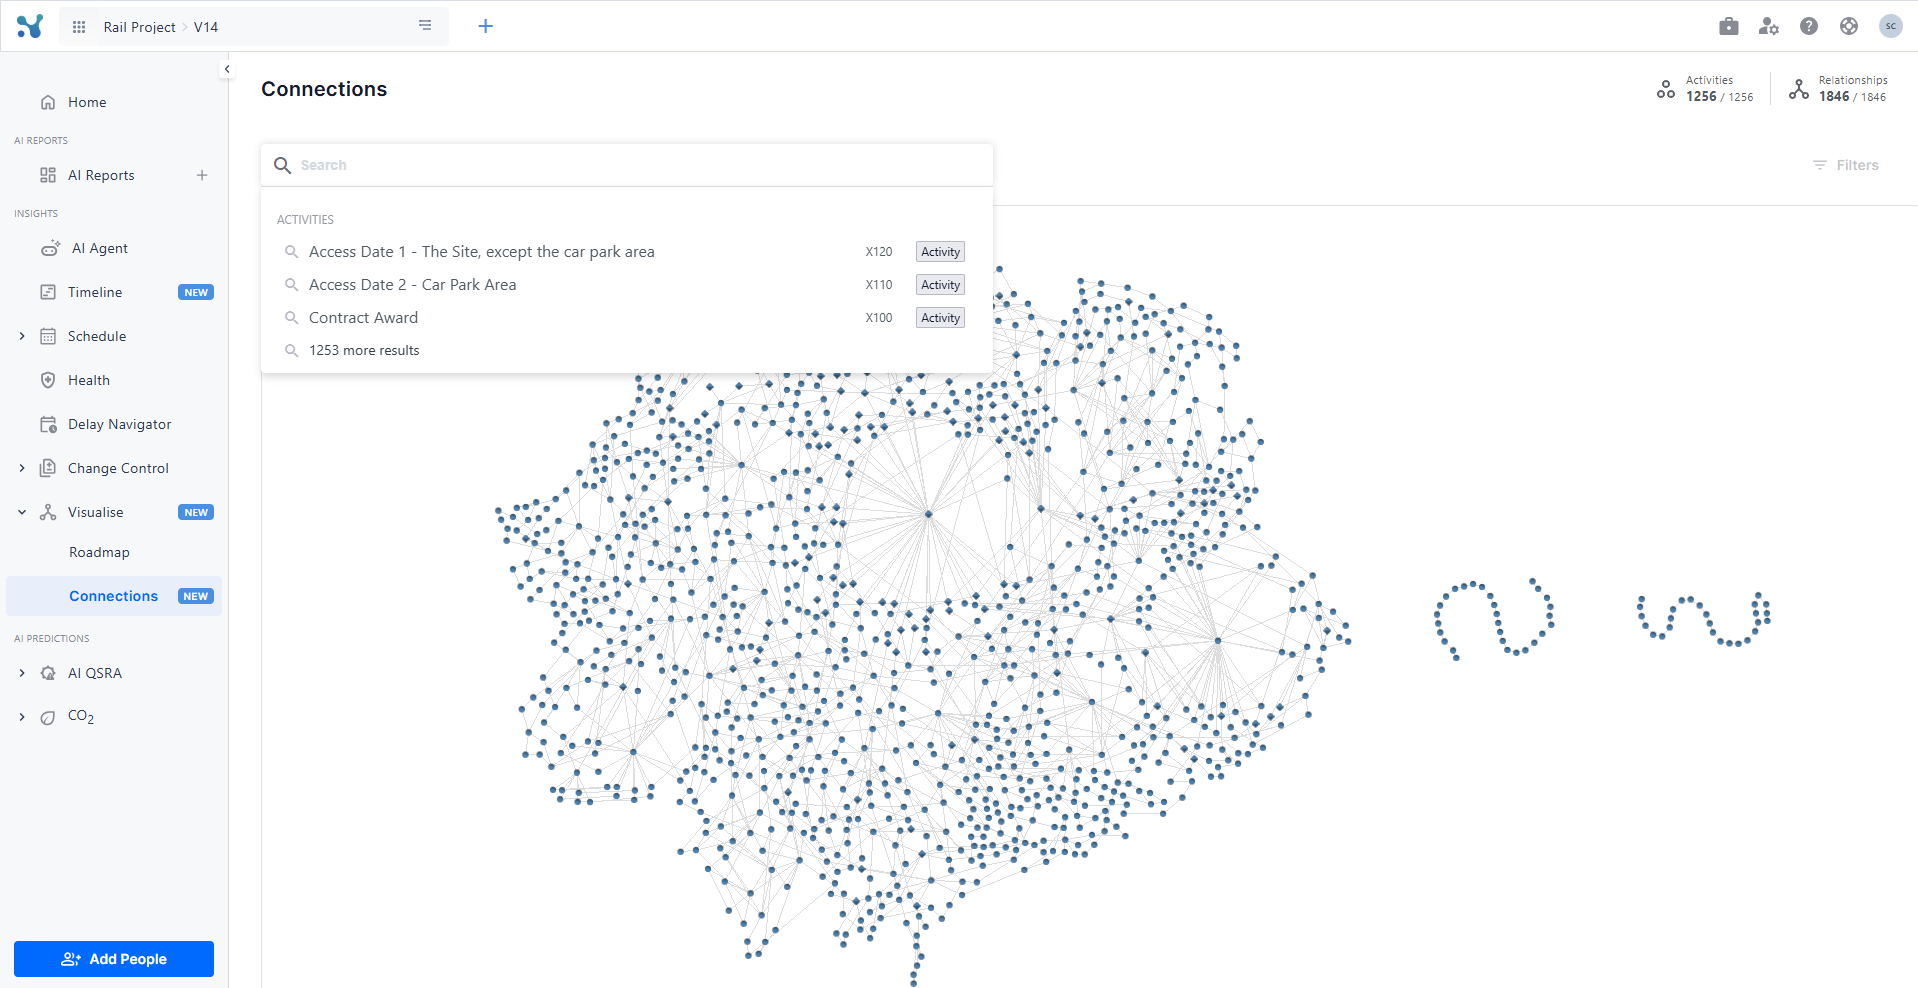
- Search for specific activities and focus on them
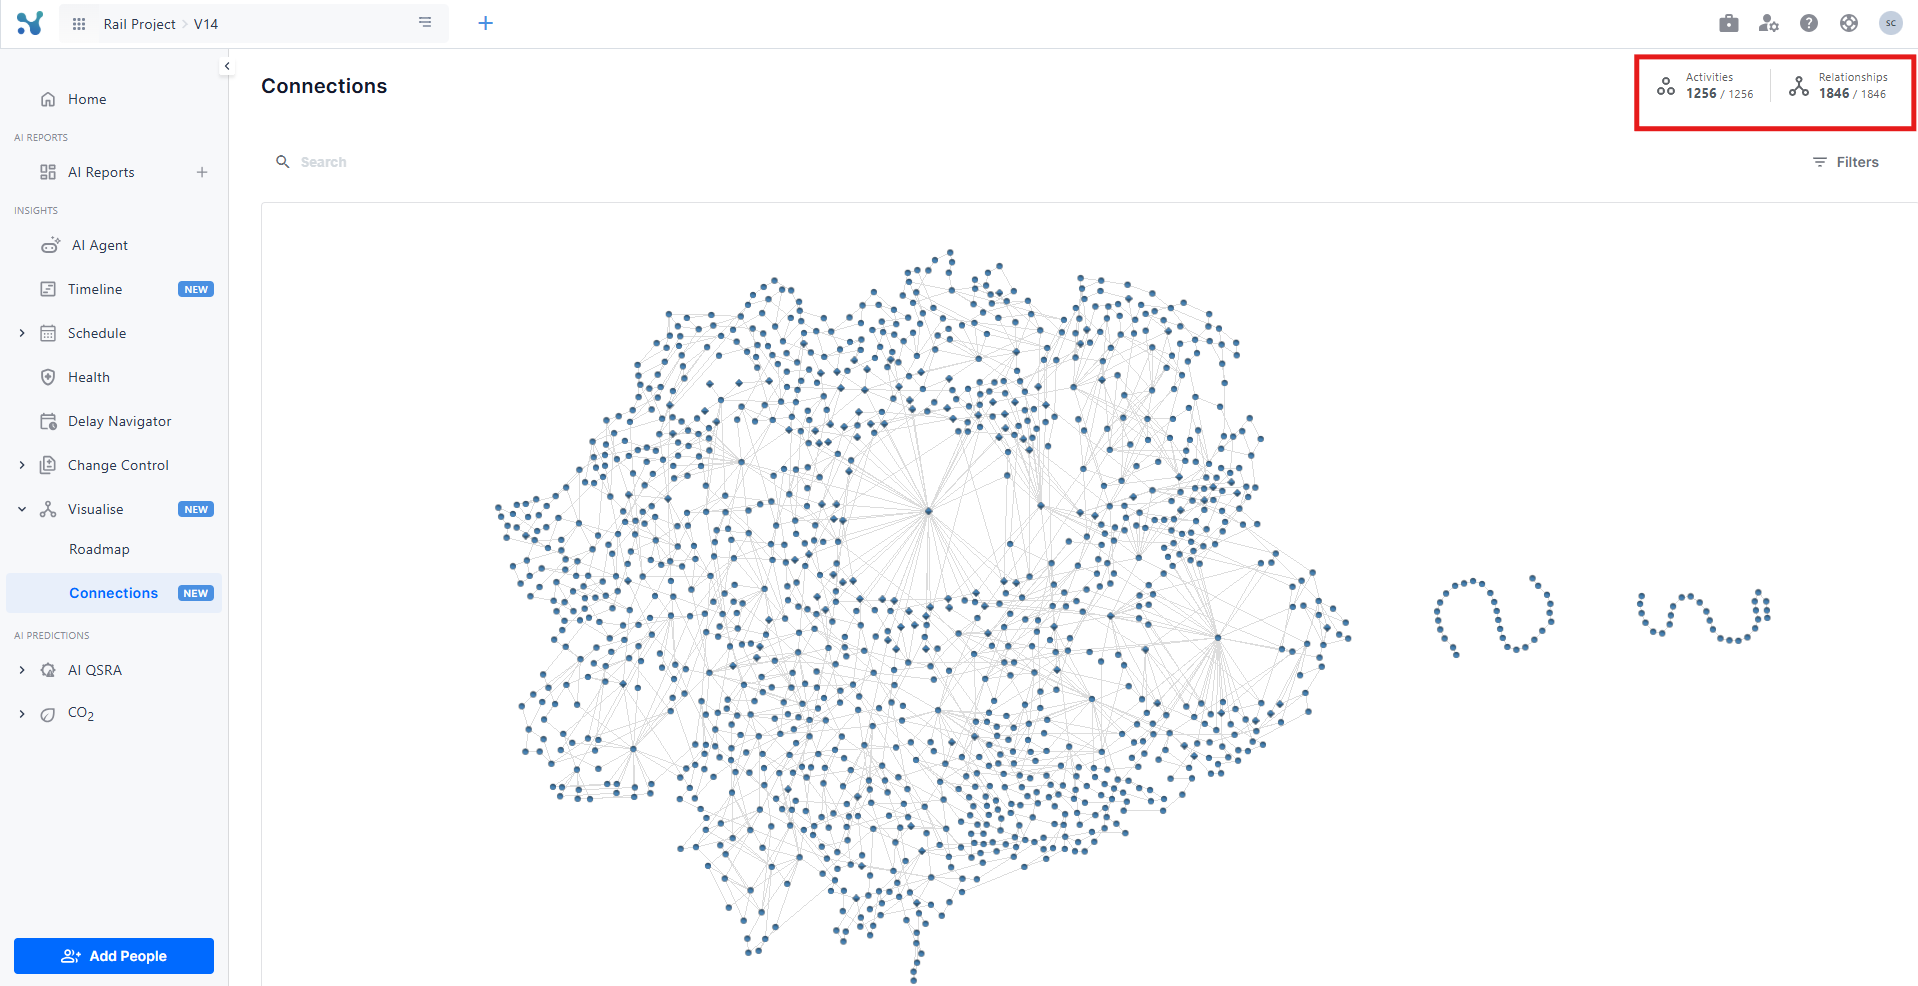
- View the number of activities and relationships
Explore project activities and milestones in a dynamic force layout
A force layout is a chart where activities “force” everything else away from them. The screen presents your project schedule as an interactive force layout chart. Activities are represented by circles, while milestones are depicted as diamonds. Arrows between nodes represent relationships, providing a clear visual representation of project flow and dependencies.
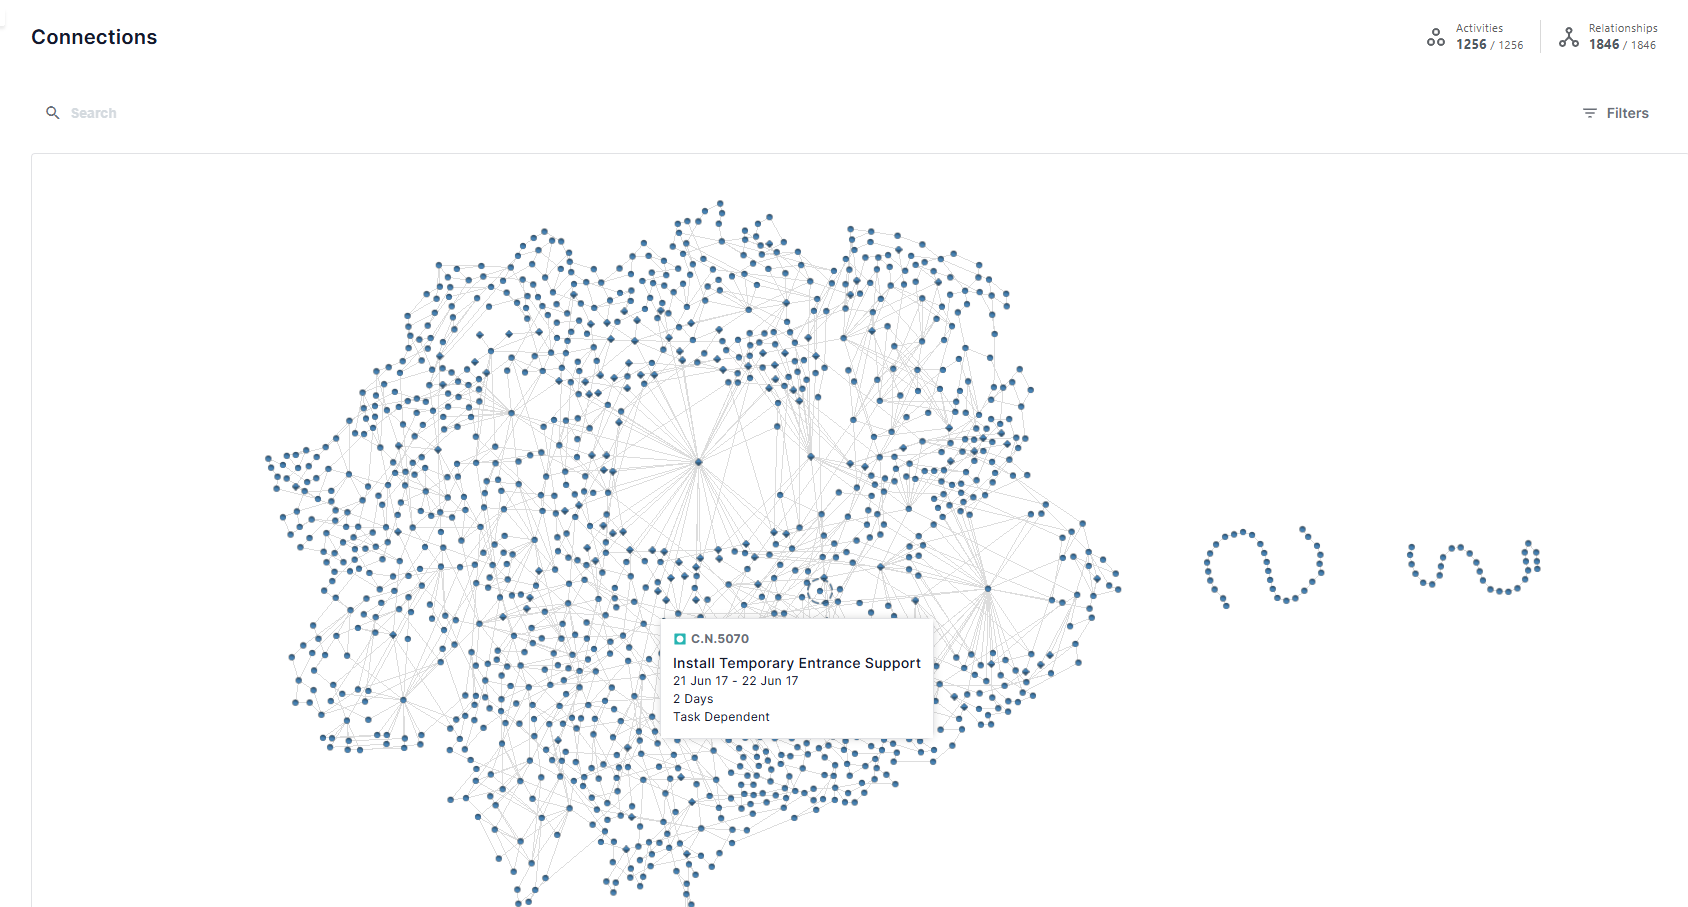
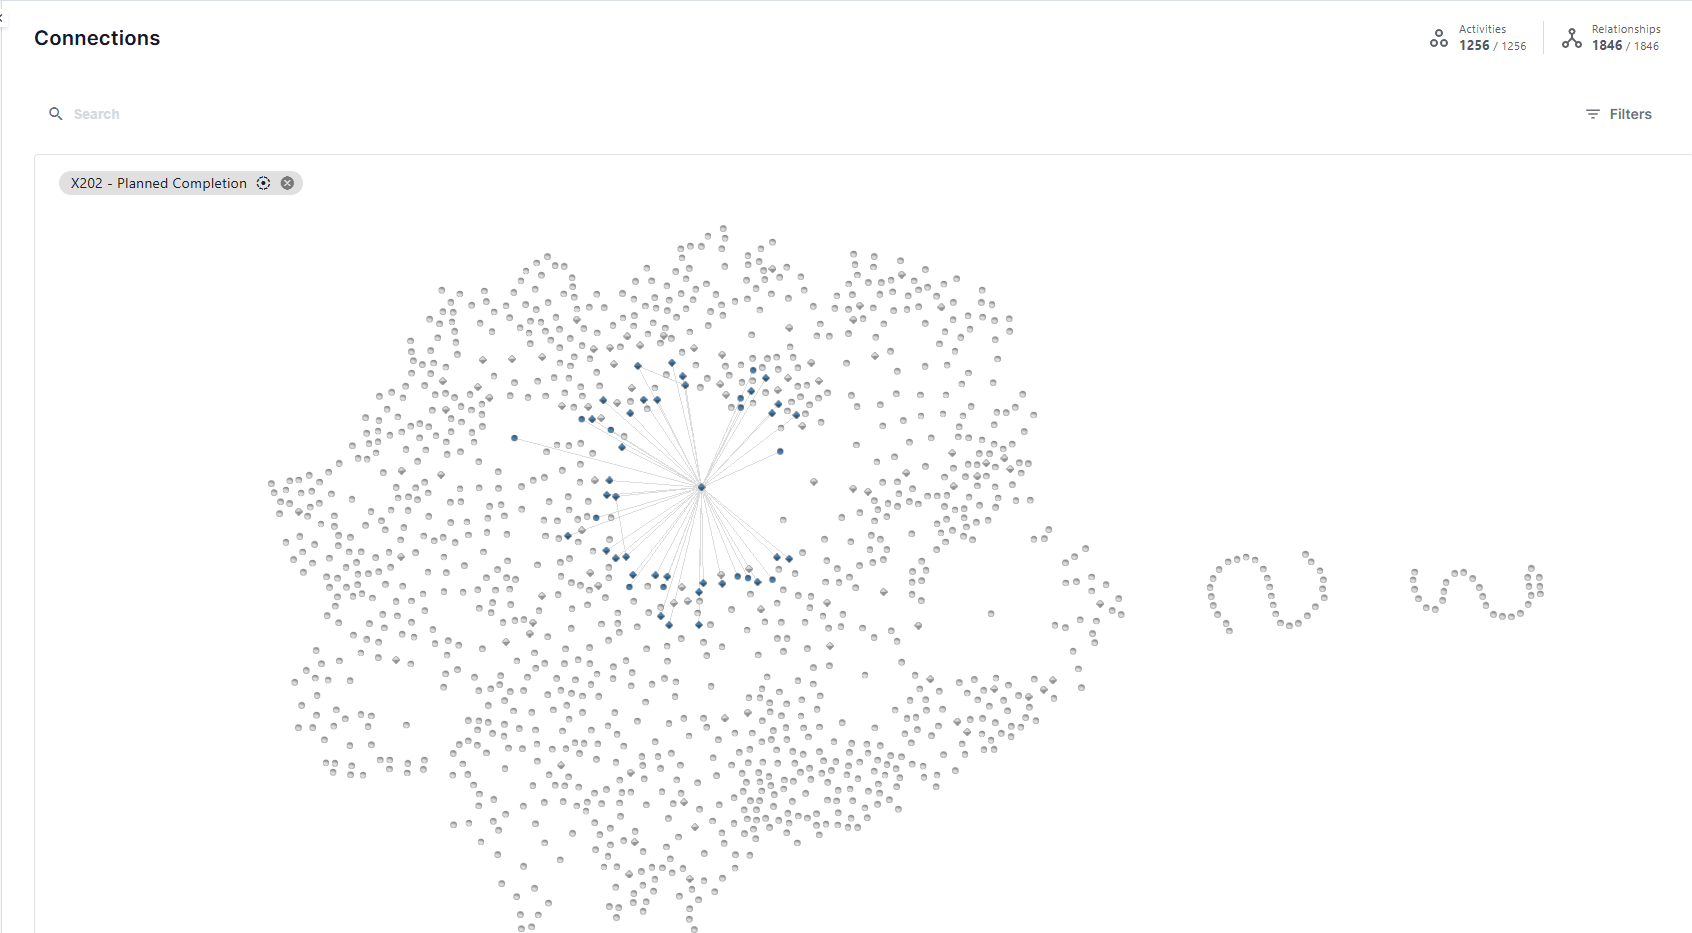
View activity details by hovering and focus on connections by clicking
Hover over any activity to see key information about it.
Clicking on an activity will highlight its incoming and outgoing connections, helping you understand how it's linked to the rest of the schedule.
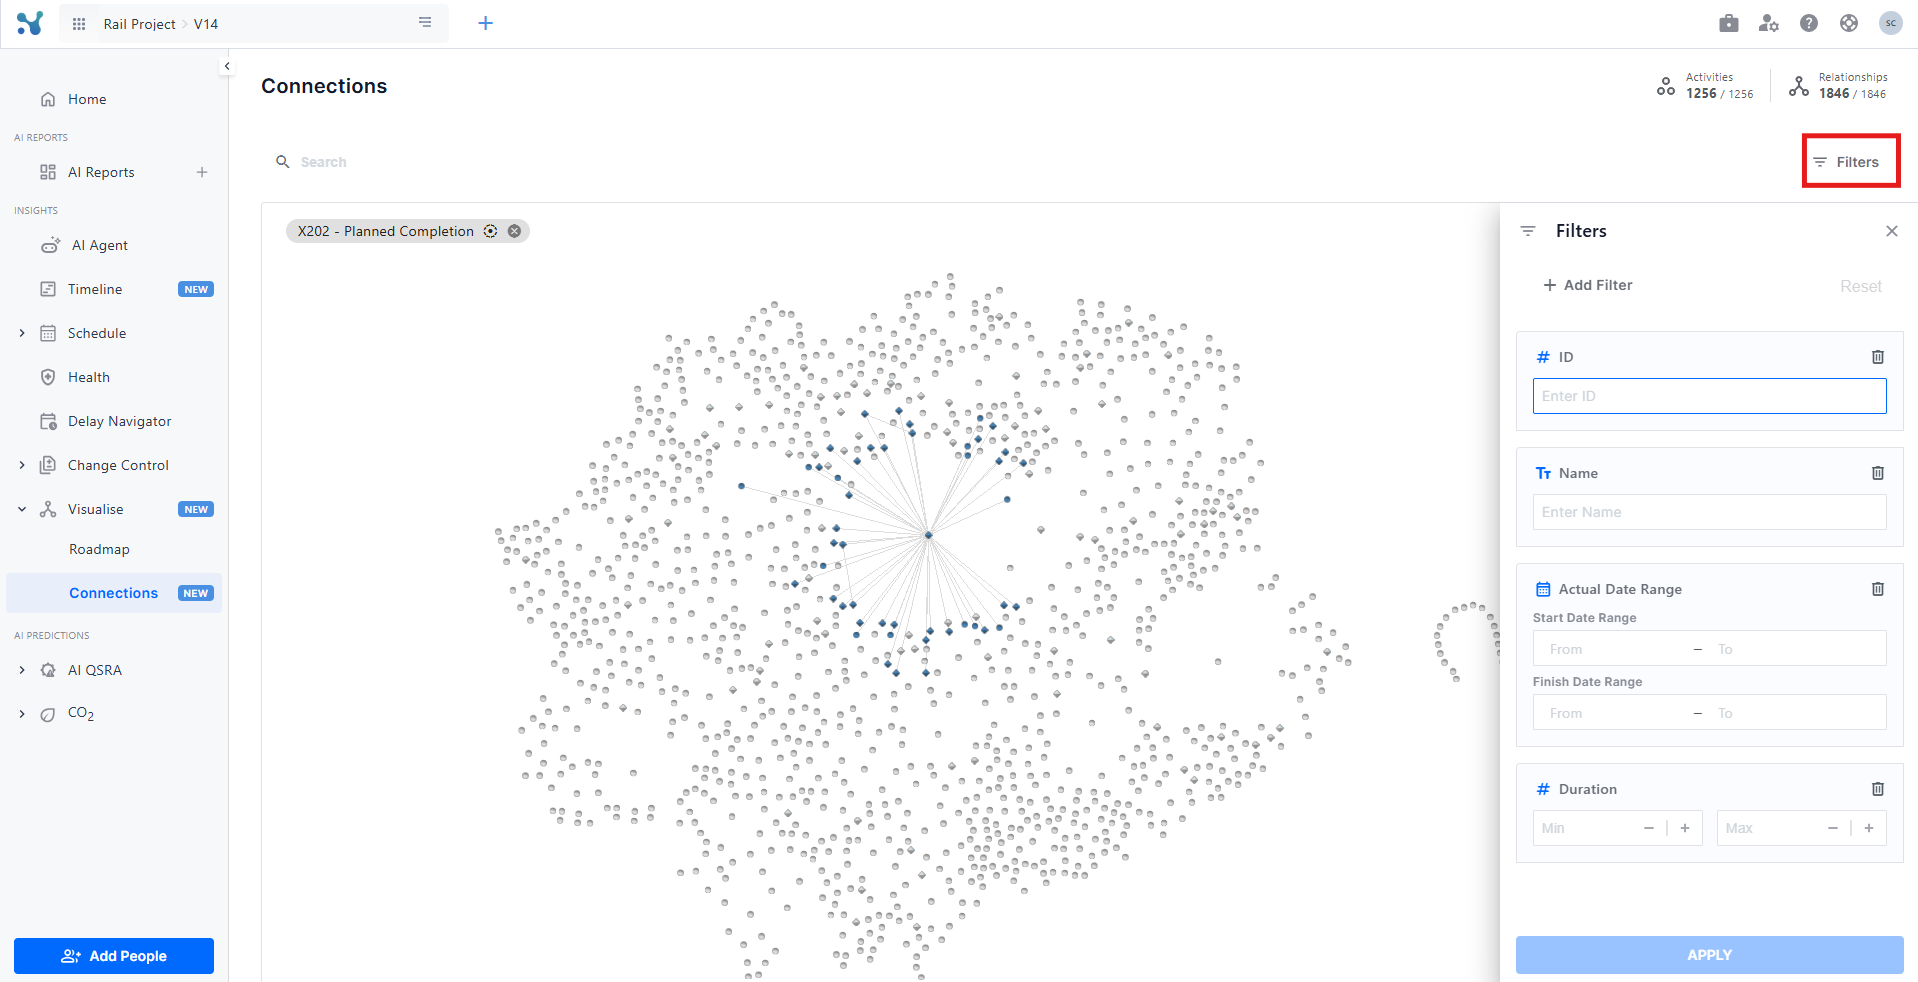
Filter activities using predefined filters
Click the Filter button located at the top right of the screen. A drawer will appear, allowing you to apply various filters to narrow down the view to the most relevant activities.
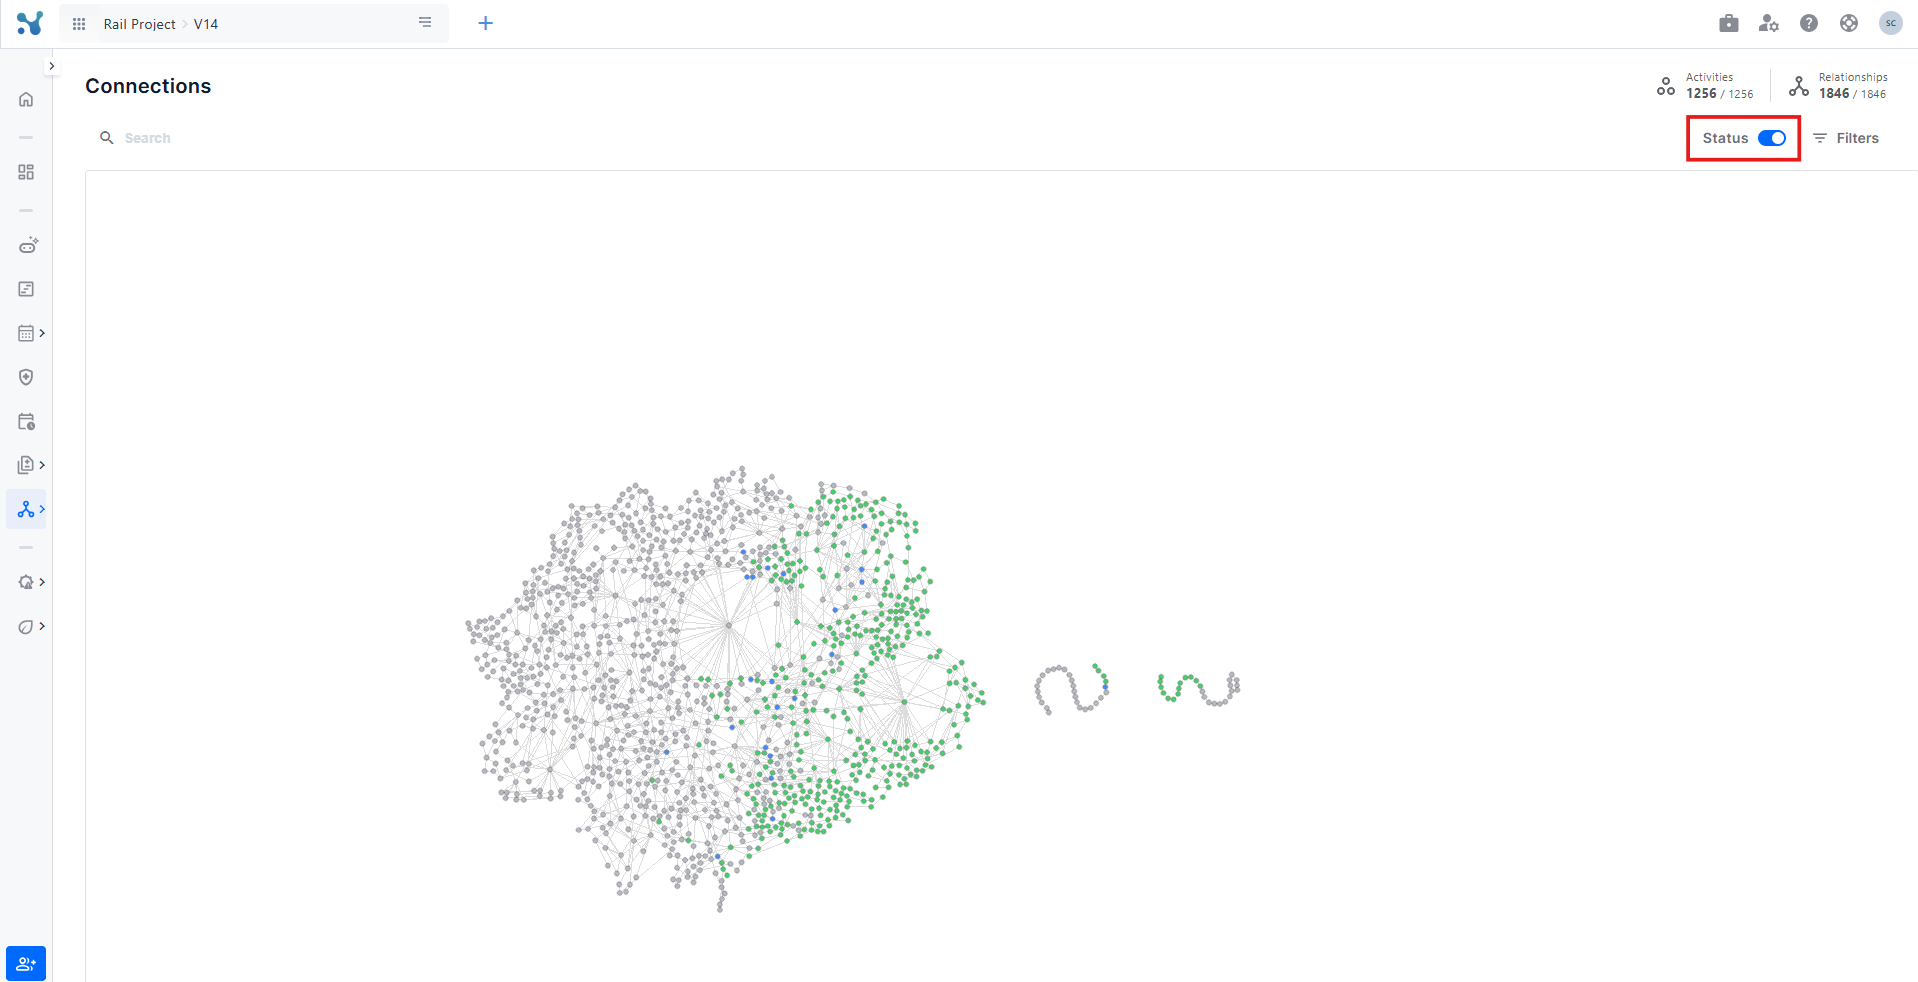
Color activities by status
You can use the Status toggle at the top right of the screen to quickly visualize progress. When enabled, activity nodes are color-coded by their status: green for completed, blue for in progress, and grey for not started. This helps you assess the overall state of the schedule at a glance.
Search for specific activities and focus on them
Use the Search bar at the top of the screen to locate a specific activity by name. Once selected, the chart will automatically focus on that activity and highlight it for easier navigation.
Number of activities and relationships
At the very top of the screen, you’ll see a quick overview displaying the total number of activities and the number of relationships in the schedule. This gives you immediate insight into the scope and complexity of your project.
