Portfolio Timeline
Introduction
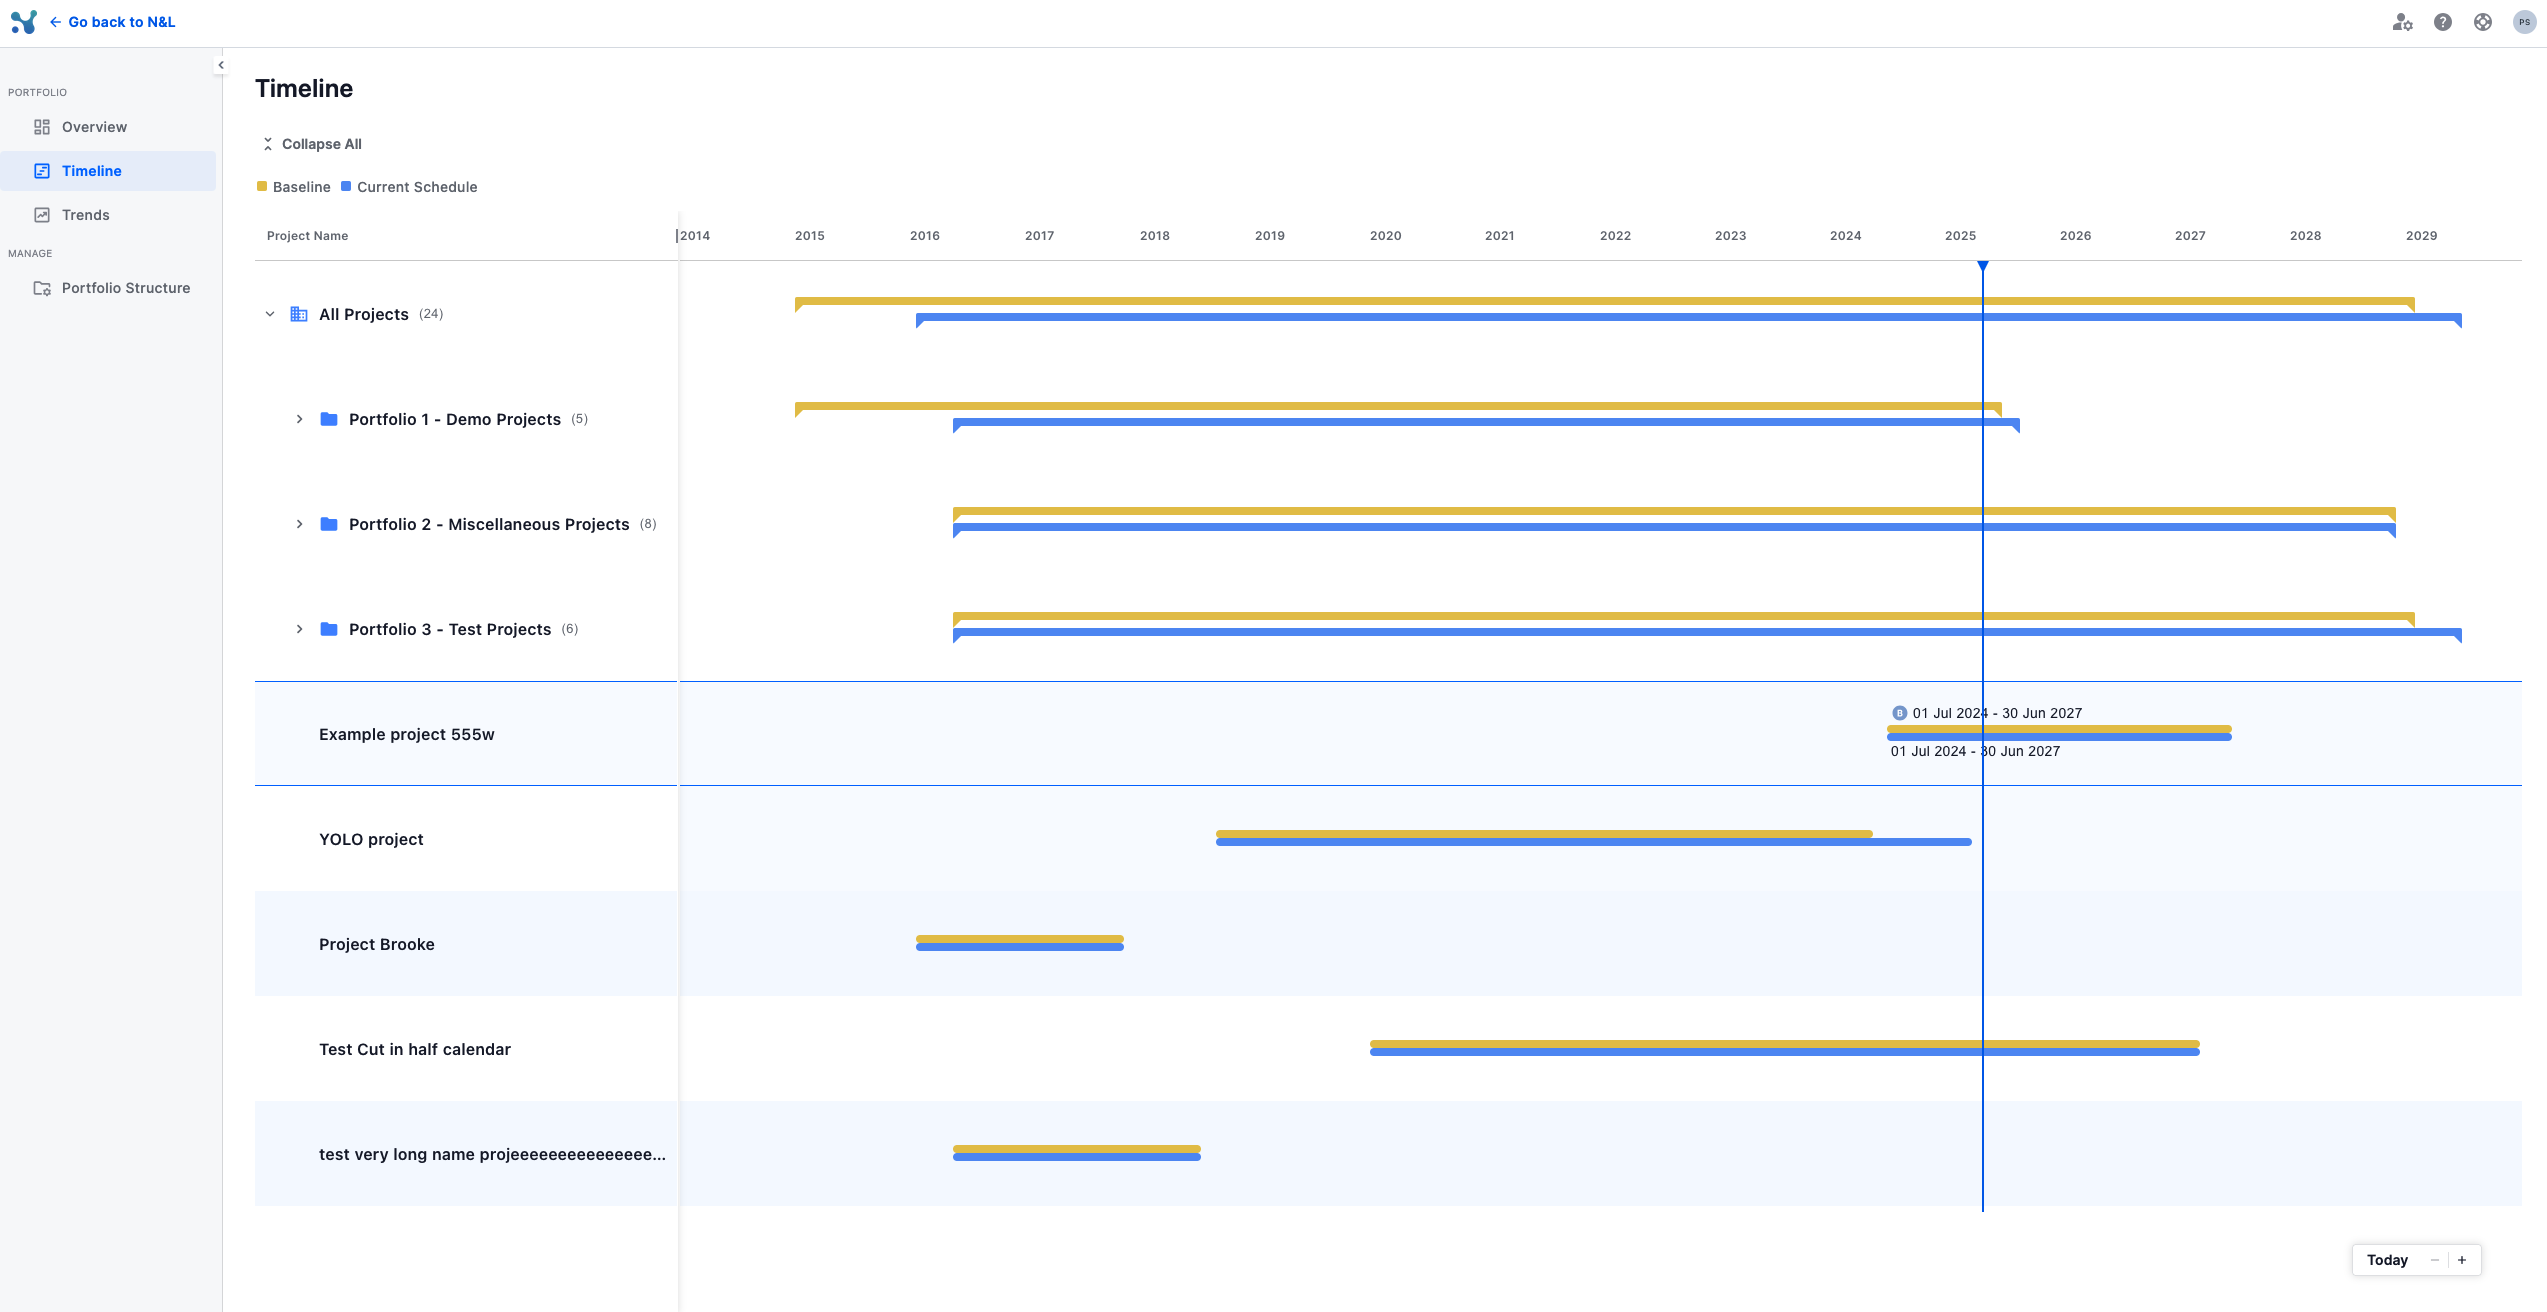
The Timeline page within the Portfolio feature provides a visual Gantt-style chart that displays how each Portfolio, Program, and Project spans across time.
It enables users to quickly assess project timelines, spot scheduling patterns, and identify alignment or deviations across their portfolio.
This article will guide you through:
- Understanding the Timeline visualization
- Using different timeline views
- Accessing detailed project dates
Timeline Overview
The Timeline shows two sets of bars for each row:
- Baseline Schedule (yellow line)
- Current Schedule (blue line)
This dual-bar setup allows users to easily compare how the original plan and the latest project updates align or diverge over time.
Each row represents a project, and projects are grouped under their respective portfolios or programs for easier navigation.

Navigating the Timeline
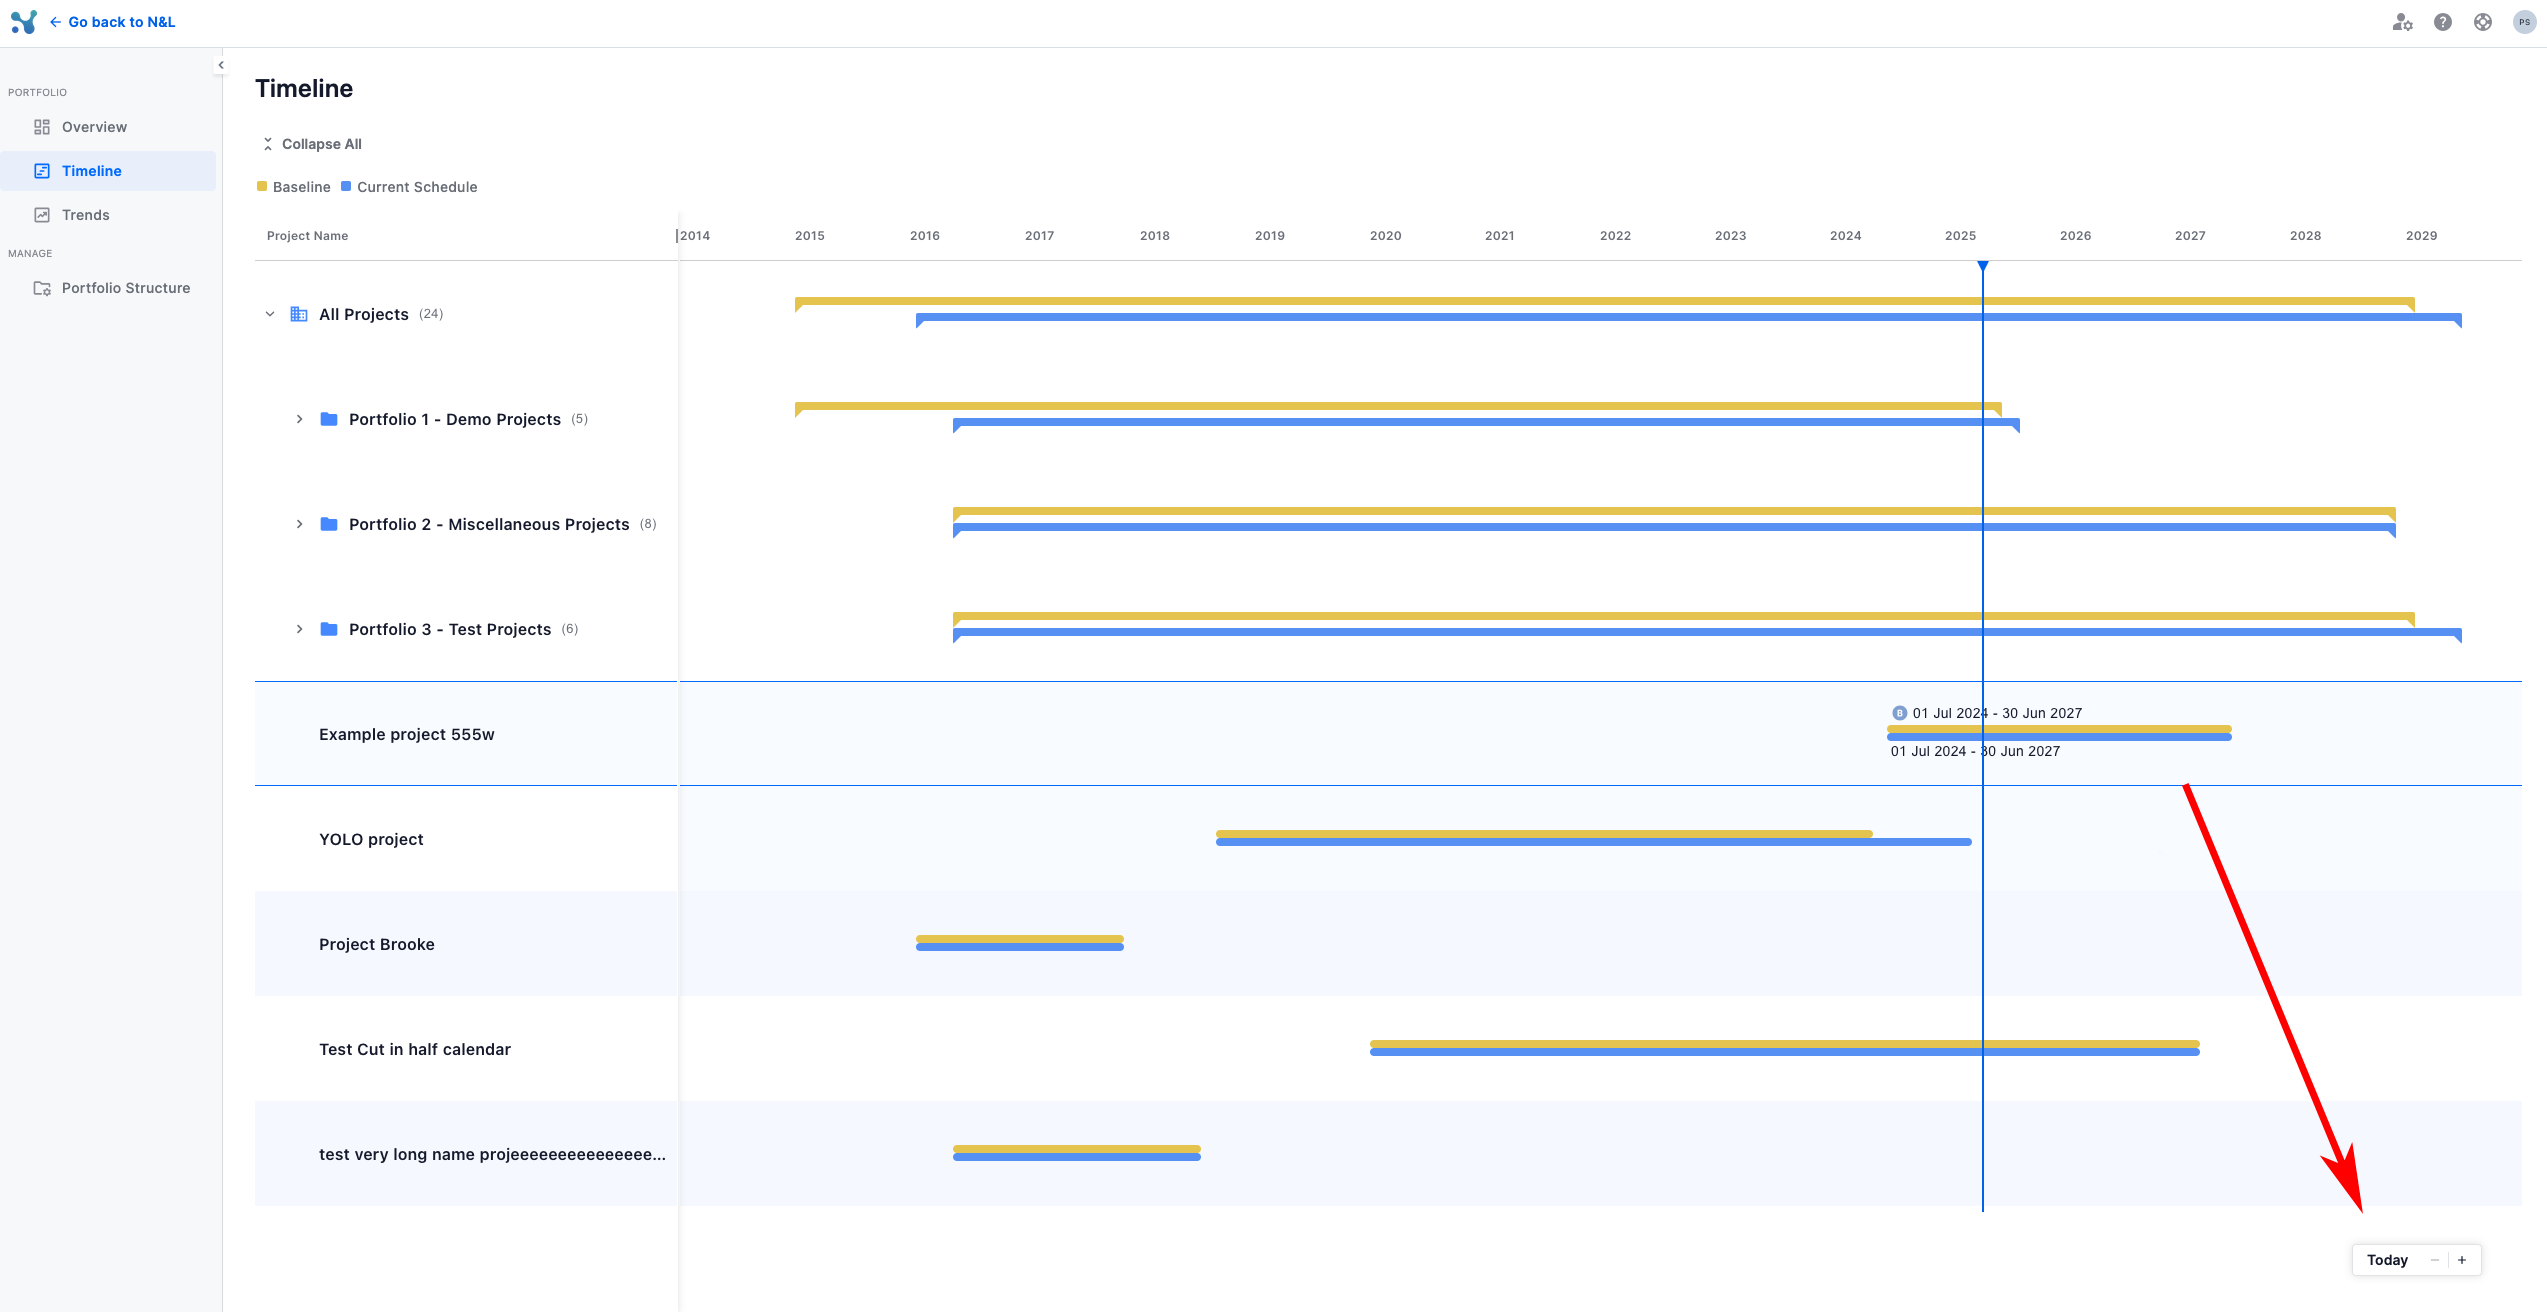
At the bottom right of the screen, you can adjust your view:
- Months View: Displays projects at a monthly level of detail.
- Quarters View: Displays projects grouped by quarters.
- Years View: Displays a more condensed view over multiple years.
- Fit to Screen: Automatically adjusts the zoom to fit all visible data.
If you are in a very detailed (granular) view — such as Months View — and wish to quickly reorient to the current date, click the Today button.

Viewing Detailed Dates
By clicking on any project row, you can quickly see:
- Baseline Start and End Dates
- Current Start and End Dates
This provides precise scheduling information without needing to dive into individual project reports.
