Delay Navigator
Delay navigator is a screen that helps you "navigate" the complicated web of your schedule dependencies and assists you in figuring out why something is late easily & hassle free.
- Select an activity
- The tool starts from the specified activity and goes backwards predecessor by predecessor.
- It compares your schedule with your baseline and based on the changes offers a recommendation of why something is late.
It looks at the following changes:
- Start Date
- End Date
- Duration
- Addition of new activities
- Constraint alterations
- Relationship alterations
- Calendar alterations
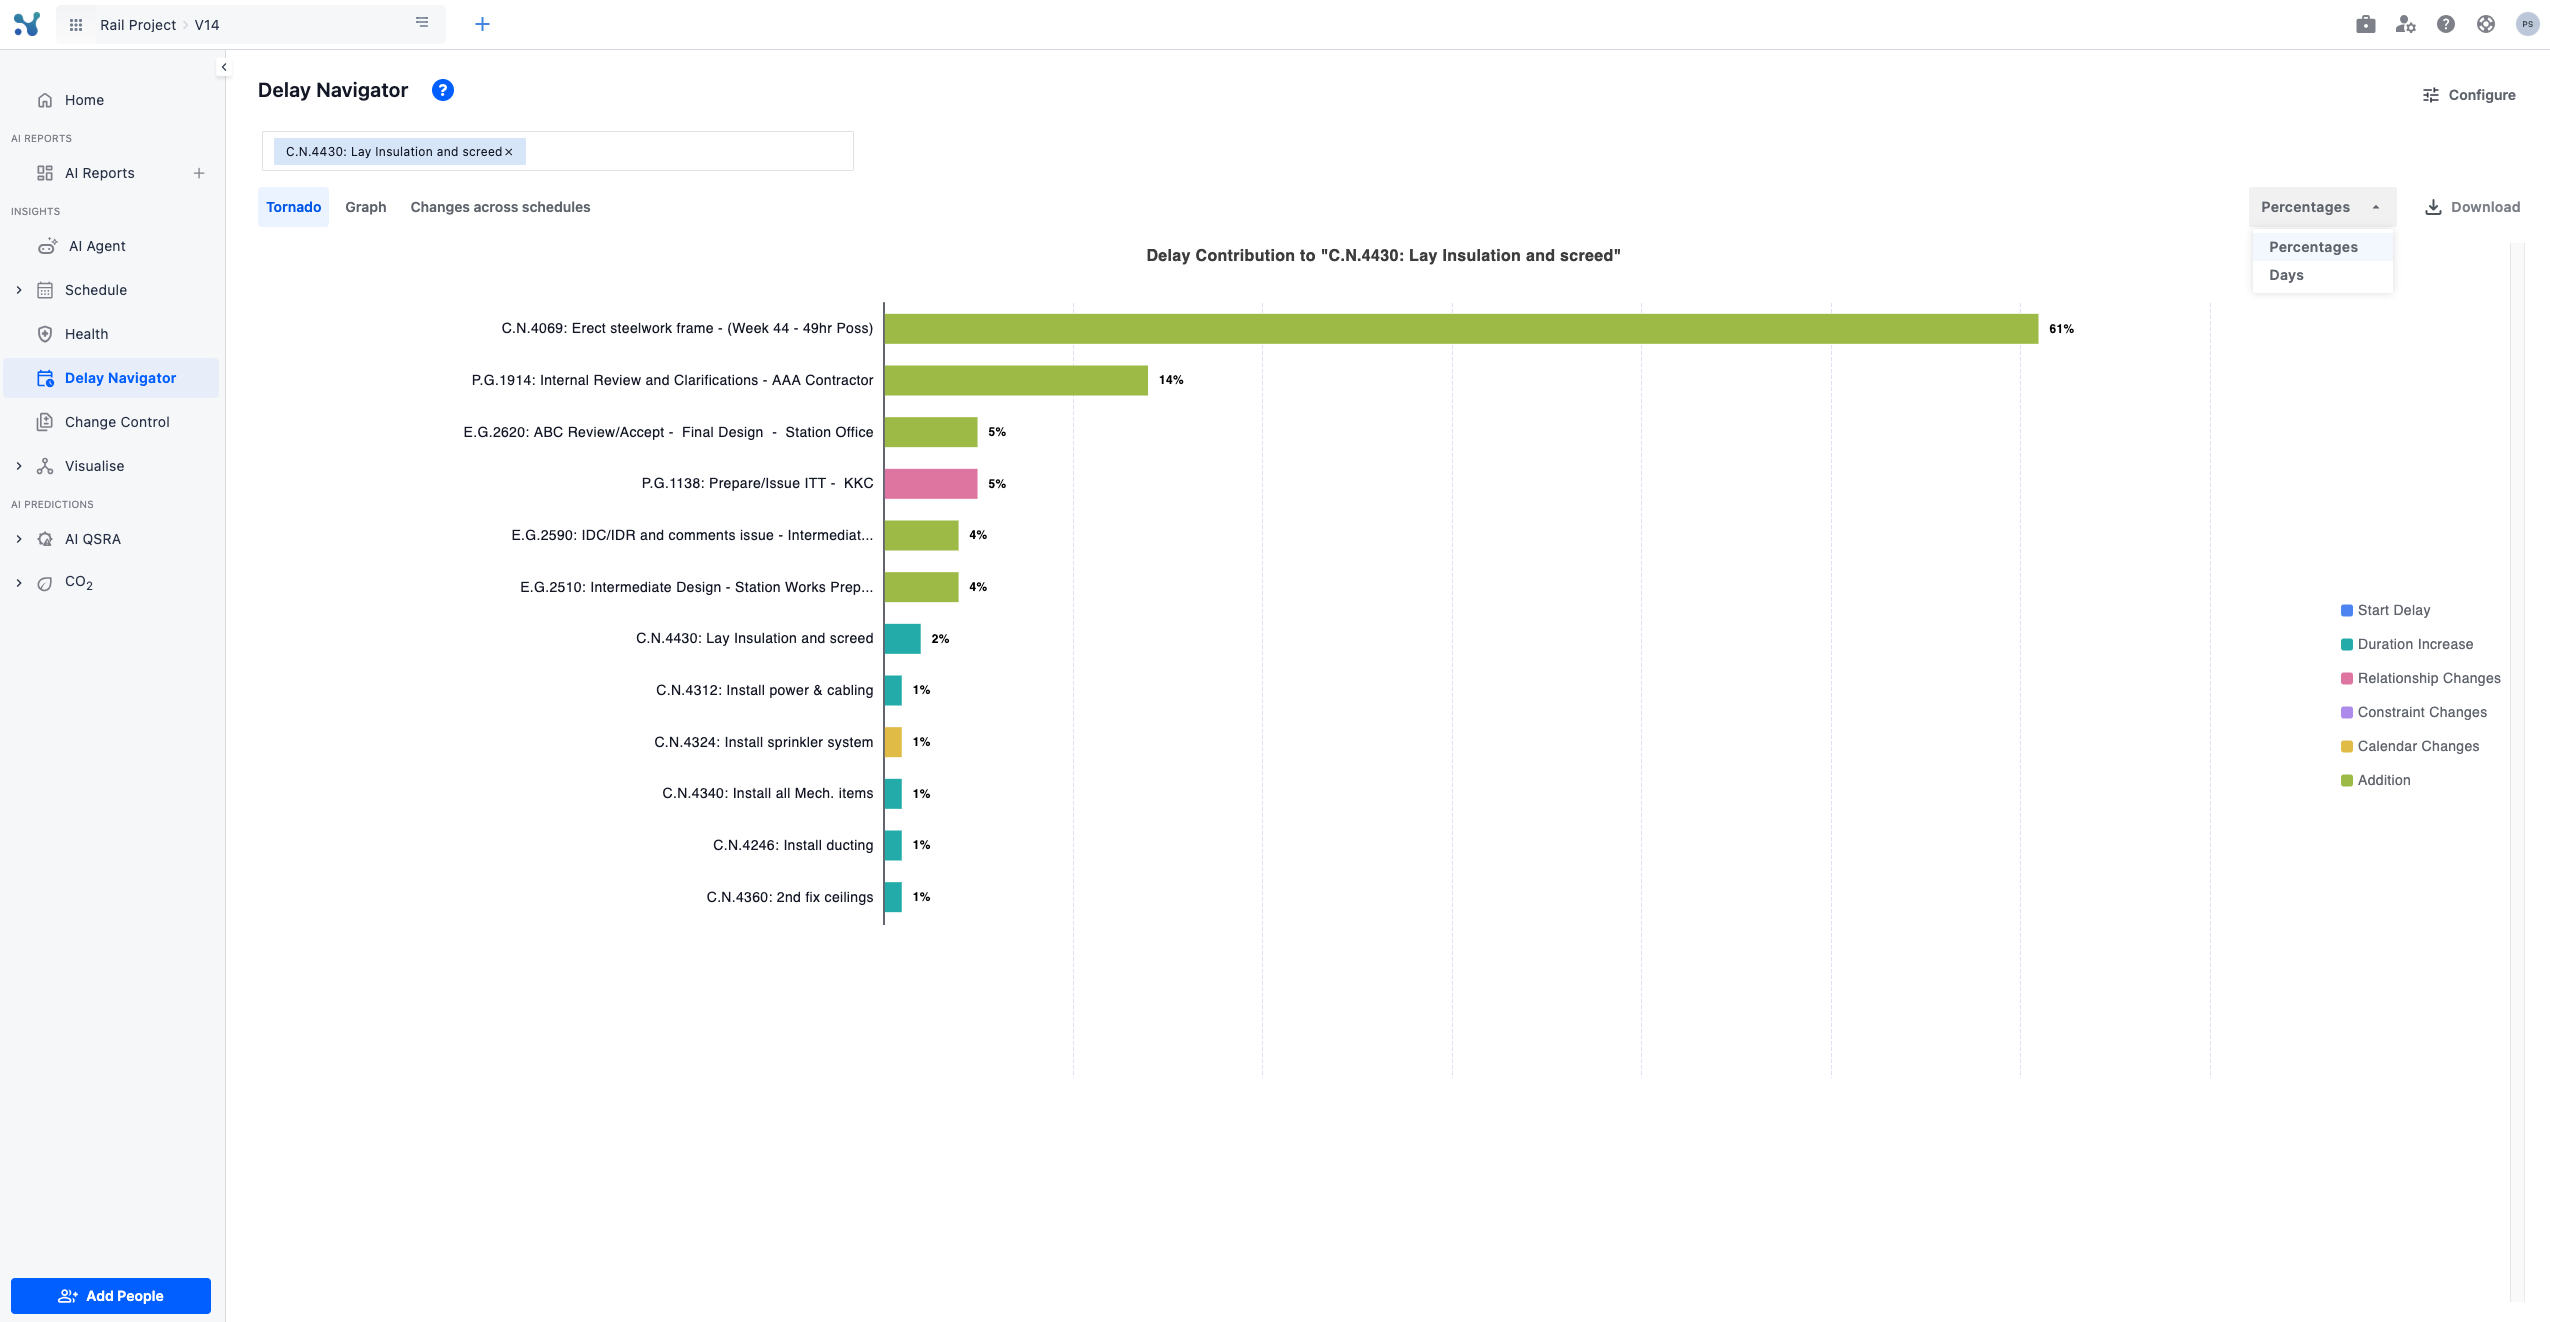
Three analysis modes
Immediately beneath the selector are three tabs—Tornado, Graph, and Changes across schedules—each offering a different lens on delay:
Tornado
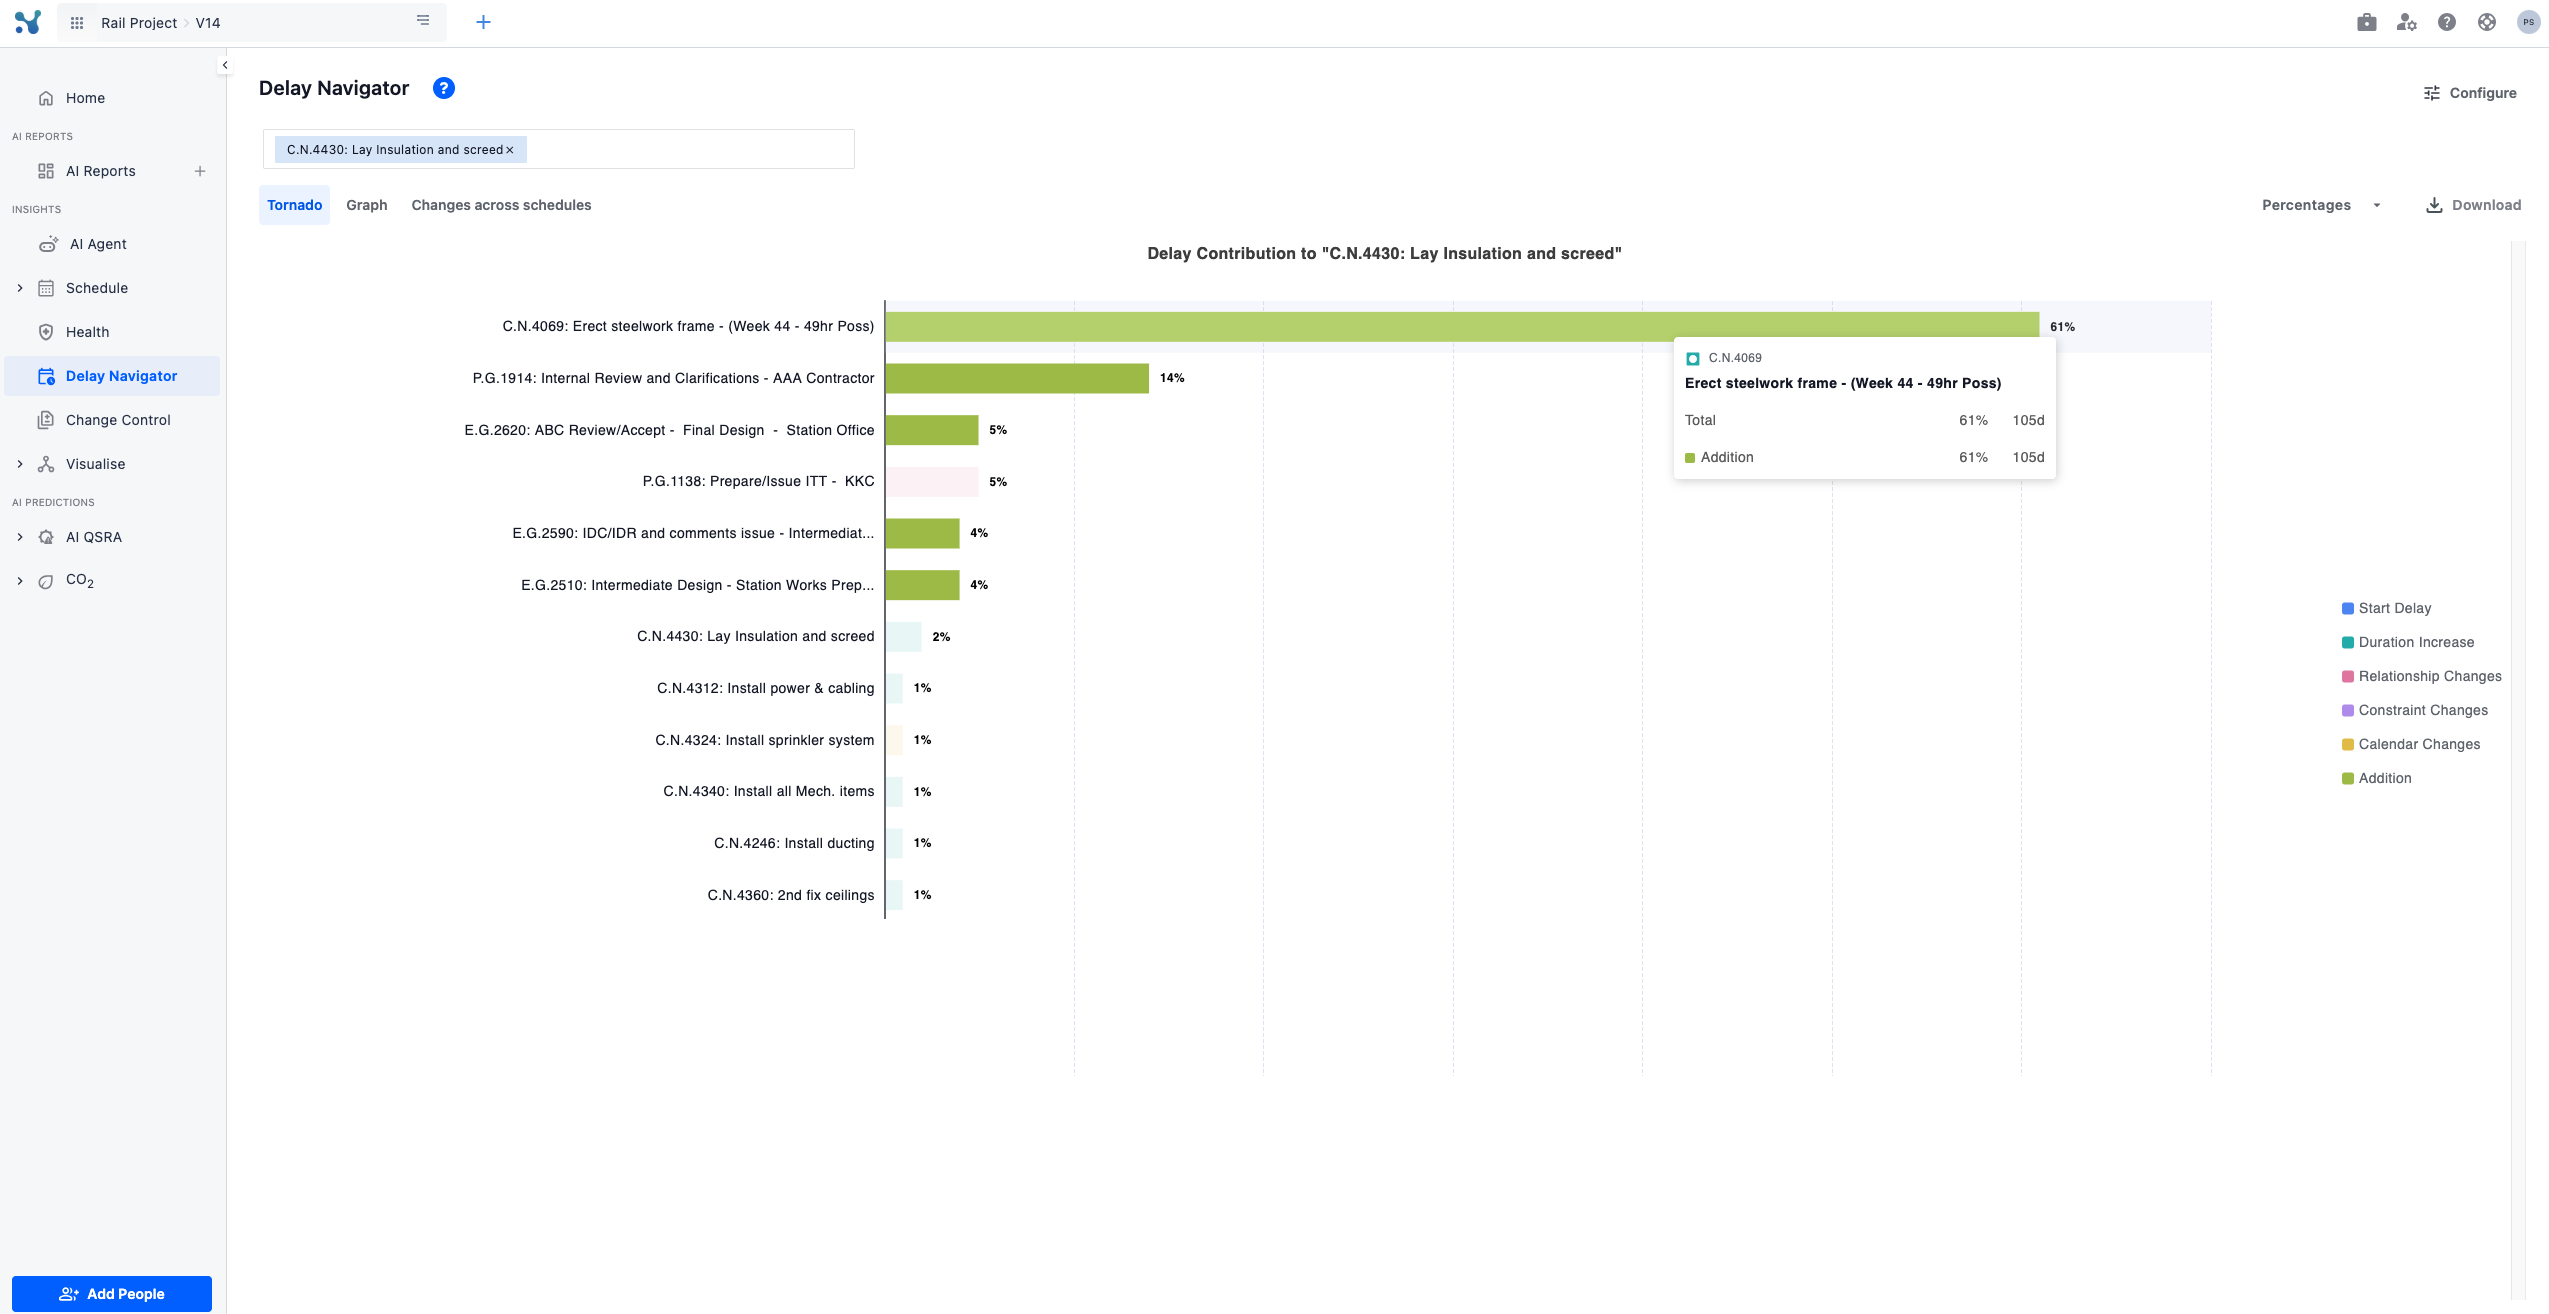
- A tornado chart ranking activities by their percentage (or absolute days) contribution to the selected task’s delay.
- Color-coded bars break out delay by type (e.g. Relationship Changes, Calendar Changes, Additions, Duration Increases).
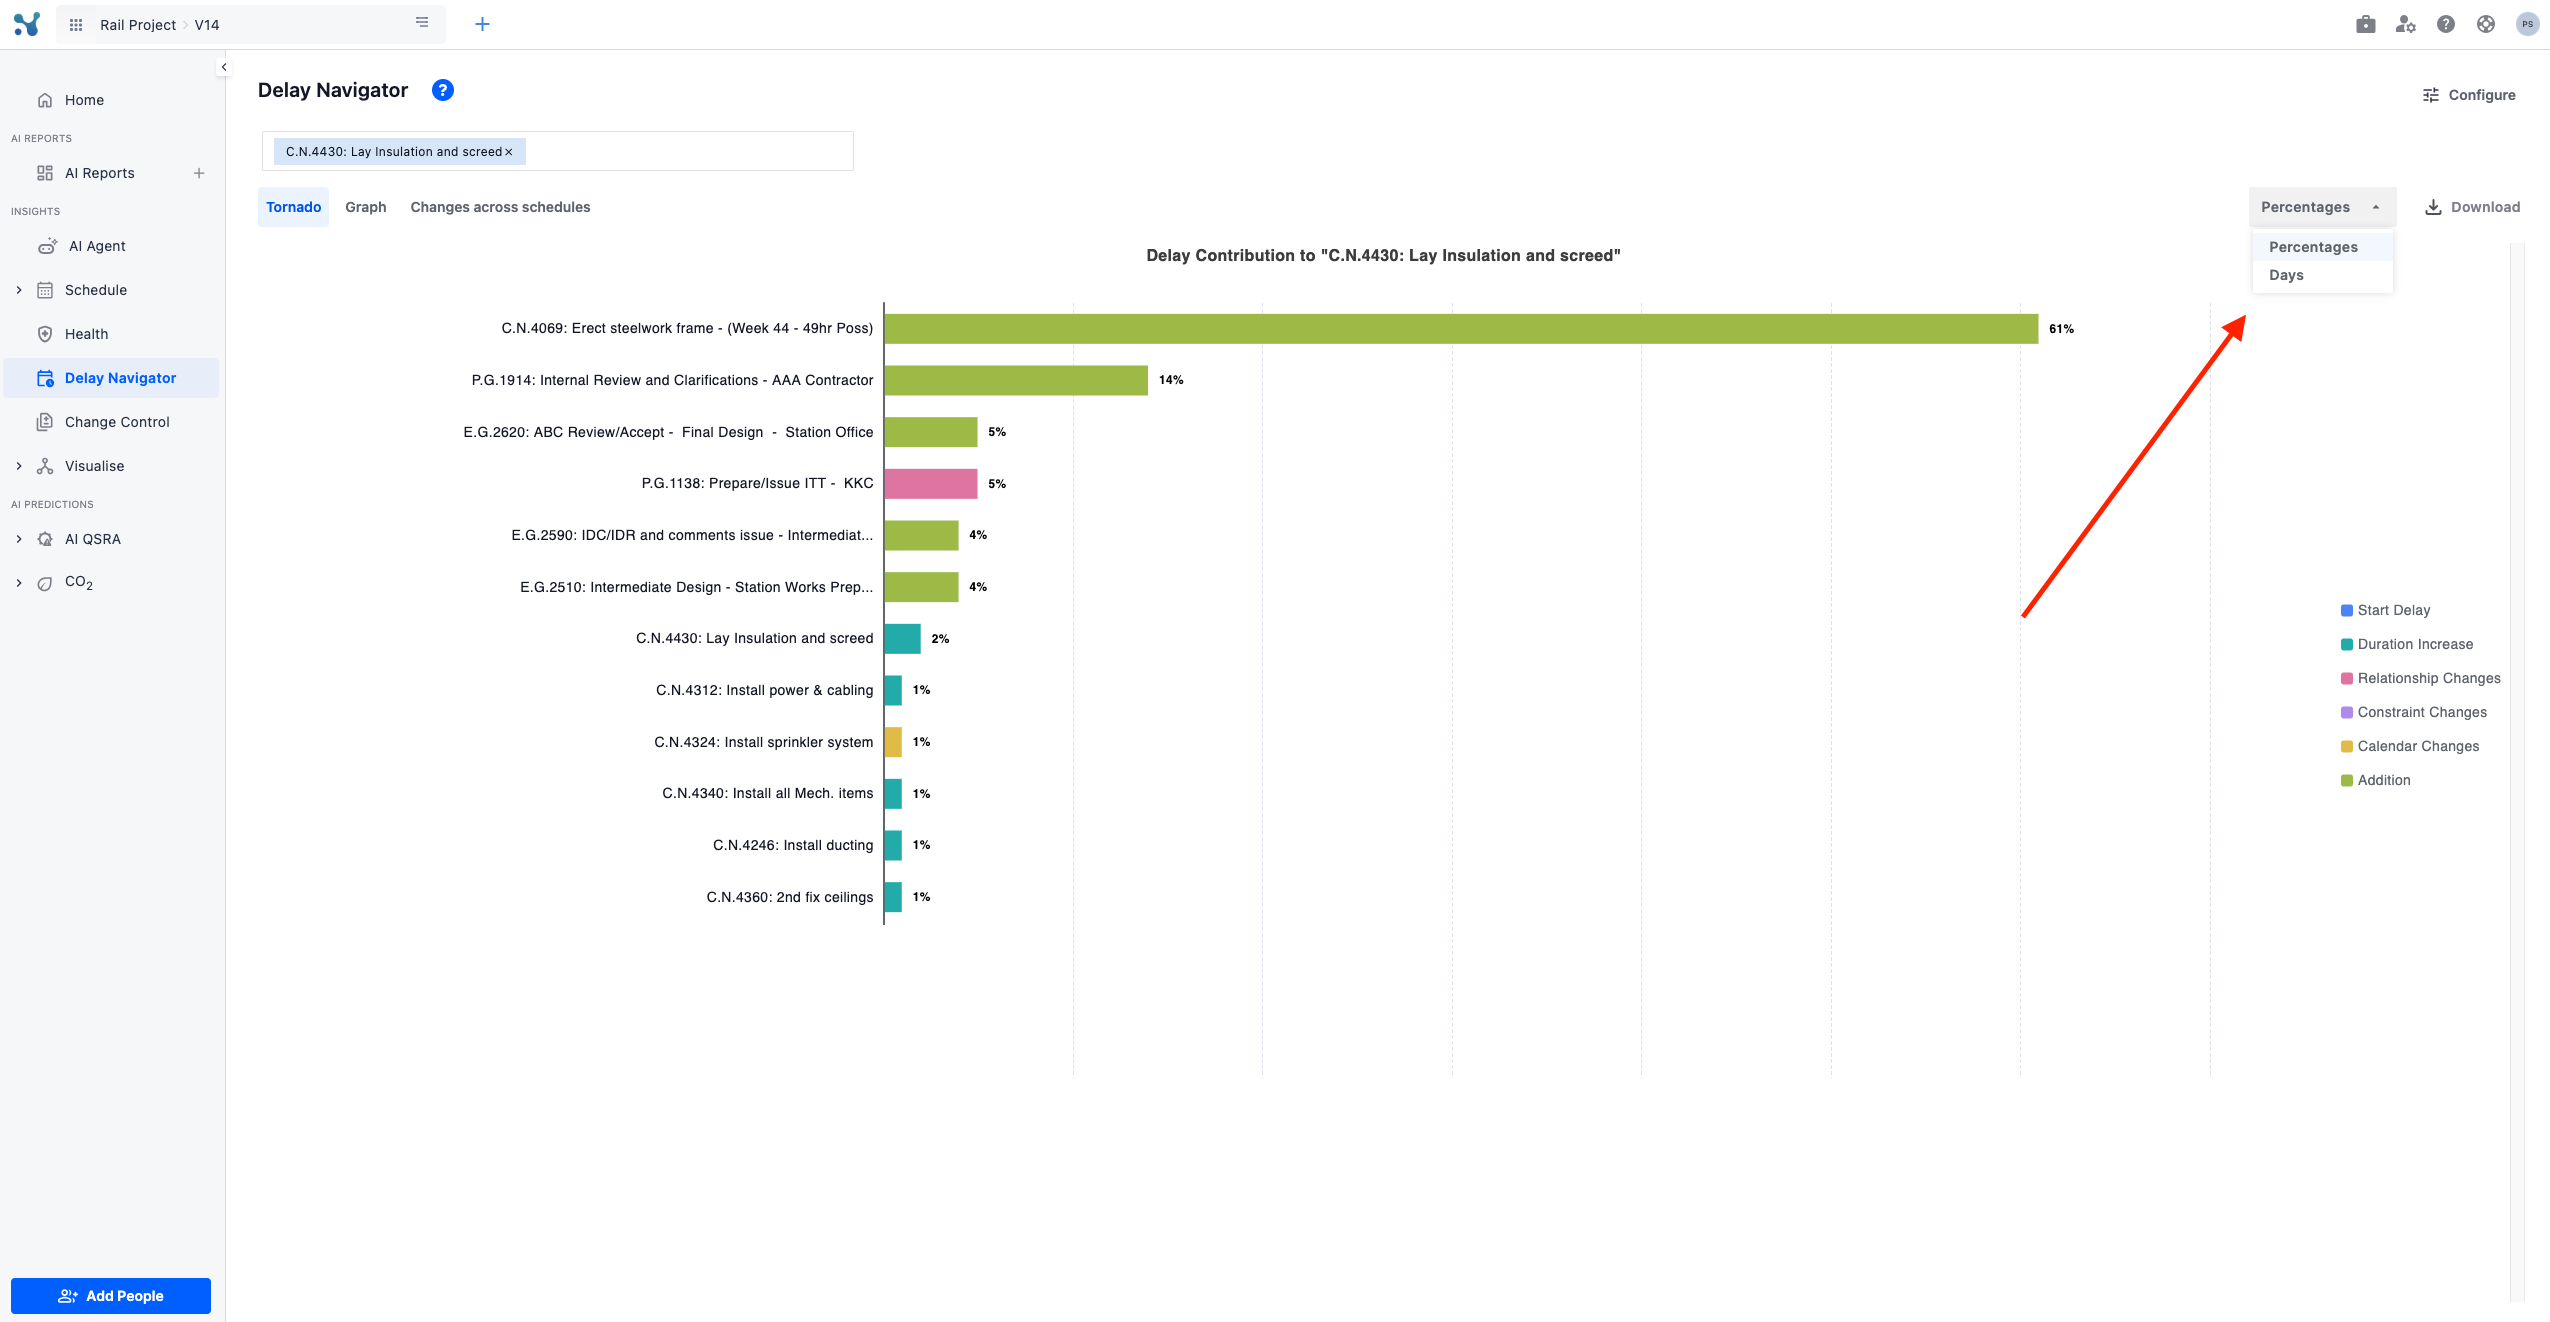
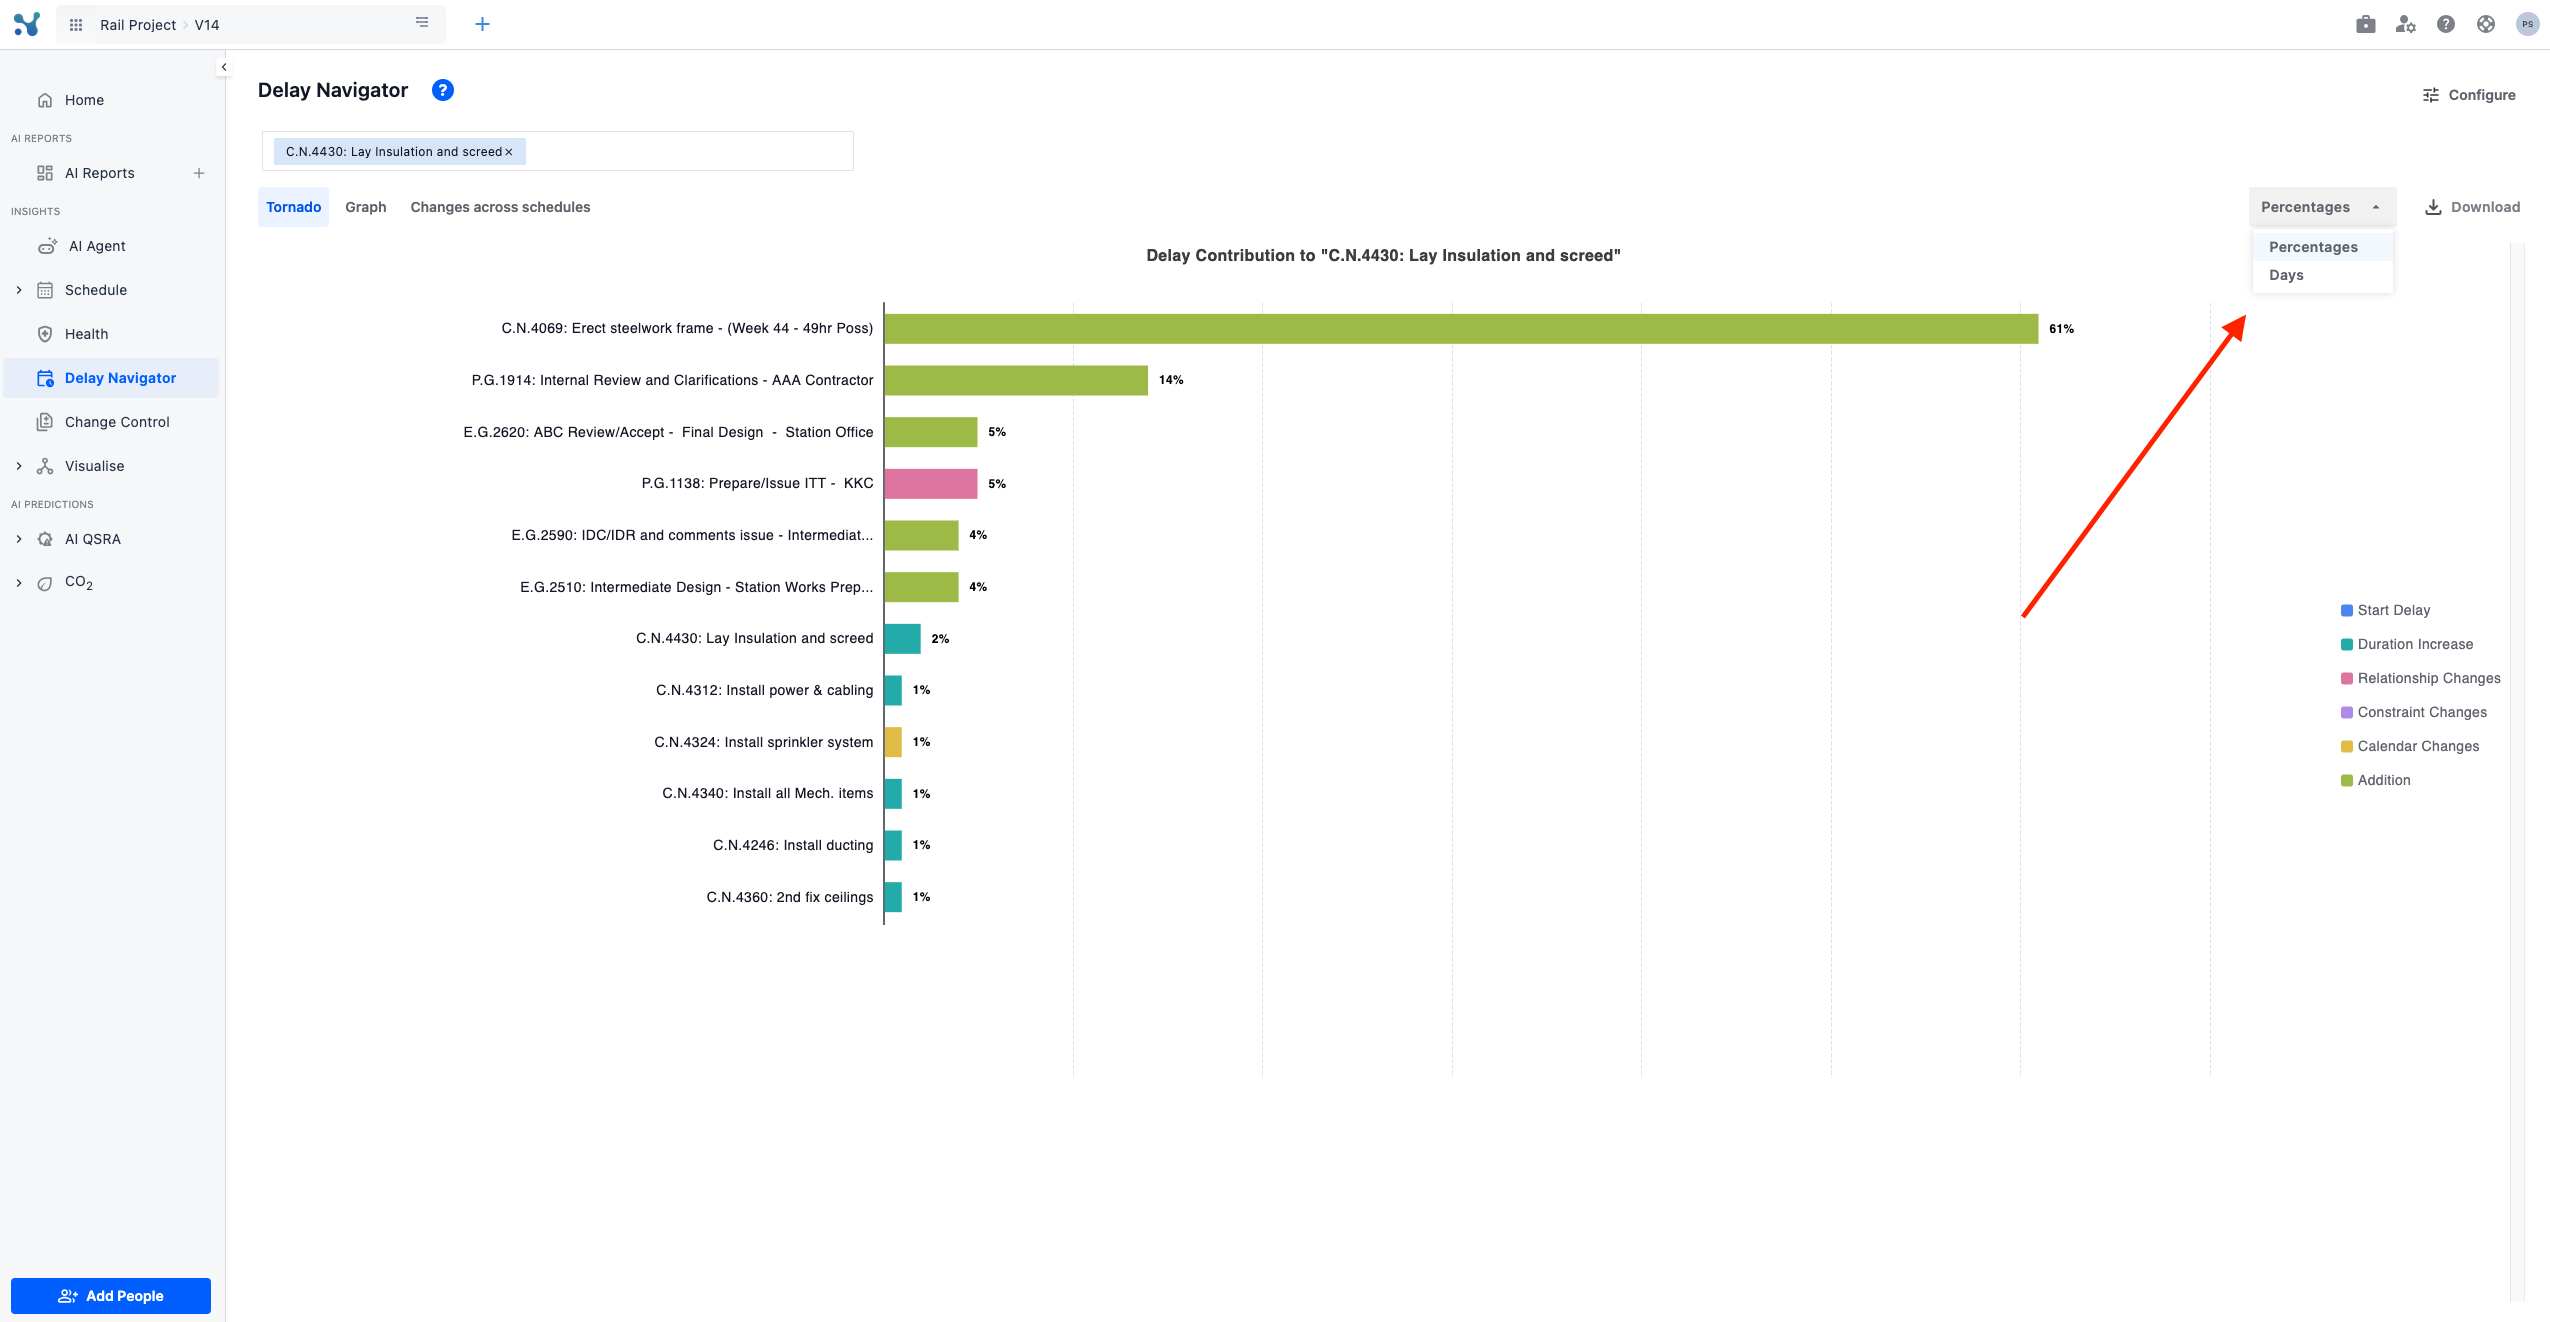
- Toggle in the top-right between Percentages and Days, and download the chart as needed.
Graph
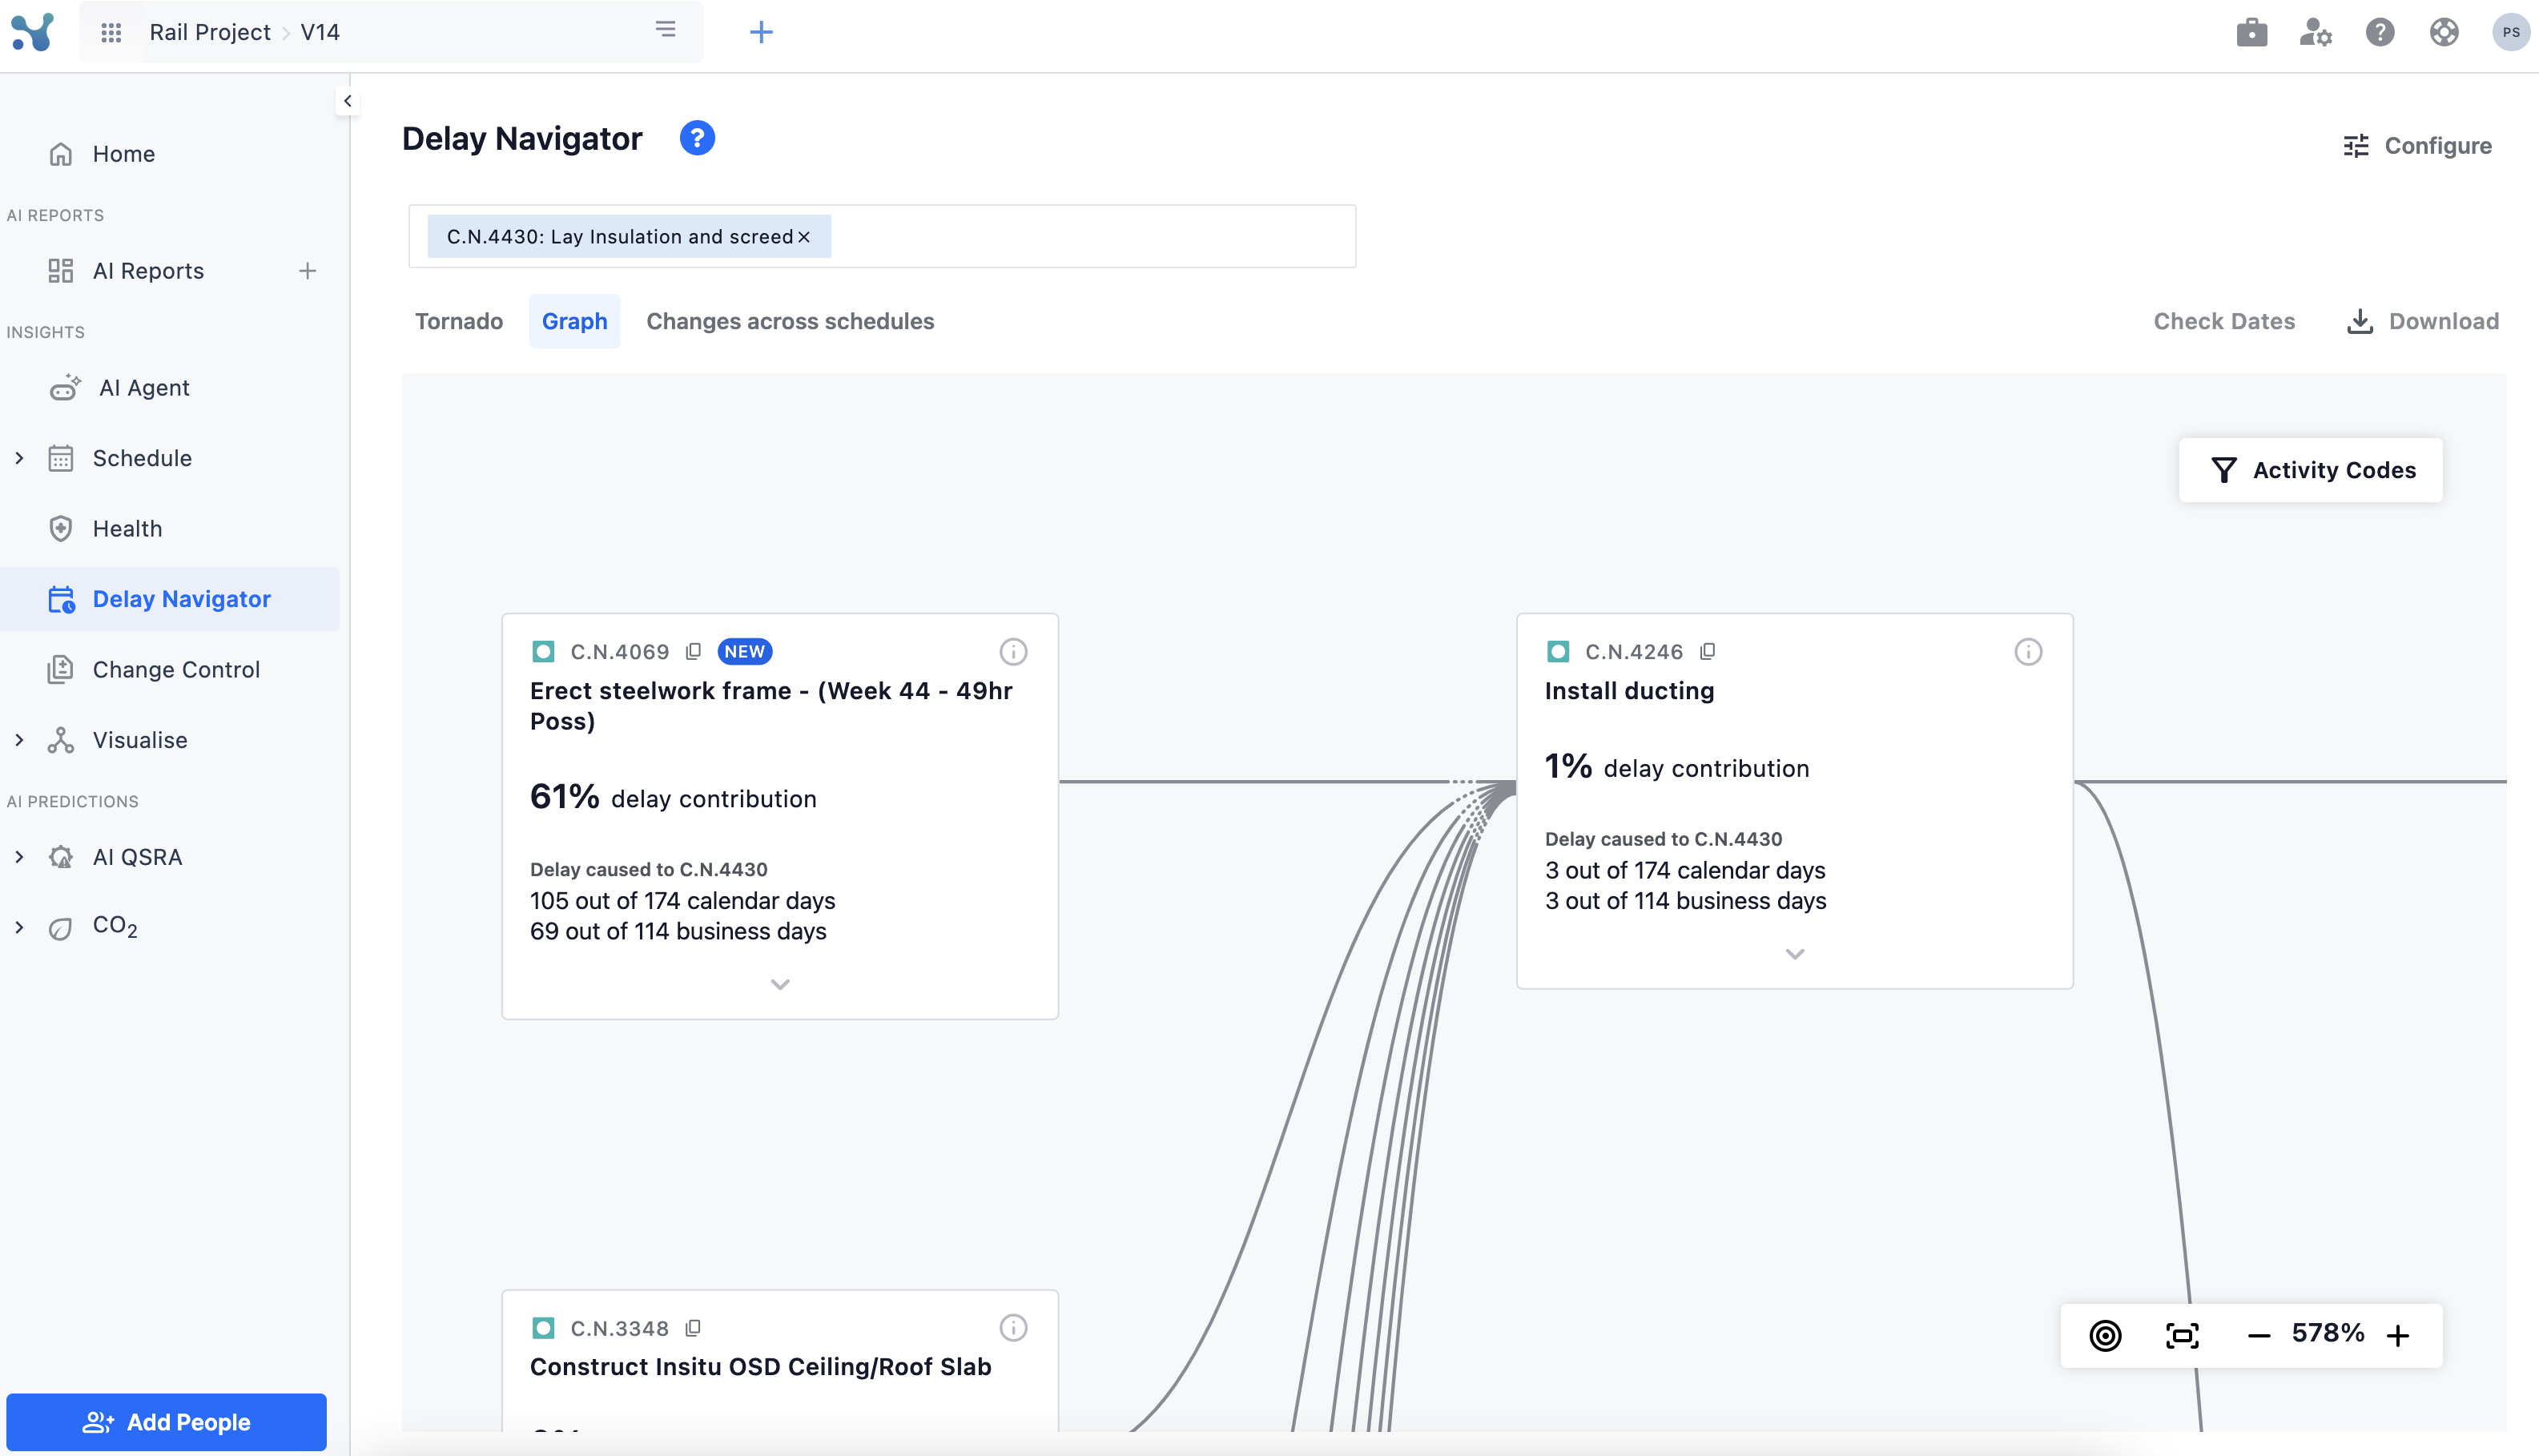
- An interactive, swim-lane style network view showing how upstream delays cascade into your chosen activity (and how its delay propagates downstream) allowing for a network spatial understanding.
- Each card showcases activity data along with a summary of why delay contribution was assigned to it.
Changes across schedules
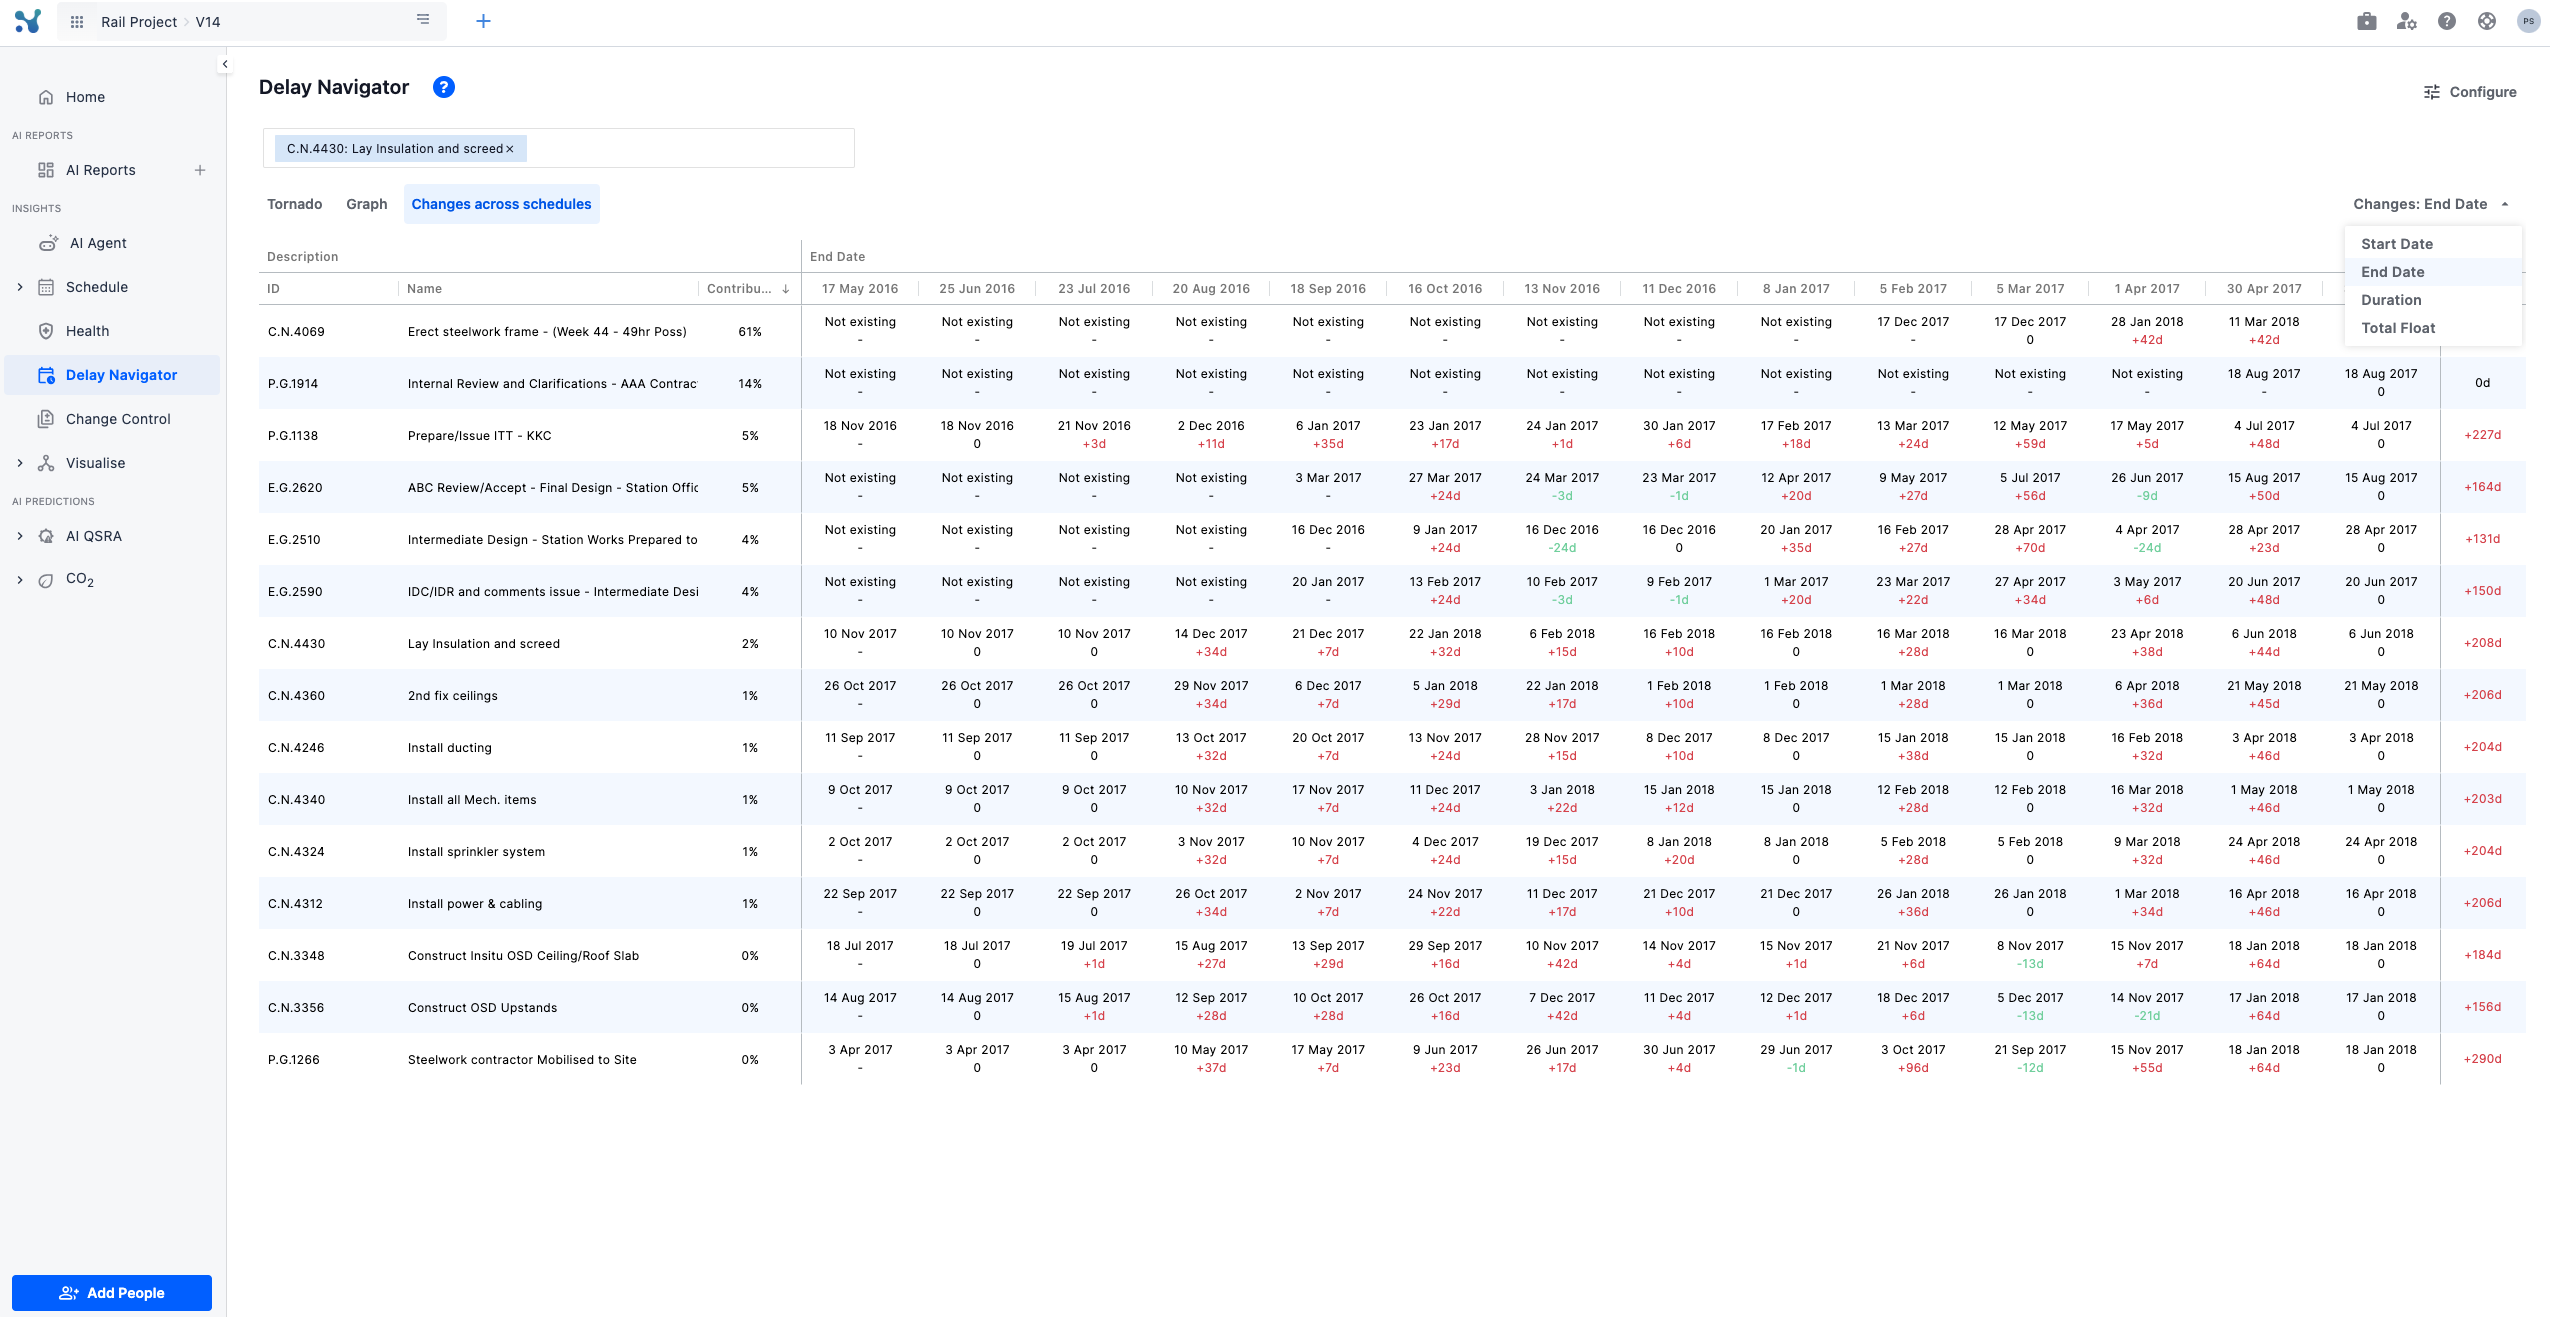
- A snapshot-style table comparing every relevant activity’s end-date (or start-date, duration, float) across multiple schedule updates—from your original baseline through each re-forecast.
- Cells show red “+X” values for slips and green “–X” for gains, giving you an at-a-glance history of when and how each task moved.
- Use the column drop-down to switch metric, and export the full grid for reporting.
How does it work?
An activity gets 'Delay Contribution' assigned to it if:
- It’s duration gets increased.
- It starts later than it should without being pushed by a predecessor.
- If the constraint assigned on it is altered in a way that it delayed its start or end date.
- A relationship assigned to an activity is altered in a way that it delayed its start or end date.
- If the calendar assigned on it is altered in a way that affected its start or end date.
What happens if an activity only transmits delay and does not cause it?
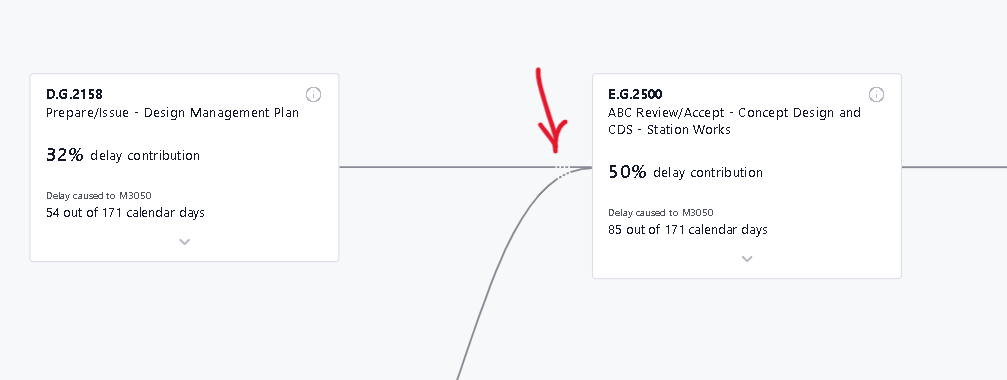
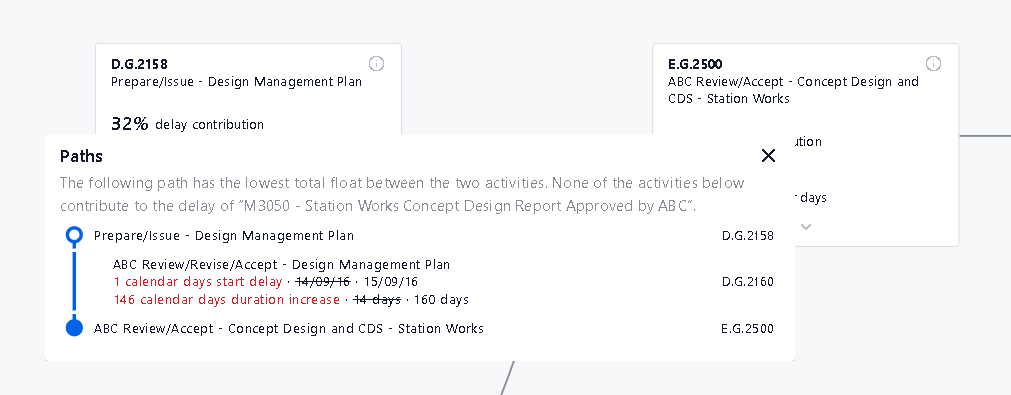
Sometimes activities in a path only transmit delays down the line. They get pushed by a predecessor and they push their successor by an equal amount but don’t cause any delay on their own. In order to avoid cluttering the screen we “hide” those activities behind three dots in the connection line.
The lines with 3 dots can be clicked which will result in a pop up showcasing those in between activities. Among the many paths that may exists between 2 activities , we showcase the one that trasmits the most delay.
Which activities show up in the Delay Navigator canvas?
After the calculations have been made, activities with Delay Contribution equal or greater than 1% or 1 day of 'Delay Contribution' show up in the canvas. The criteria that activities need to meet in order to get Delay Contribution assigned to them are as follows:
Checking details on the Tornado Graph
In order to check the details of an activity on the tornado graph you simply hover on the activity.
You can also change the tornado graph to depict days instead of percentages by clicking on the 'percentages' drop-down on the top right section of the screen.
I want to decide the Delay Contribution on my own!
Our own algorithm created by our scientists reads the data and calculates delay contribution for each activity in Contribution Mode. However, since there are a lot of intricacies in legal frameworks across countries, companies and legal contracts, we are also offering a Dates mode showcasing all available data, for the experts to decide themselves. You can switch into that mode by selecting "Check Dates" at the top right
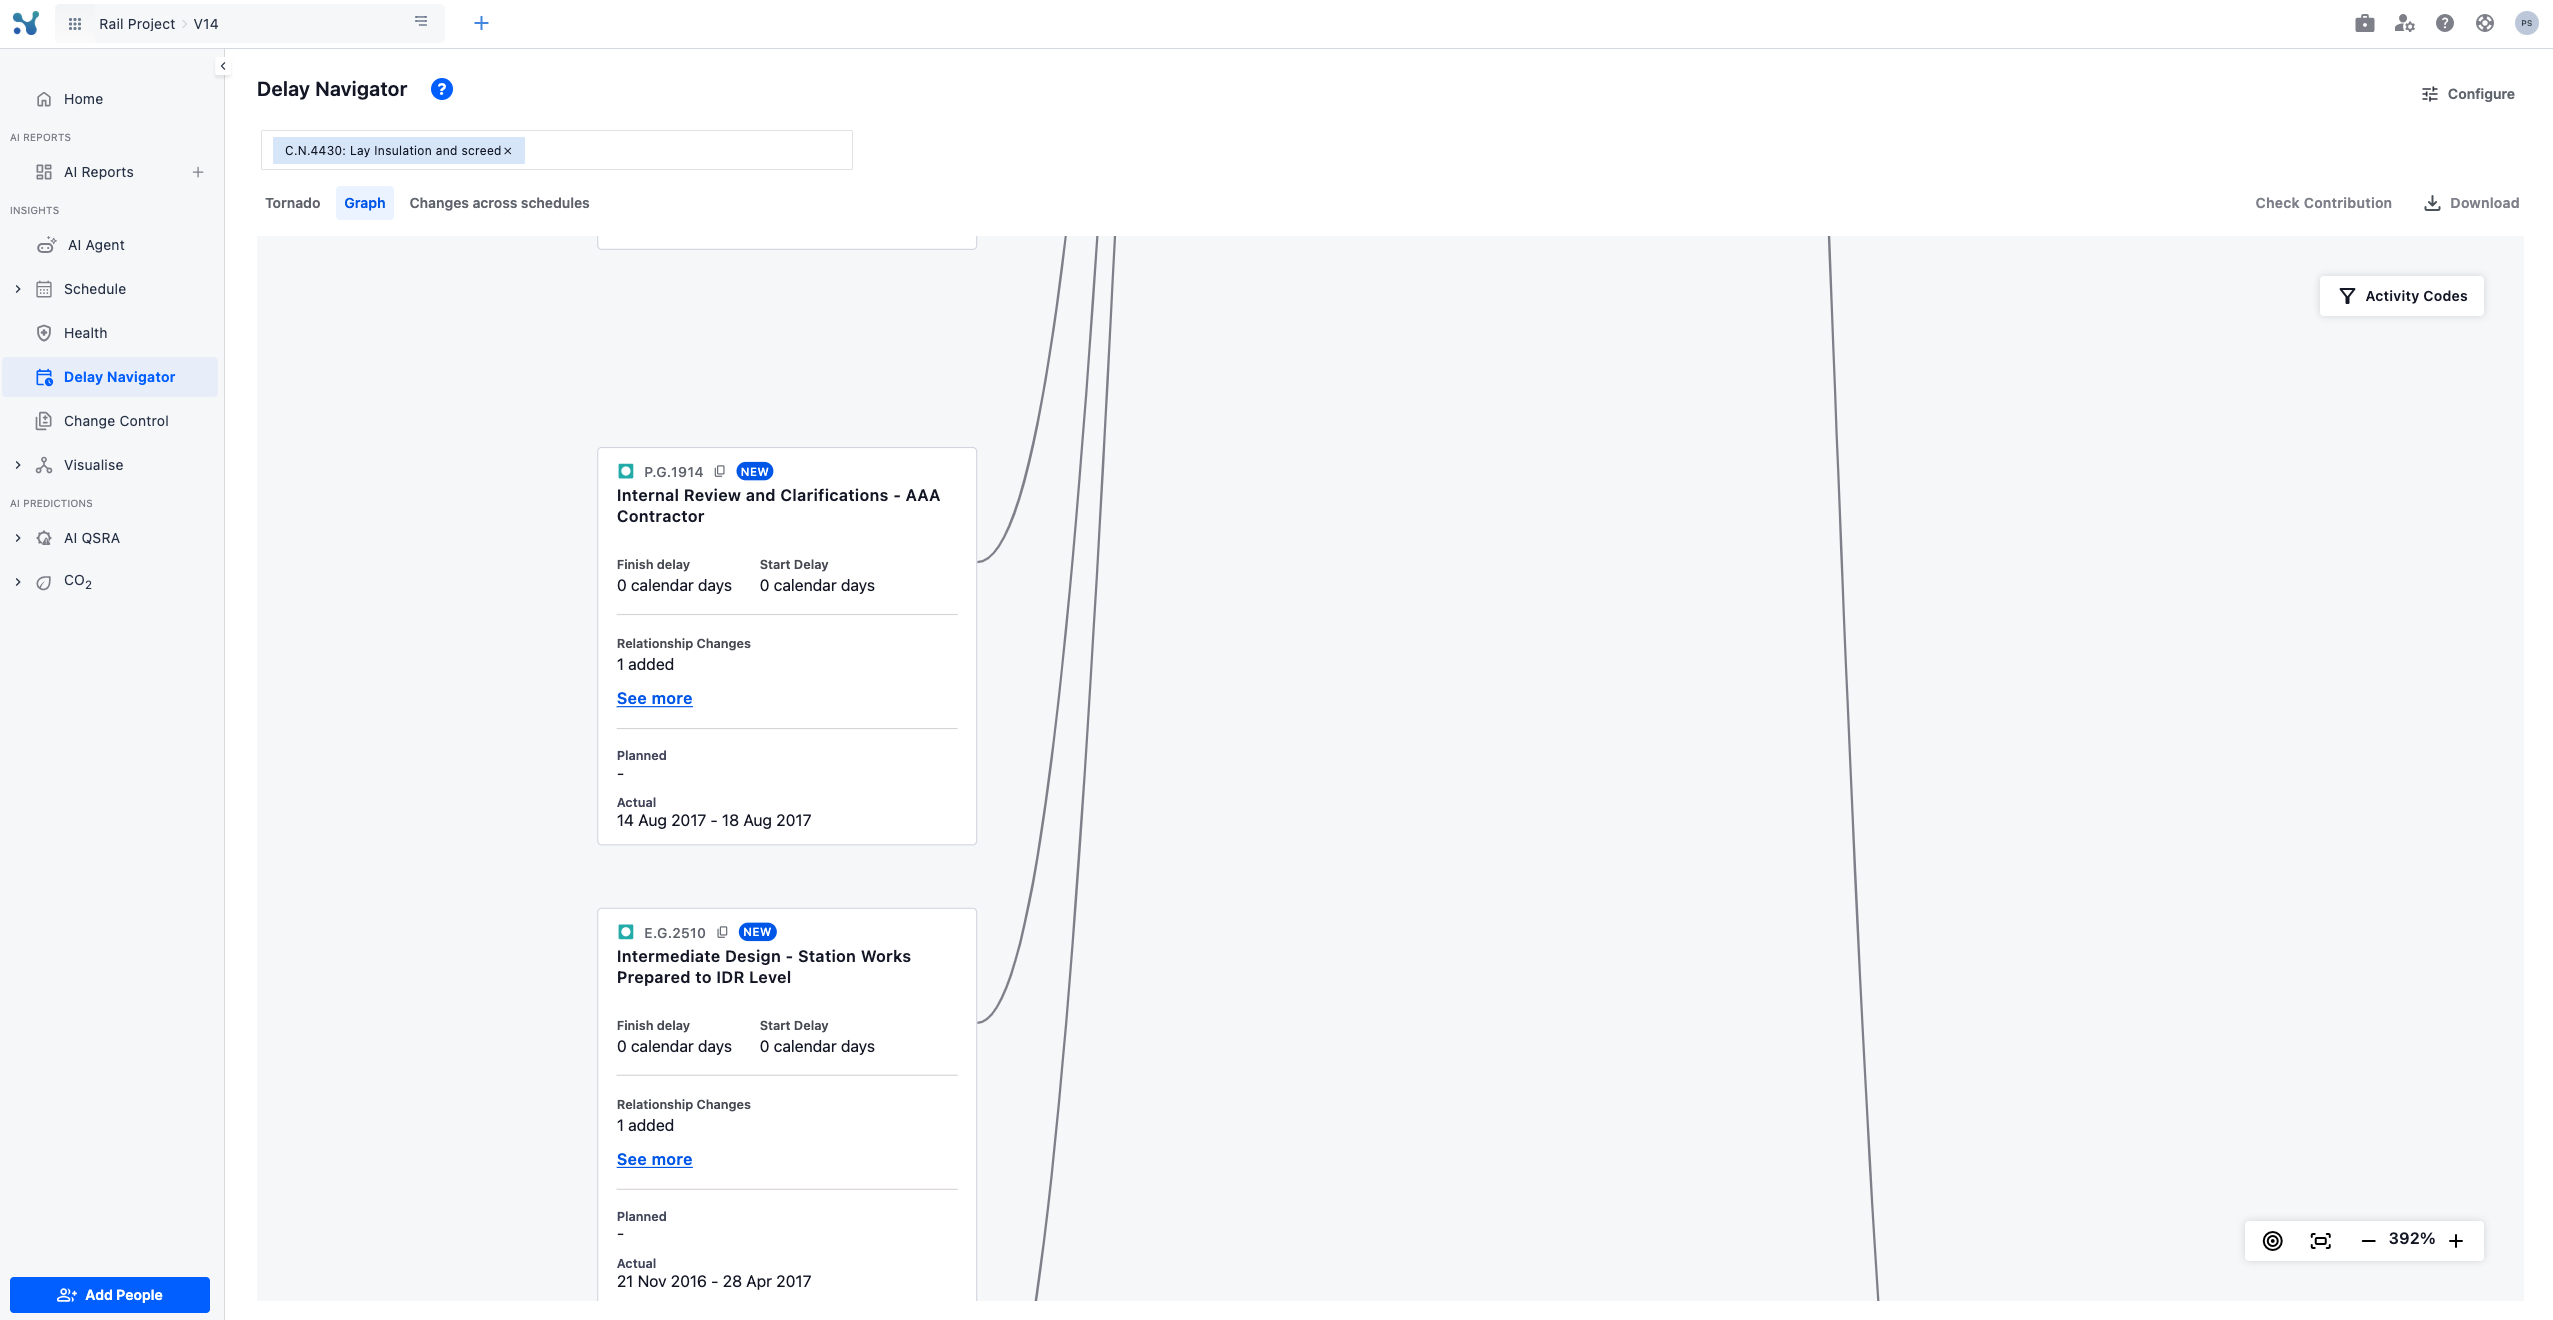
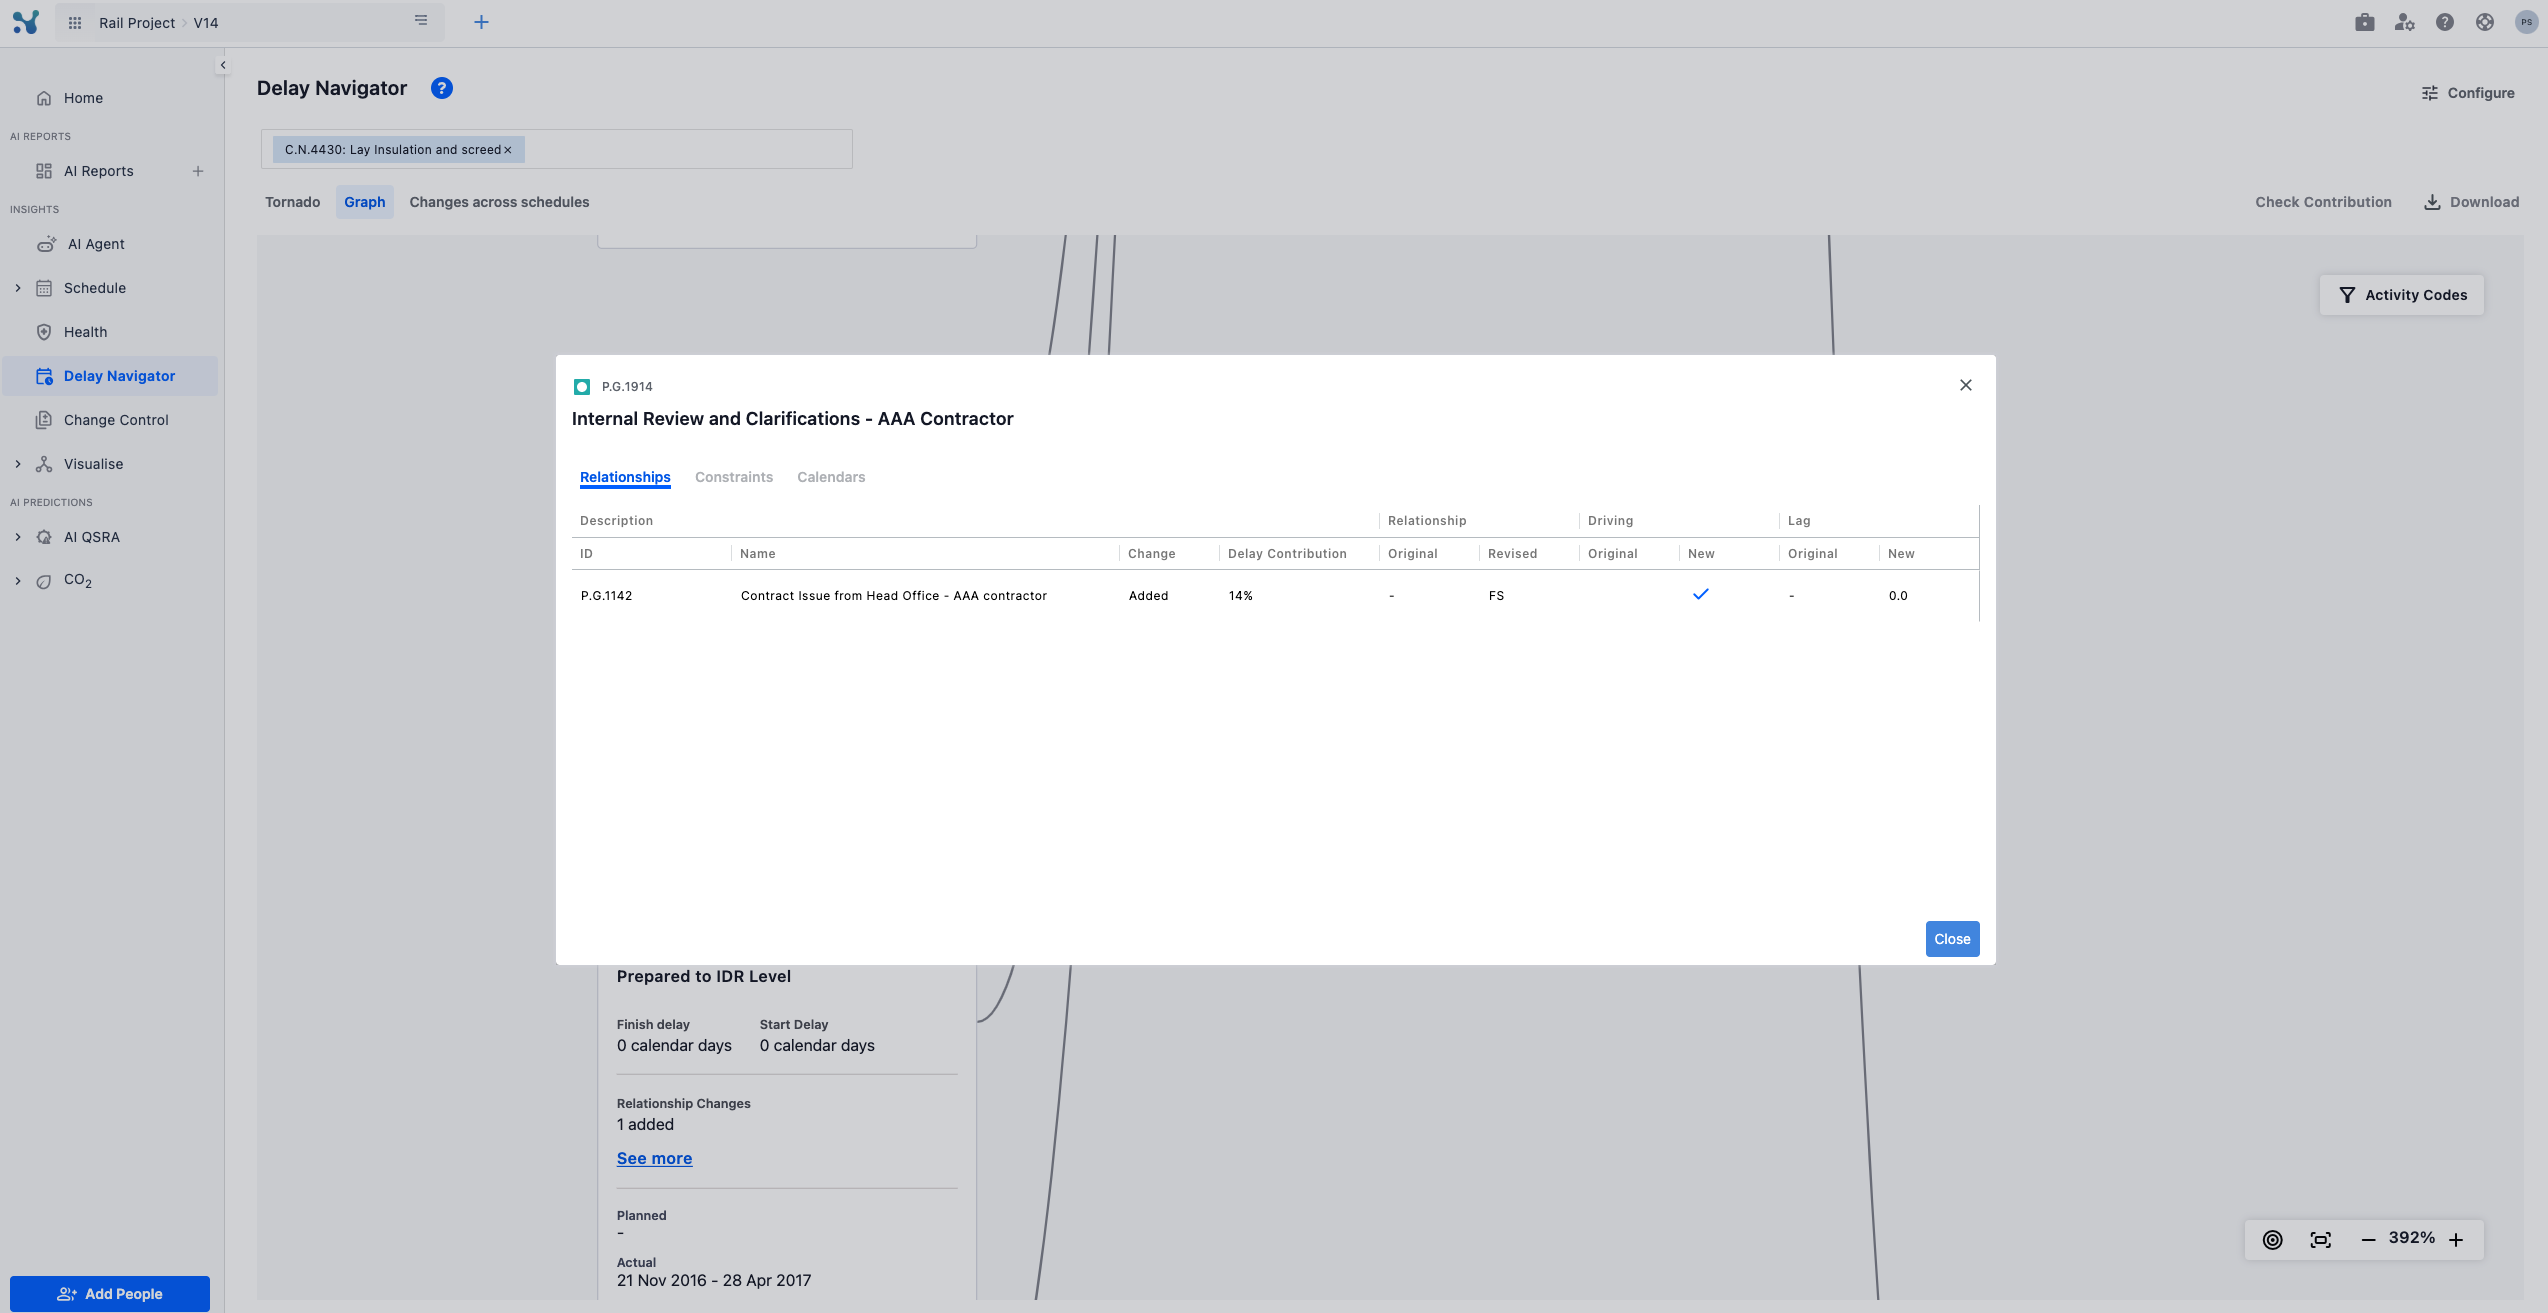
You can dive into even more detail when there are relationship, constraint or calendar alterations by clicking on the 'see more' button and a pop up will come up showcasing all the related information.
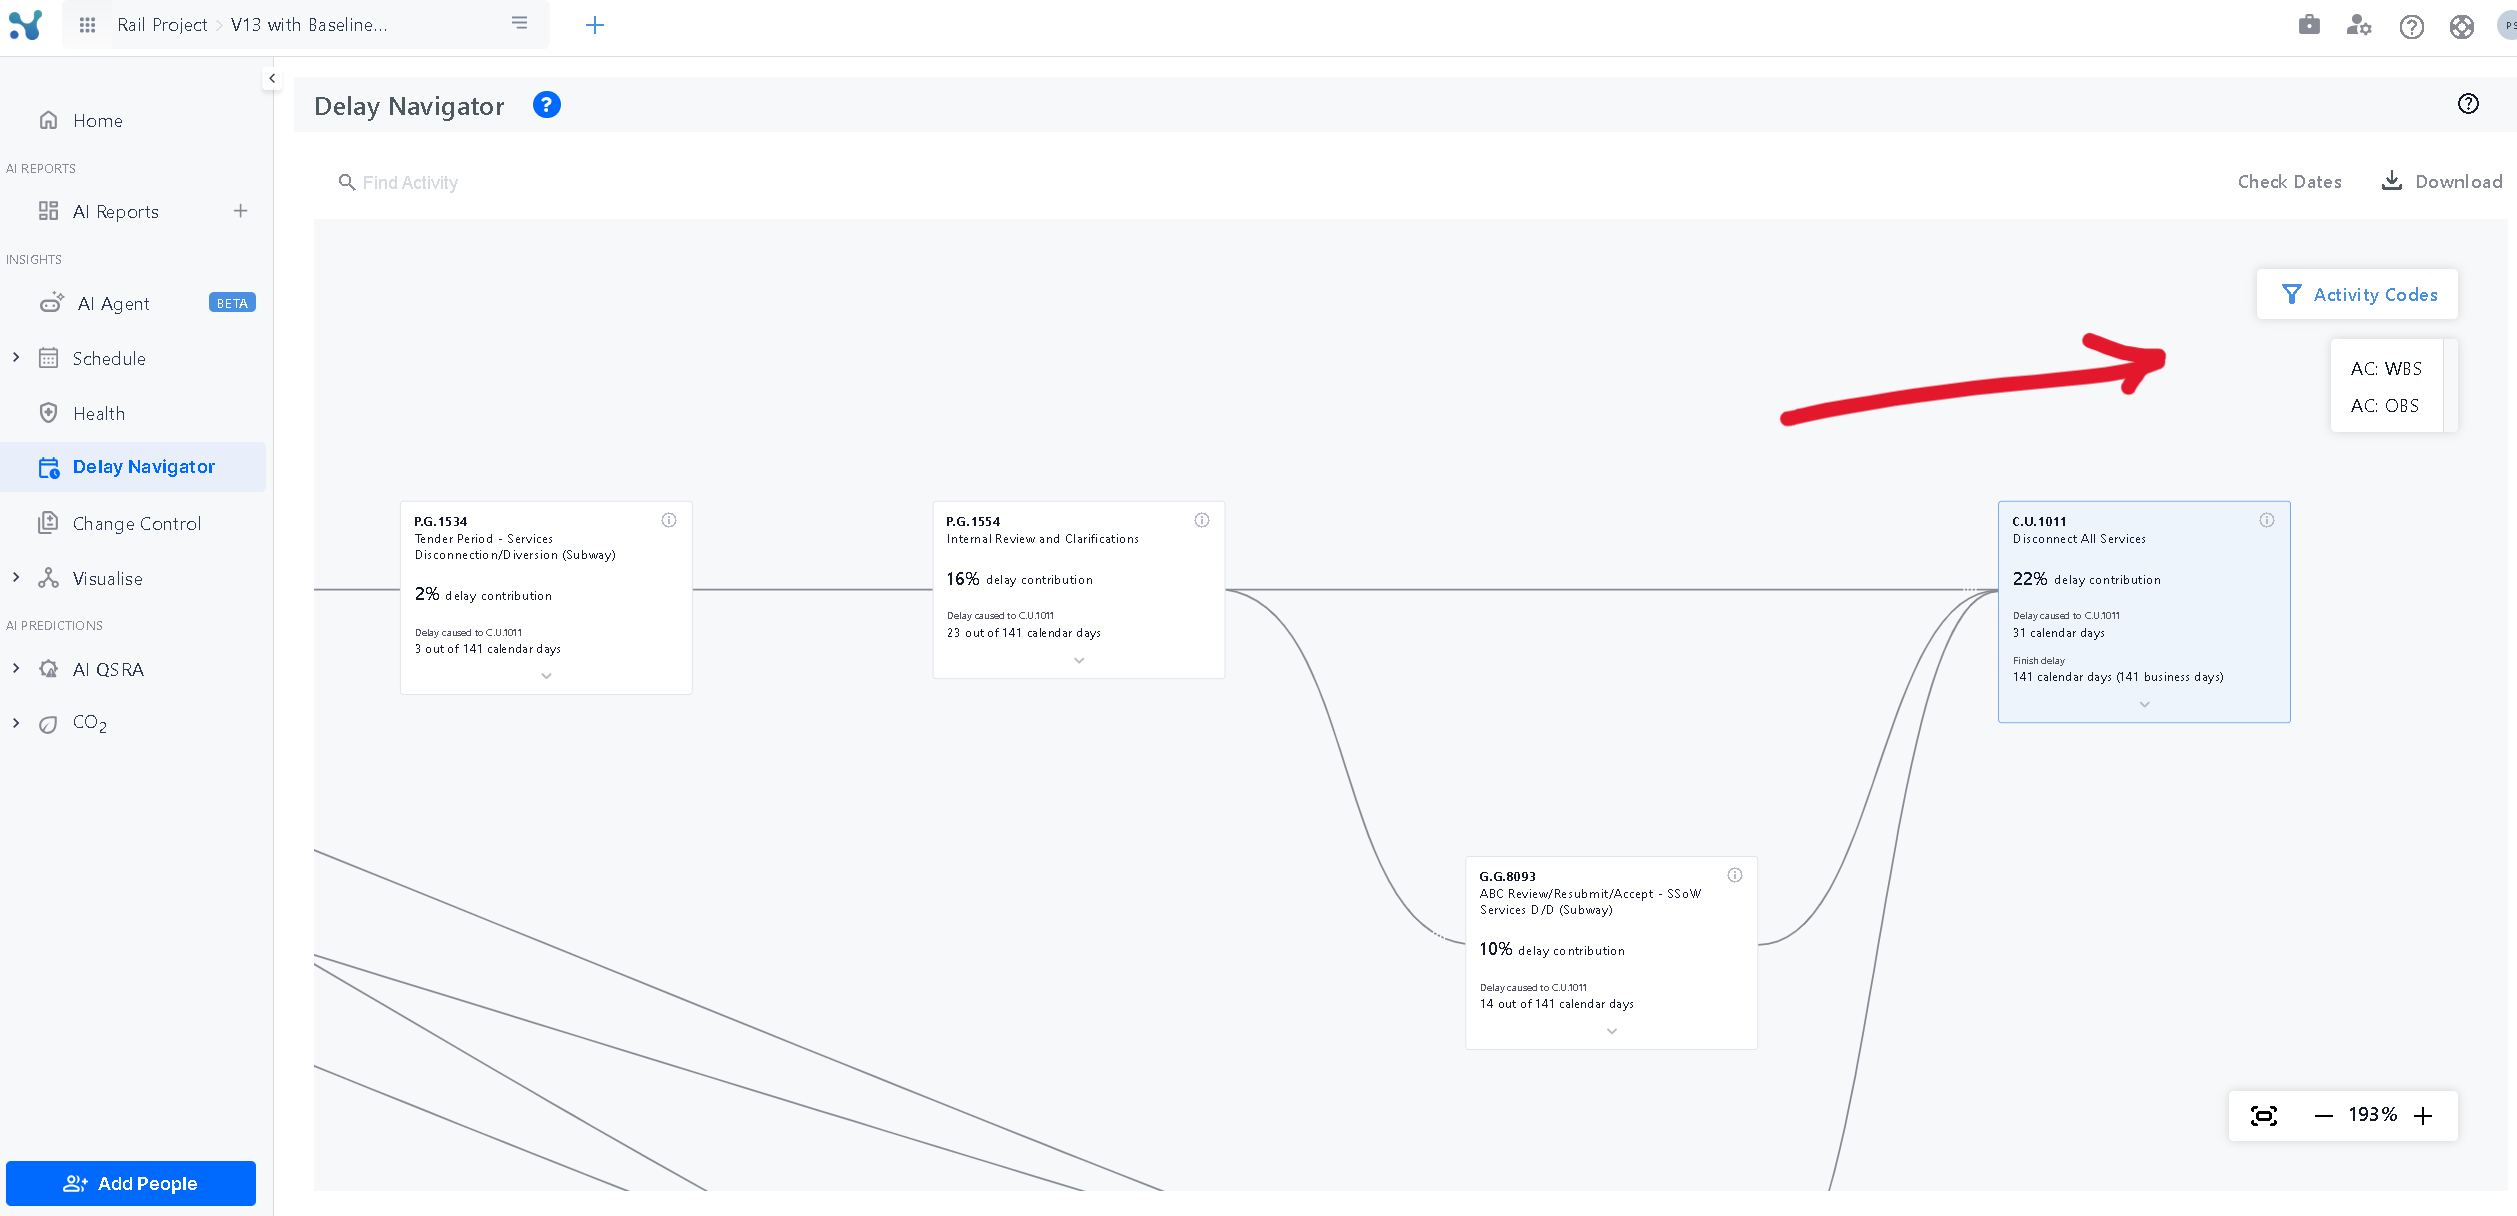
Highlighting Activity Codes
You can also filter the activities in the graph based on their Activity codes to see which of your suppliers, activities, or contractors have the most delay contributions.
Cases where the Delay Navigator will not run
- Having a single file uploaded in your project.
- Having no baseline set.
- Having the baseline as the currently selected schedule.
- Attempting to investigate an activity whose finish date has not been altered between the 2 schedules.
- Attempting to investigate an activity which is part of a network with cycles.
Understanding Delay Navigator better through examples
Scenario 1
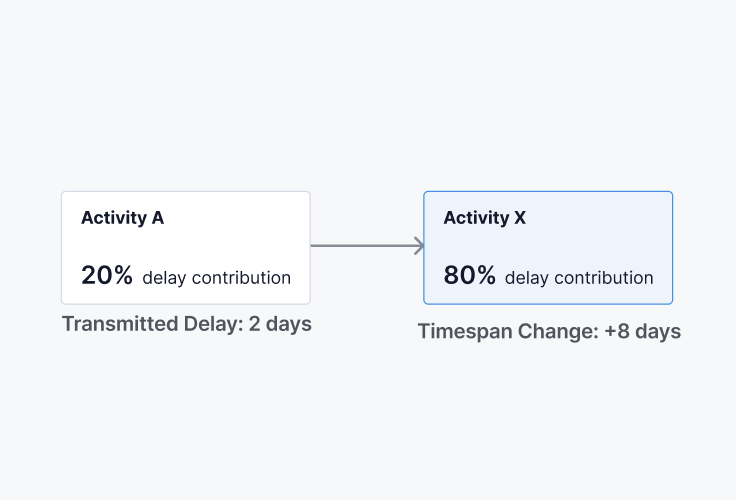
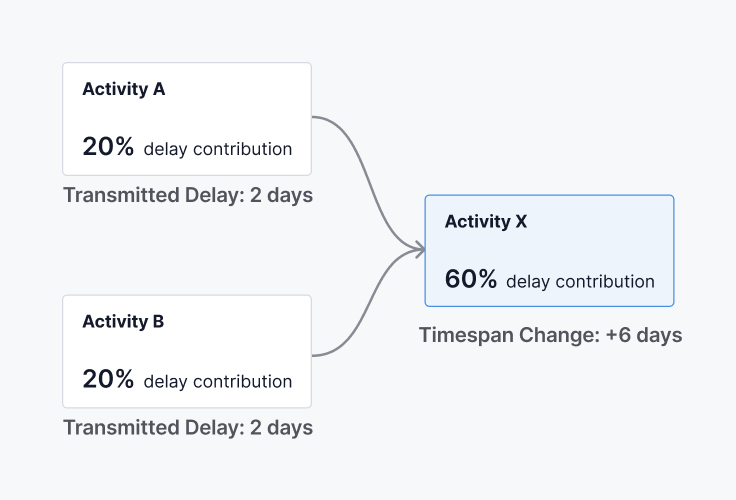
Activity X has a Total Delay of 10 days (Finish Delay). This delay is affected by Activity A’s transmitted delay to Activity X and its own Timespan Change.
Scenario 2
Activity X has a Total Delay of 10 days (Finish Delay). This delay is affected by Activity A’s transmitted delay to Activity X and its own Timespan Change.
Glossary
Total Delay (Finish Delay)
Absolute days difference between planned finish and actual finish.
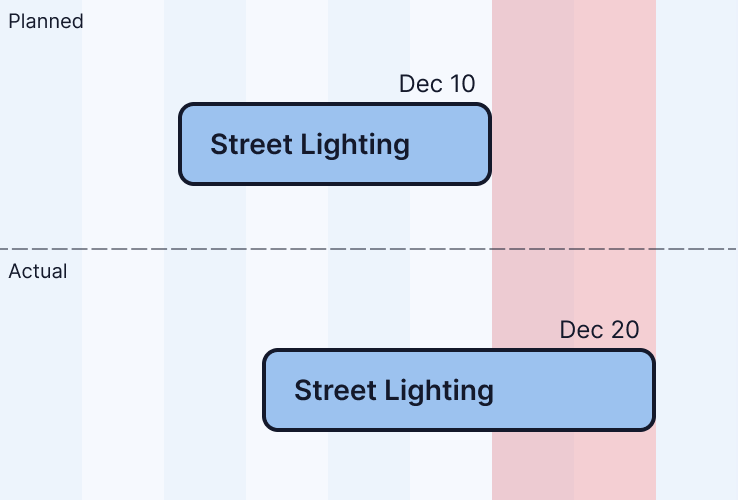
Total delay = 10 days
Timespan
The timespan is the sum of Working and Non-working days.
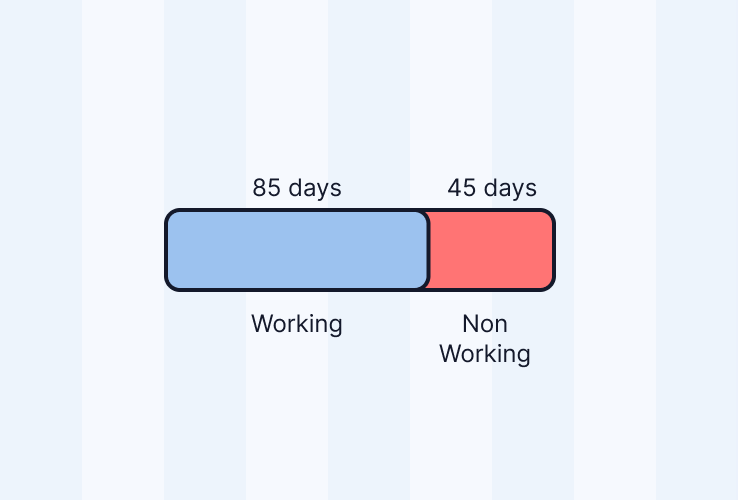
Timespan = 85 + 45
Working Days Change
Working days difference between planned and actual.
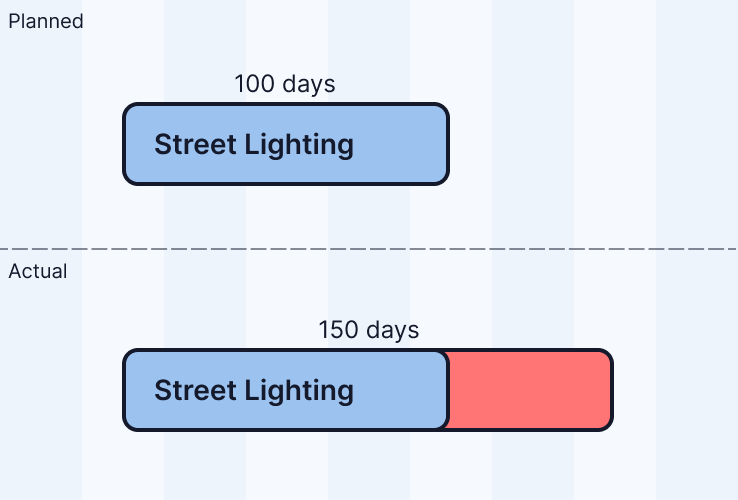
Working days change = +50 days
Non Working Days Change
Non Working days difference between planned and actual e.g weekends and bank holidays.
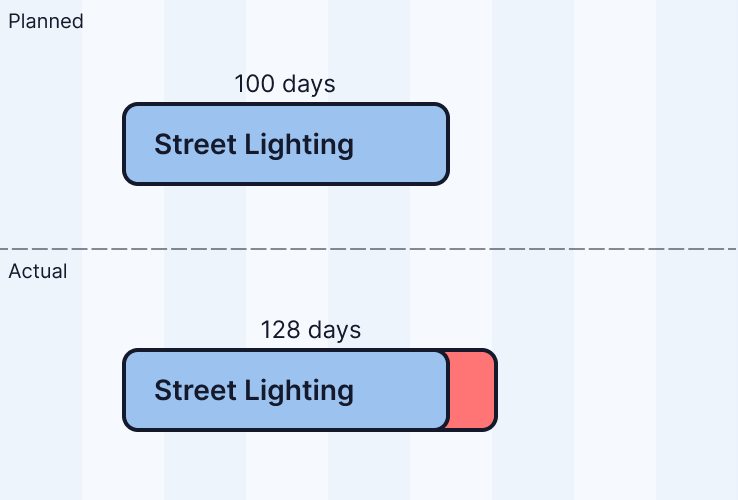
Non Working days change = +28 days
Start Delay
Absolute days difference between planned start and actual start.
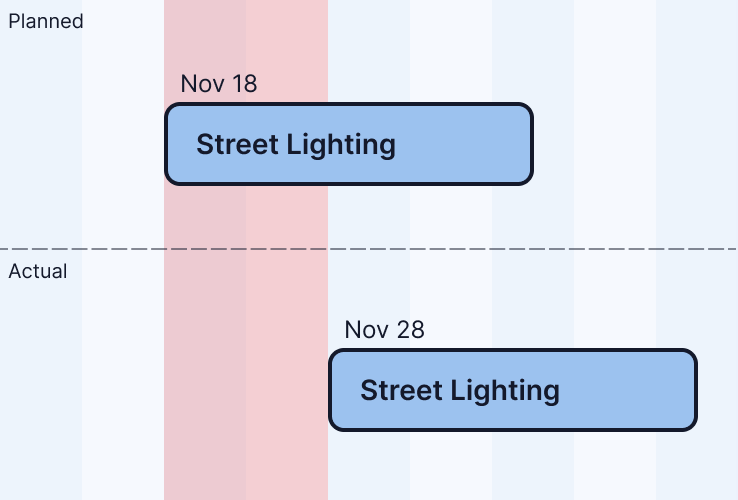
Start delay = 10 days
Transmitted Delay
How much of an activity’s delay is being leaked to the next activity, pushing its Start date (or Finish date if the relationship is Finish-Finish).
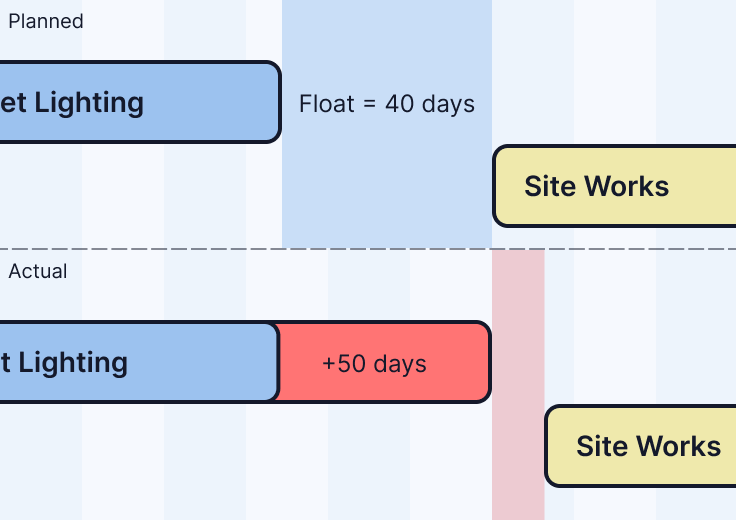
Transmit. delay = 10 days
Activity’s Actual Finish + Actual Lag - Successor’s Planned Start
Advanced
How do we compute Relationship Alteration Contribution?
- We have two scenarios: Scenario A is the current schedule. Scenario B is the current schedule, with the relationships of the baseline schedule. Note that scenario B, preserves everything else from scenario A, including the activity durations of the current schedule.
- Each relationship in each scenario is scheduled independently of the other relationships. This gives us a successor start date for each relationship in each scenario.
- Delay due to Relationship alteration is defined as: Difference between successor start dates in two scenarios, if scenario A successor start date > scenario B successor start date.
- Delay due to Relationship alteration constitutes part of the current start delay
How do we compute Constraint Alteration Contribution?
- We have two scenarios: Scenario A is the current schedule. Scenario B is the current schedule, with the constraints of the baseline schedule. Note that scenario B preserves everything else from scenario A, including the activity durations of the current schedule.
- Each activity with a constraint in each scenario is scheduled independently of the other activities. This gives us a start date for each activity with a constraint in each scenario.
- Delay due to Constraint alteration is defined as: Difference between start dates in two scenarios, if scenario A start date > scenario B start date.
- Delay due to Constraint alteration constitutes part of the current start delay.
How do we compute Calendar Alteration Contribution?
- During the computation of contribution due to Relationship Alteration, Constraint Alteration, and Duration Alteration we have always two scenarios: Scenario A is the current schedule and Scenario B is the current schedule with some component of the baseline schedule depending on the part we are computing (Relationship, Constraint, Duration). In all computations, scenario B is scheduled with the calendars of the baseline schedule. Thus, inherently the resulting contributions contain a portion that can be attributed to calendar change if such a change occurred. Delay due to Calendar Alteration of an activity is defined as the sum of portions of Relationship Alteration, Constraint Alteration, and Duration Alteration that can be attributed to calendar changes on the activity.
