🗺 Visualise (Roadmap)
This screen allows you to...
- Get the big picture of your project
- Communicate the project to someone who doesn't work on the project
- Understand the schedule of a project you just took over
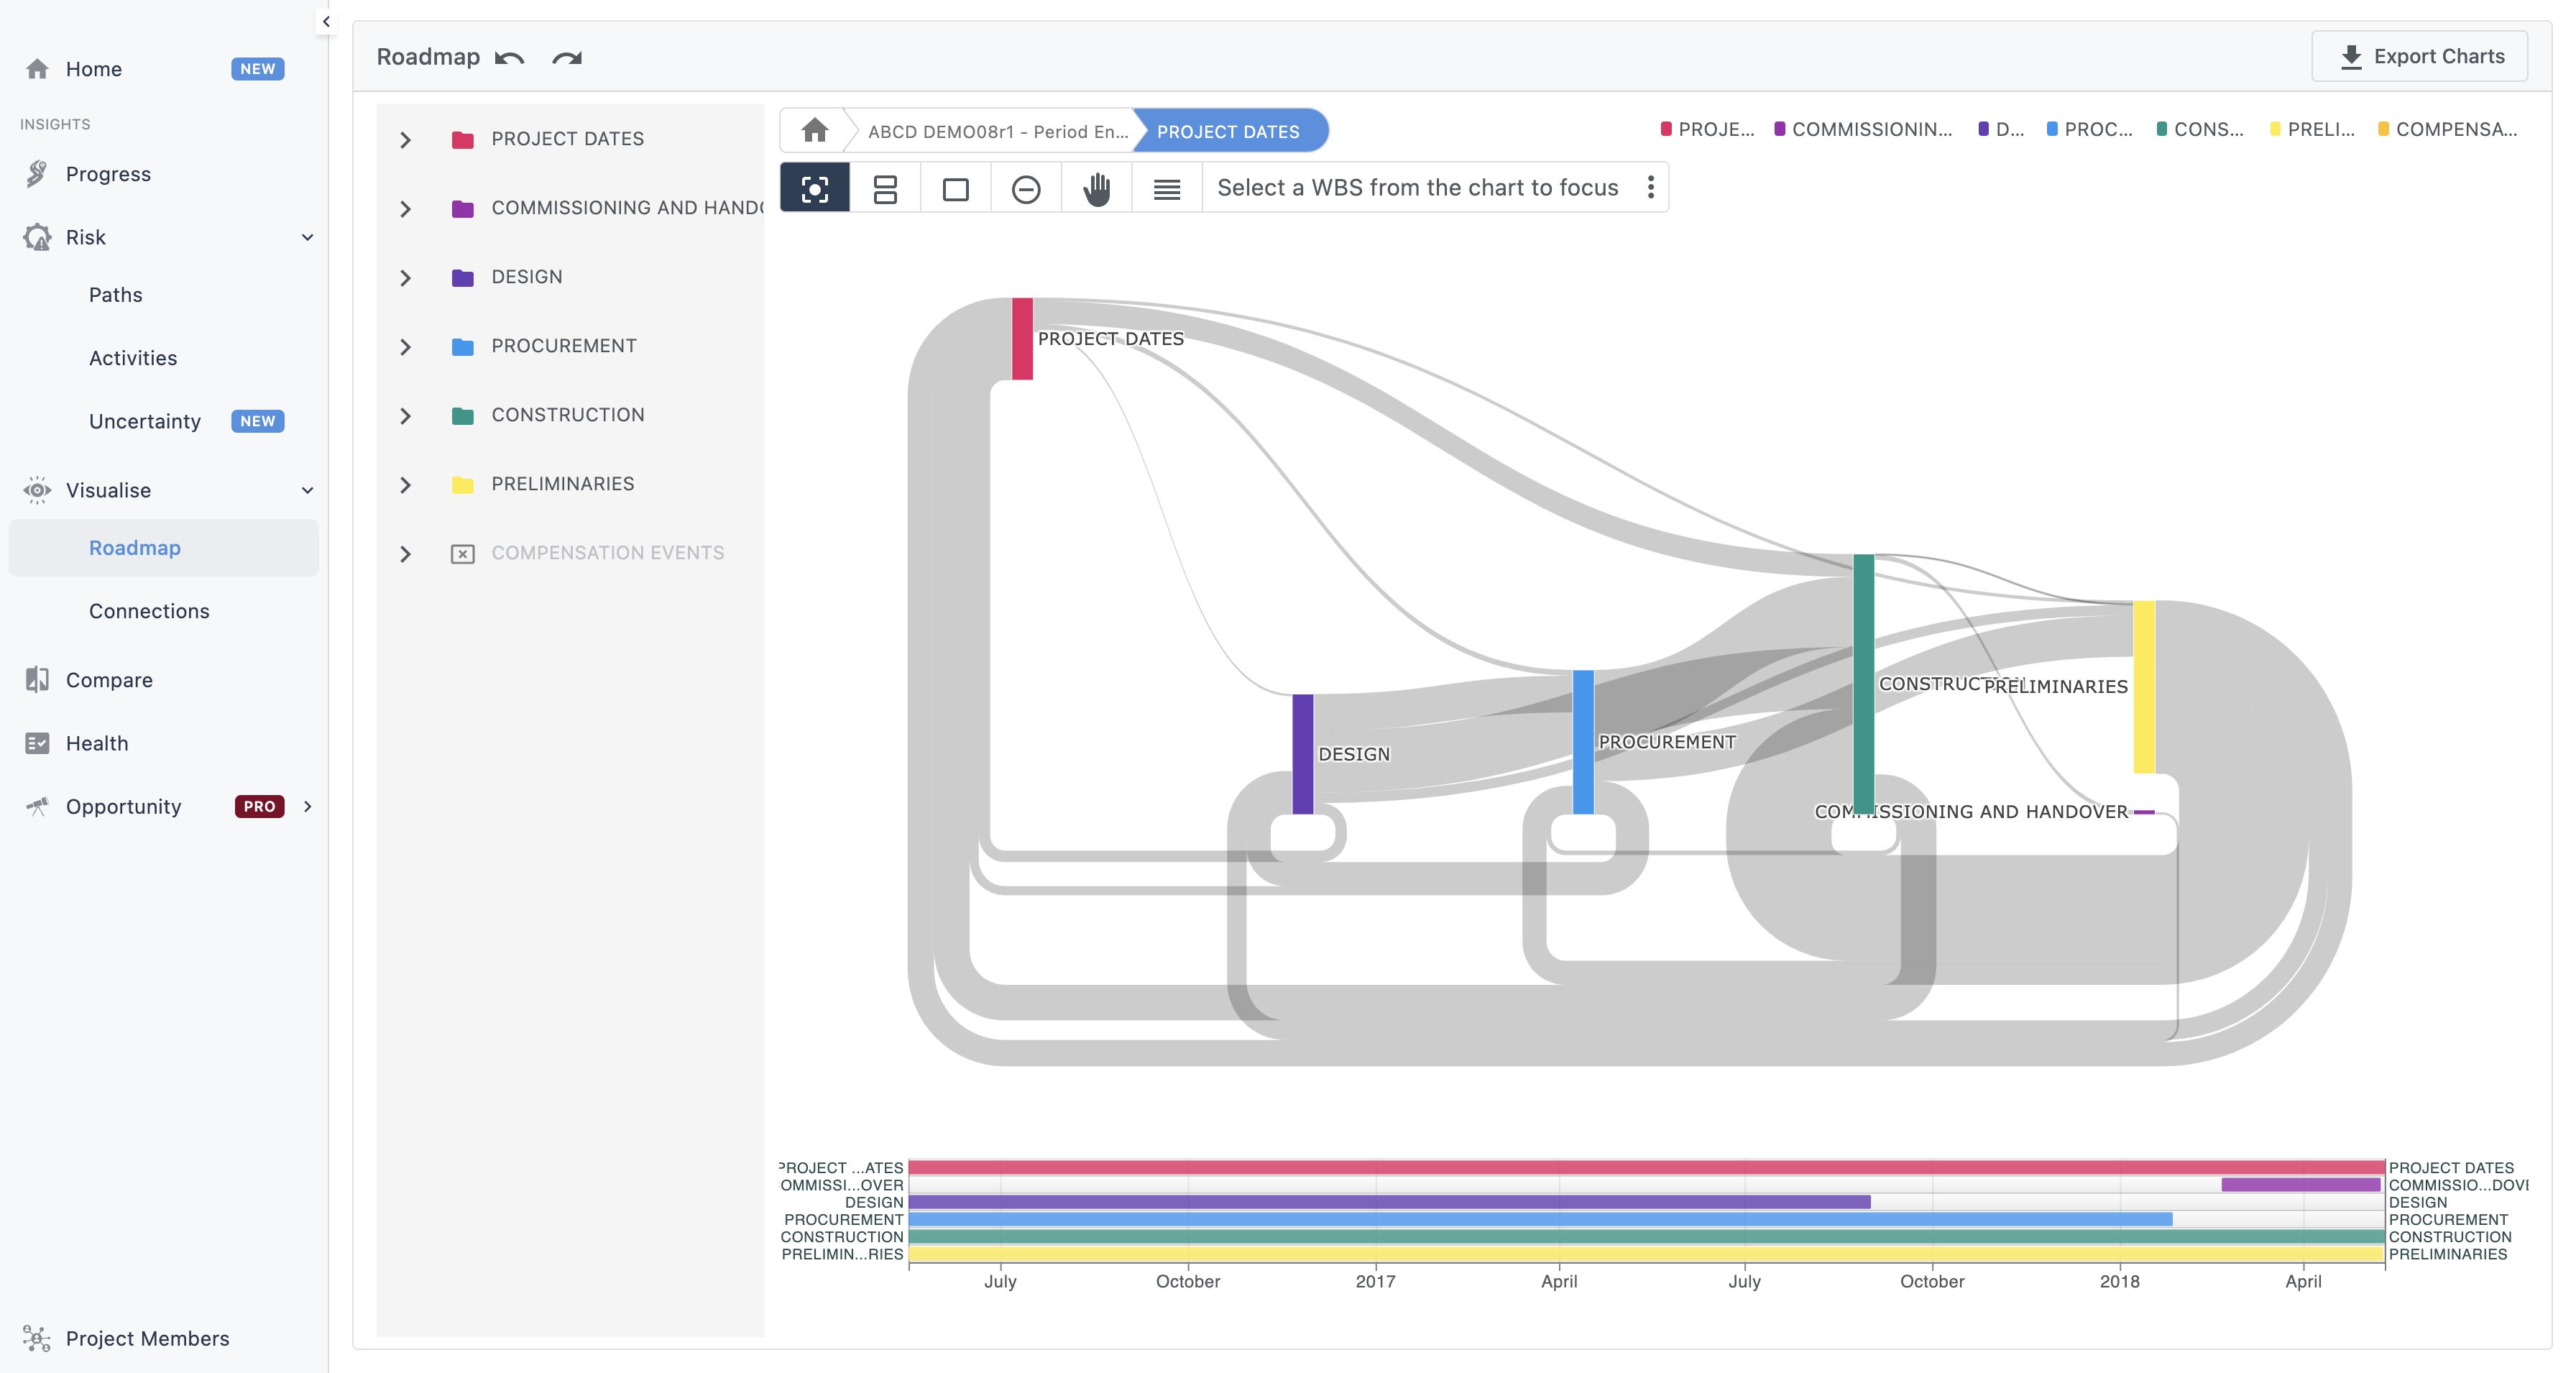
Understanding the visualisation.
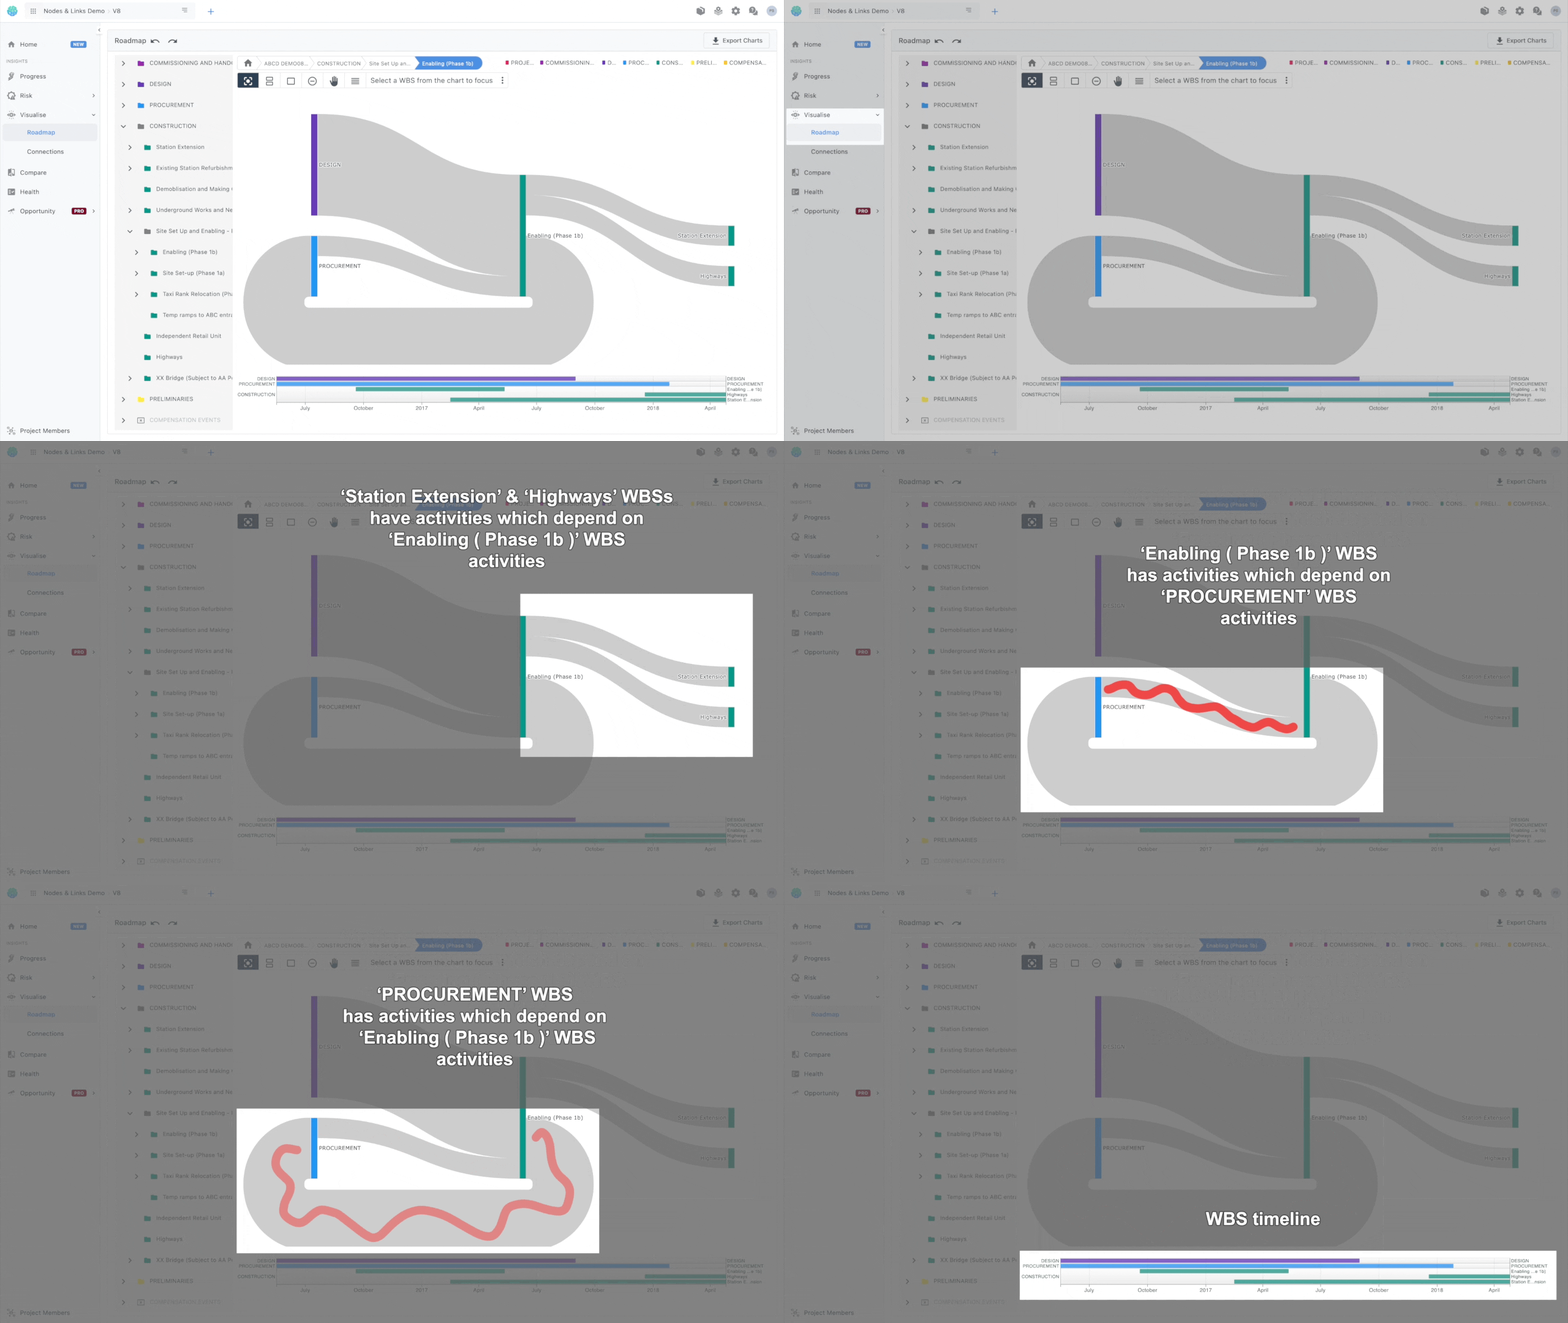
Things are fairly simple here:
- Every coloured vertical line represents a WBS
- Grey lines connecting those WBSs are their activities’ dependencies
- Hovering on a WBS or a dependency line provides additional info
- The timeline at the bottom provides schedule awareness time wise
Drilling down on WBSs.
You can navigate to a certain WBS of interest from the list on the left.
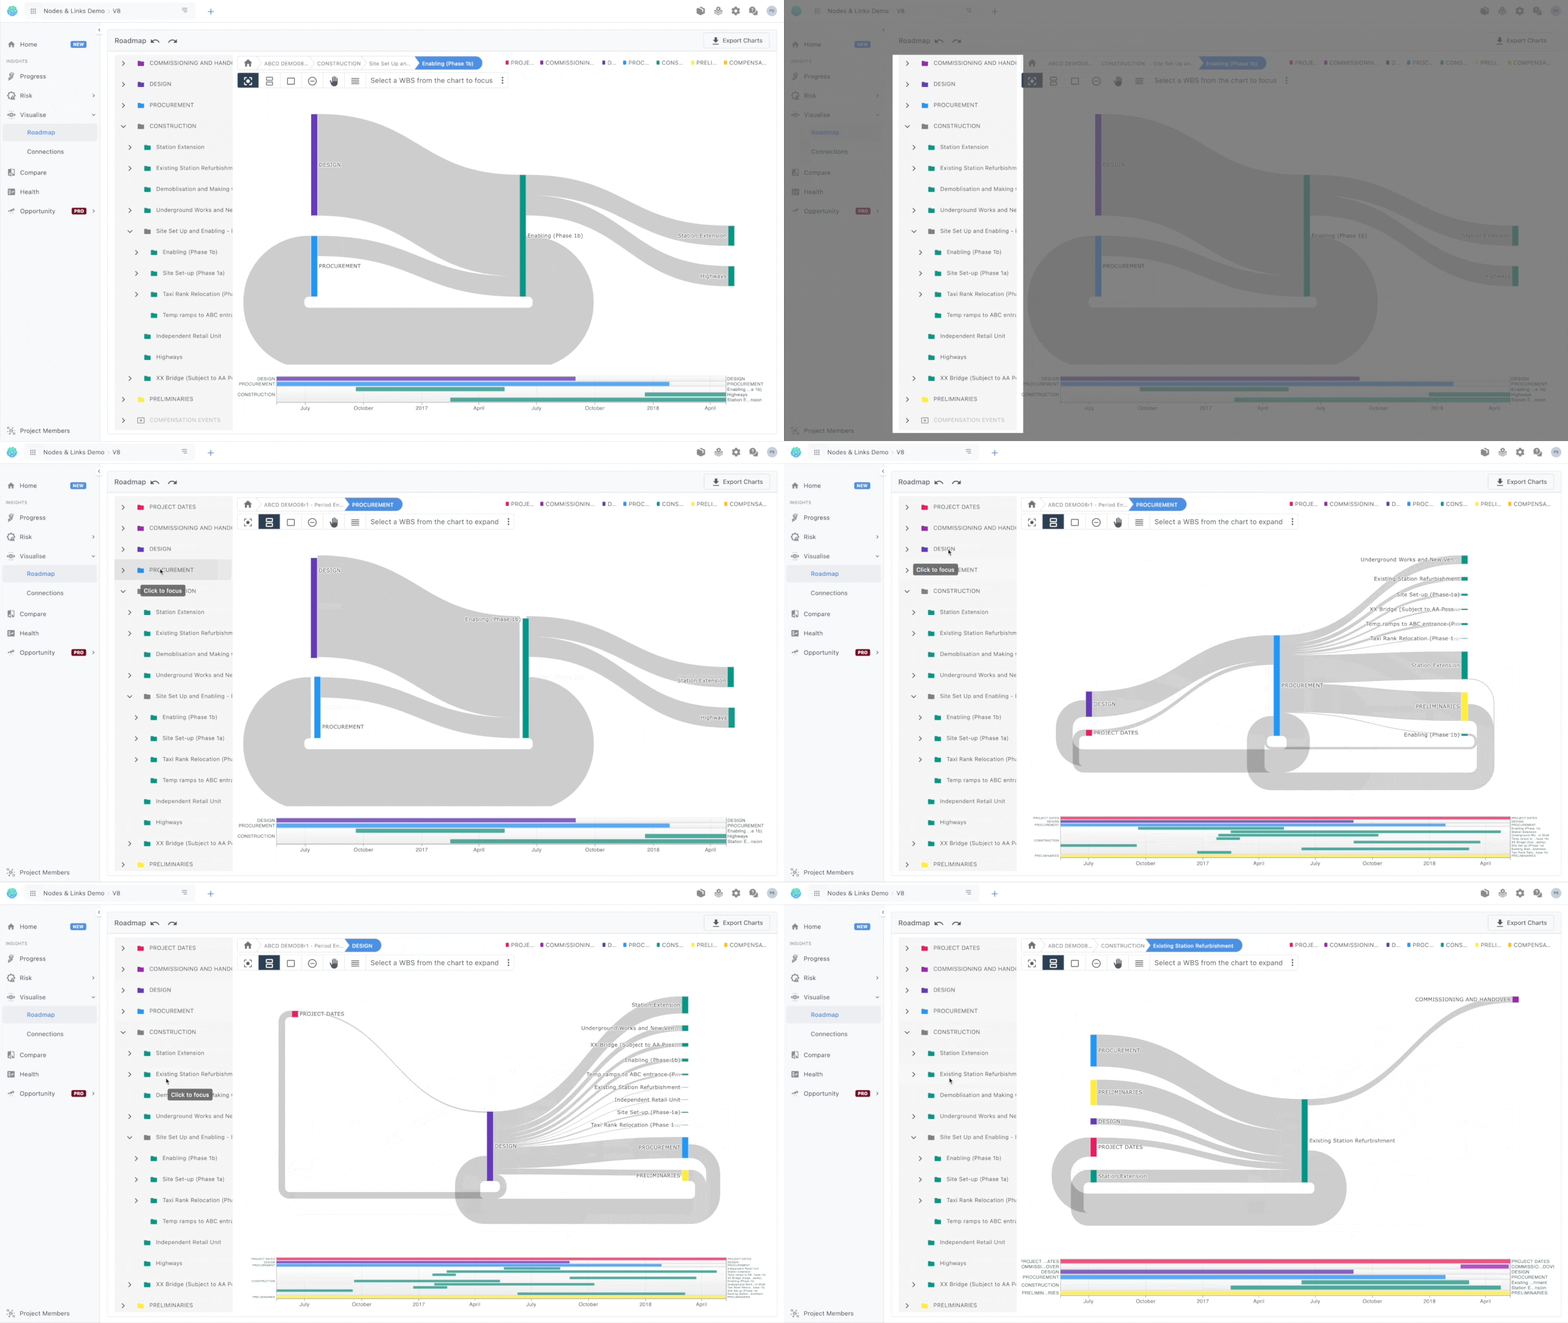
We then have certain navigation actions in place you can take to navigate possible overflow of information. Clicking on an action will change the mouse cursor.
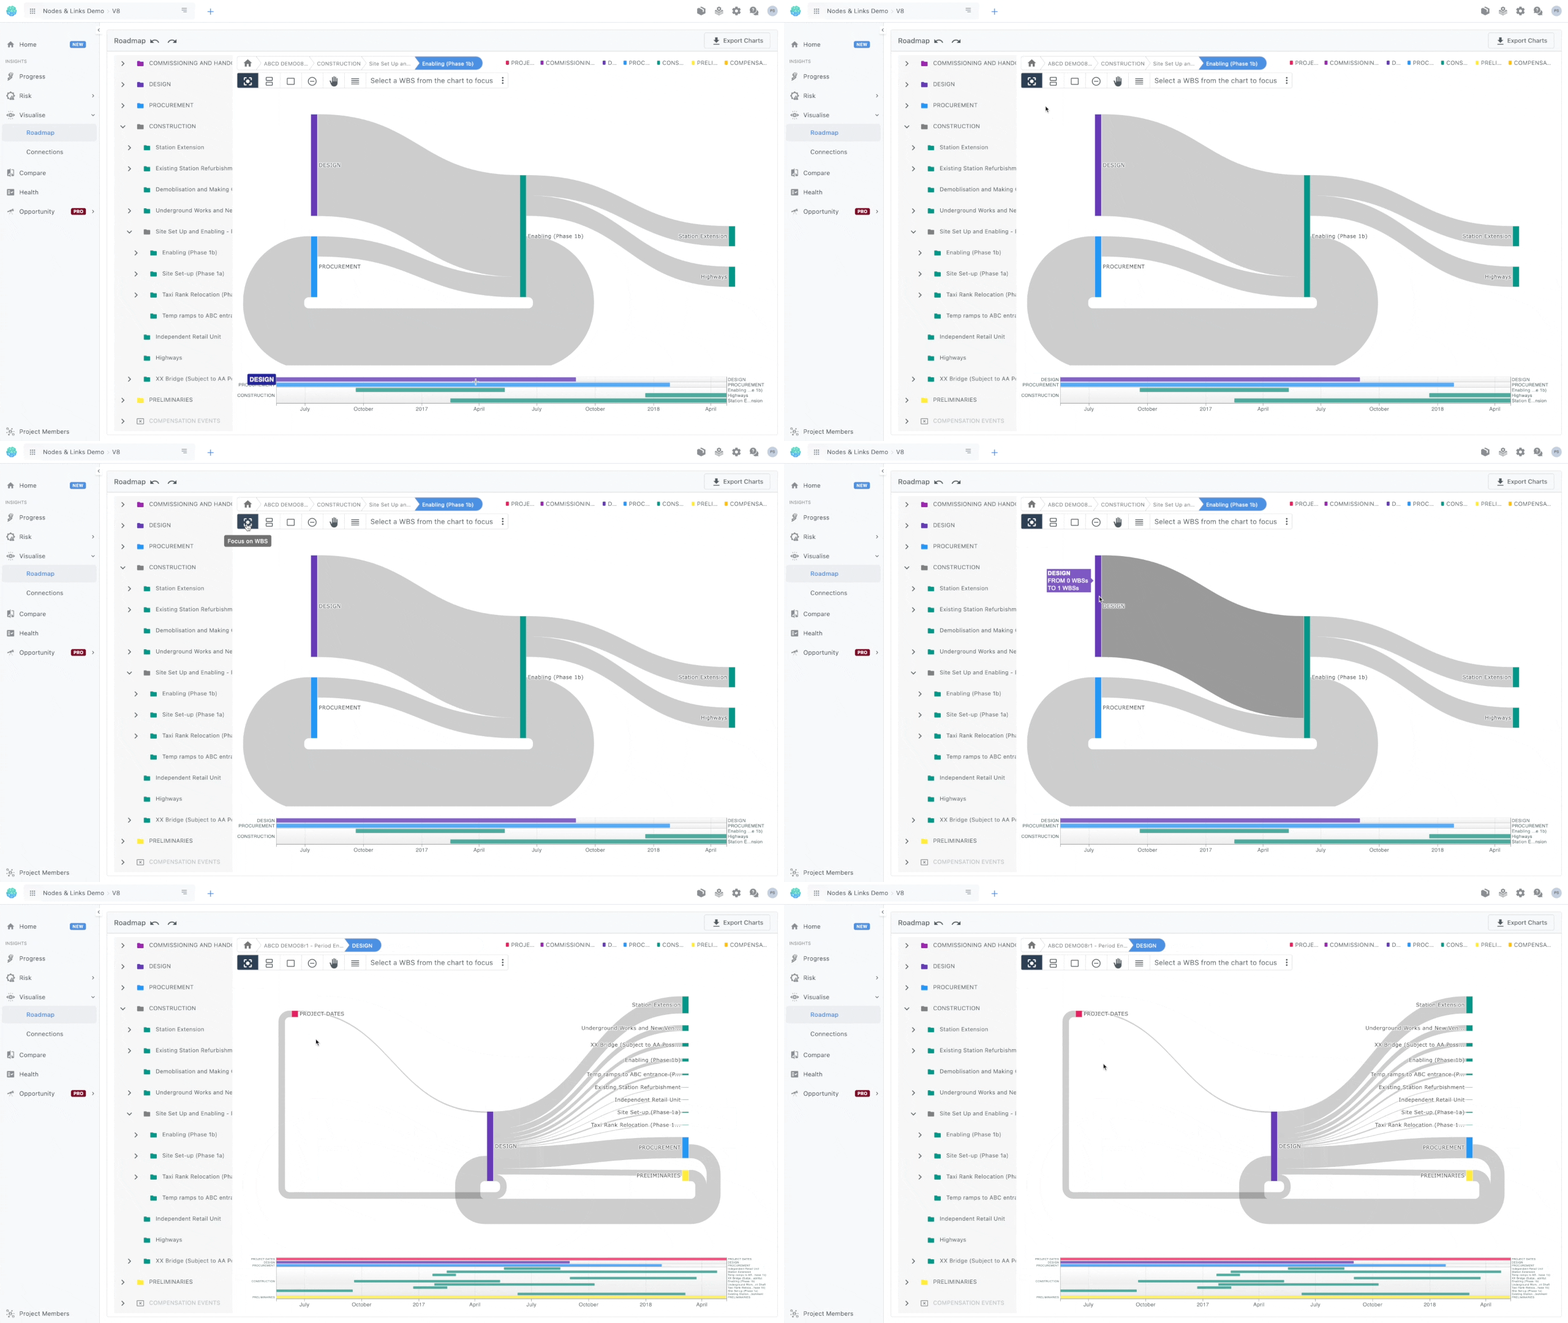
Focusing on a WBS
Make a WBS the focal point of the screen
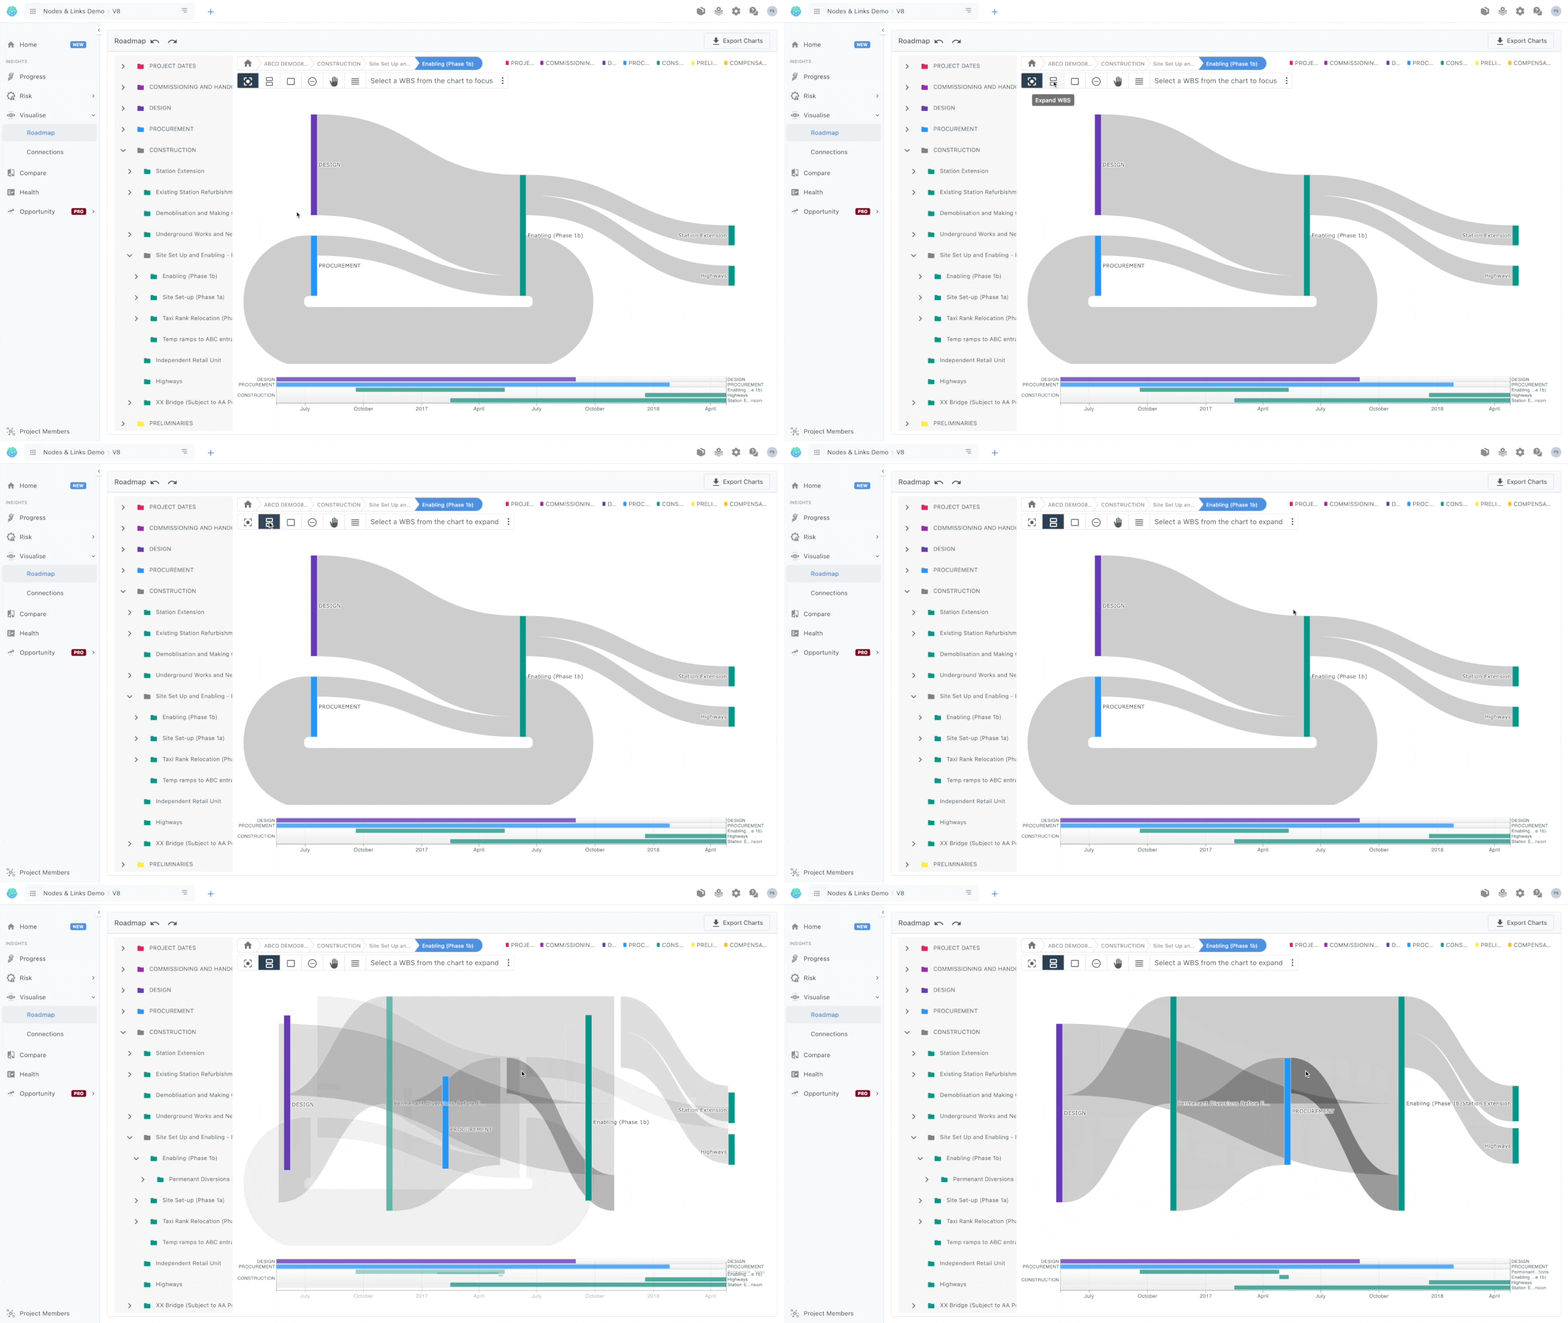
Expanding a WBS
Expand a WBS to its children
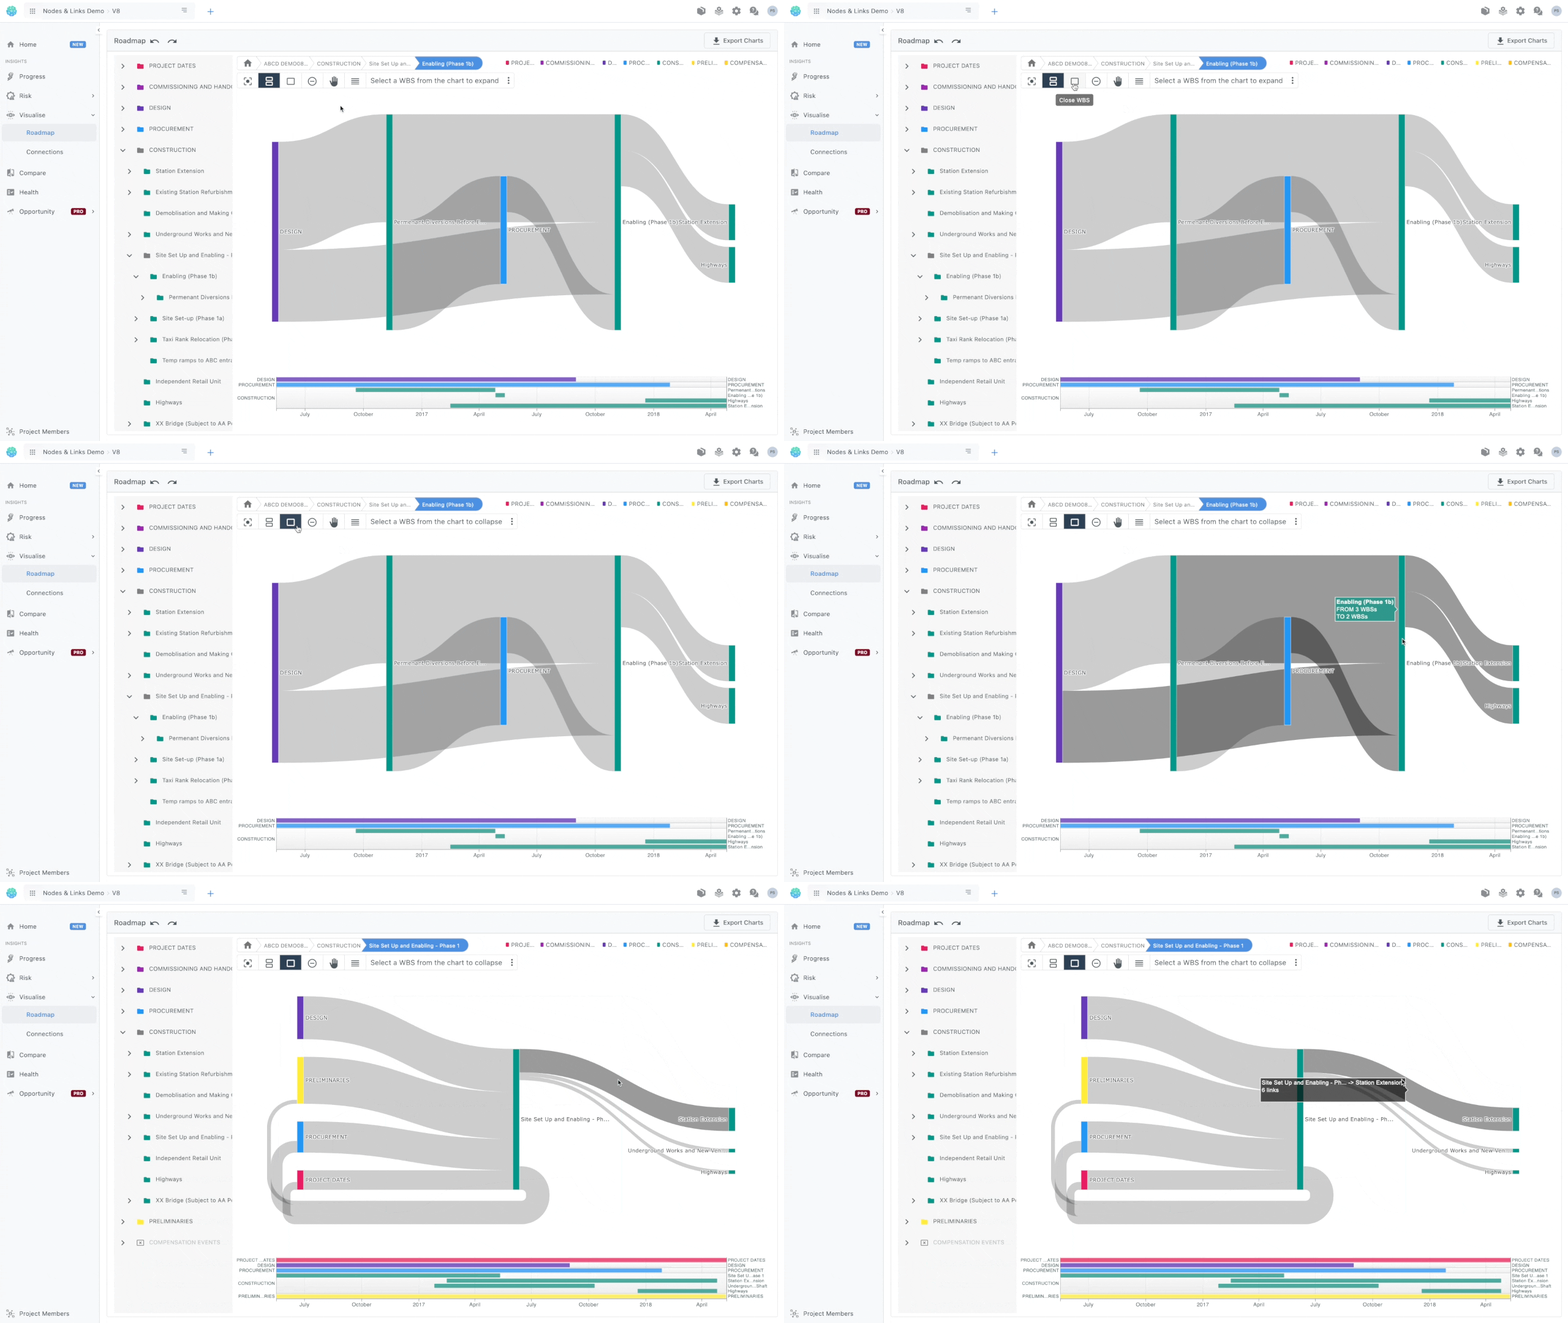
Closing a WBS
Opposite of expand, collapses all WBS children to their parent.
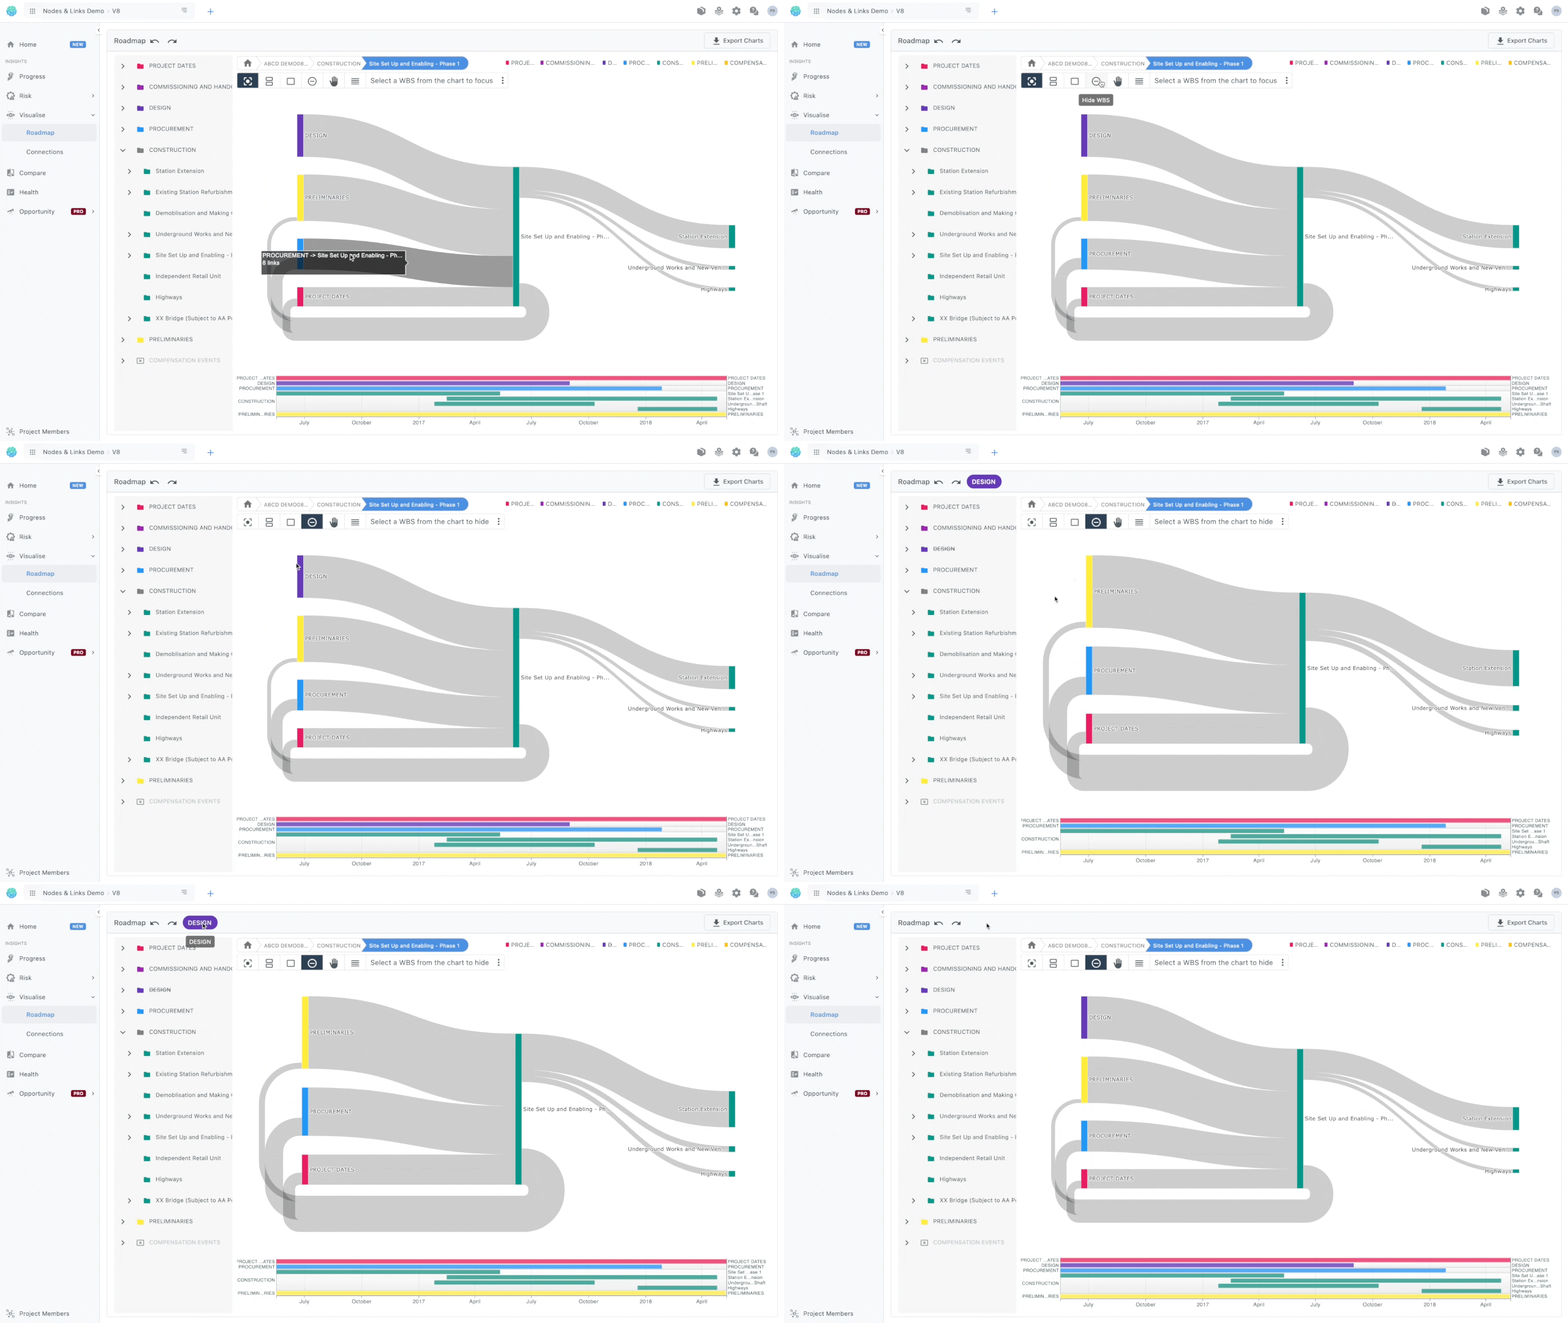
Hiding a WBS
Remove a WBS from the diagram & timeline altogether. When you remove a WBS it will show up at the top of the screen. Clicking on it again will bring it back on screen
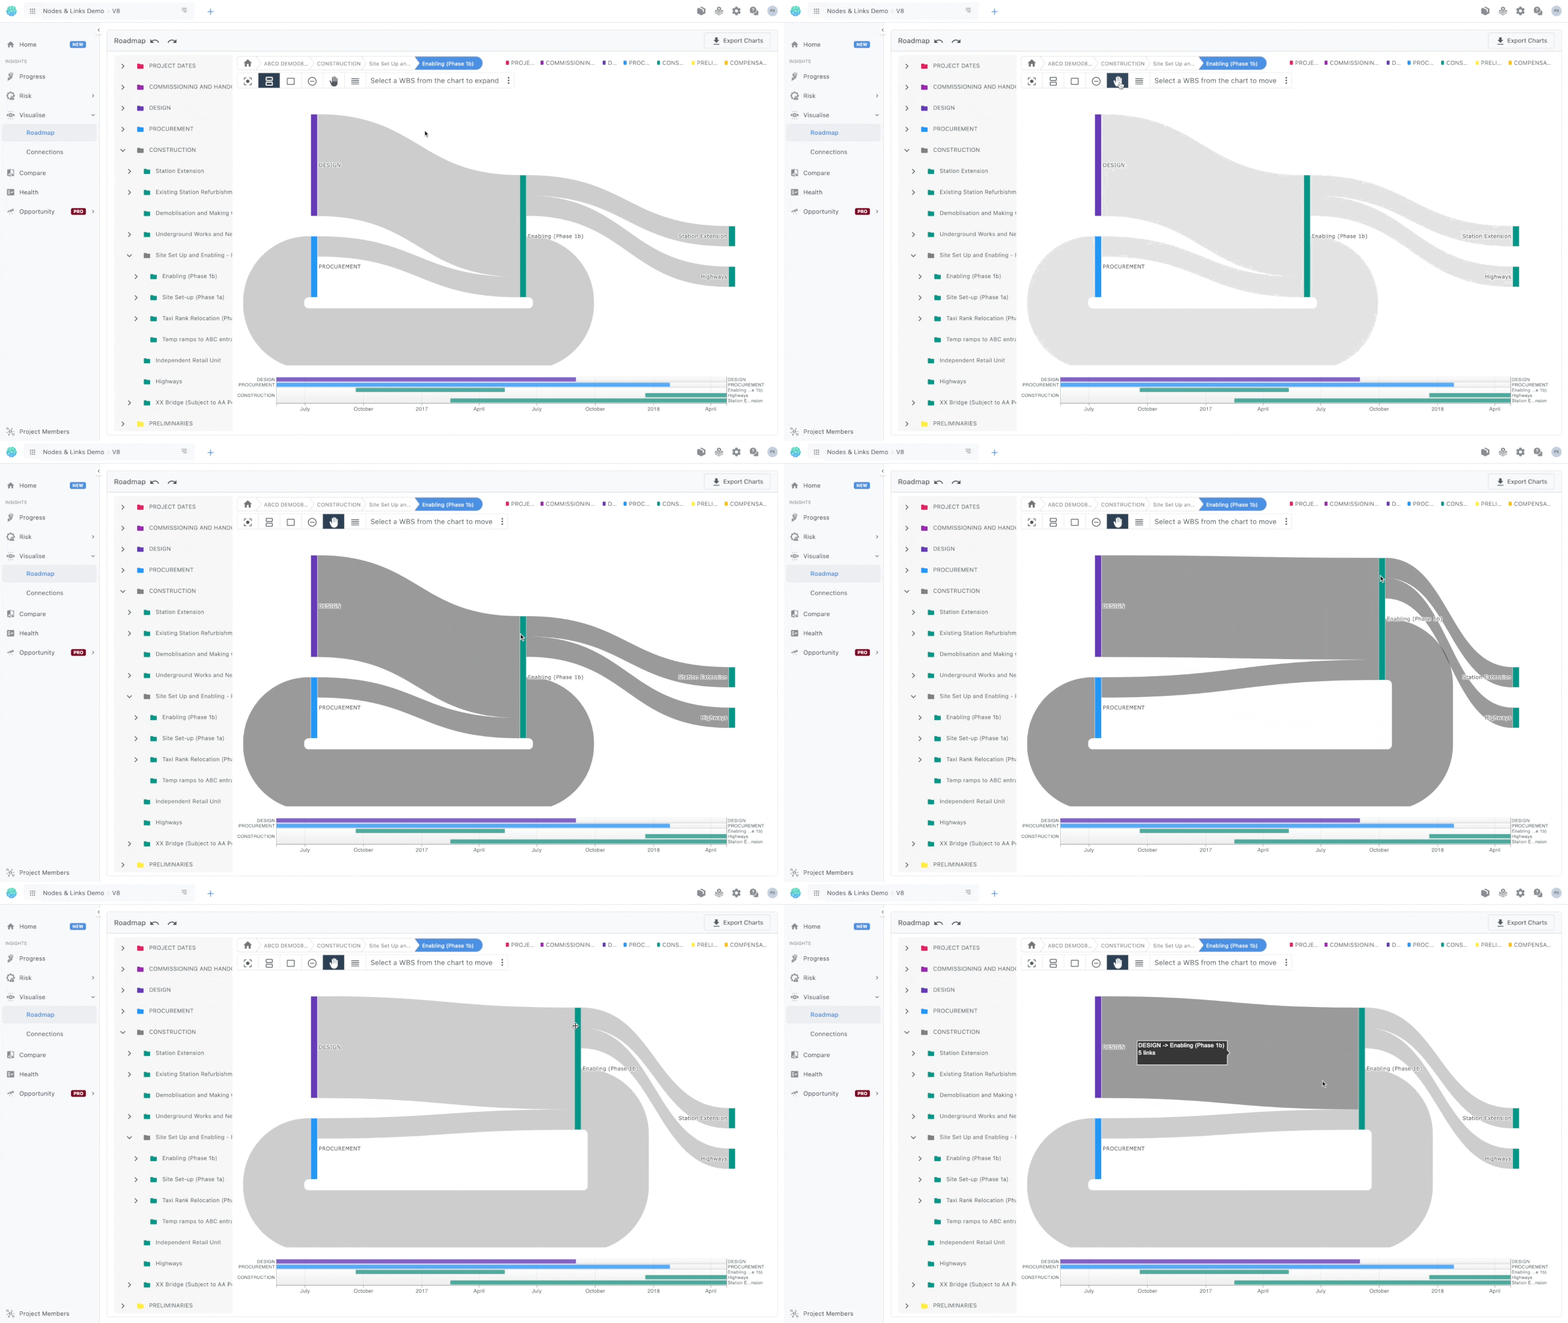
Moving a WBS
Move the WBS around within the screen
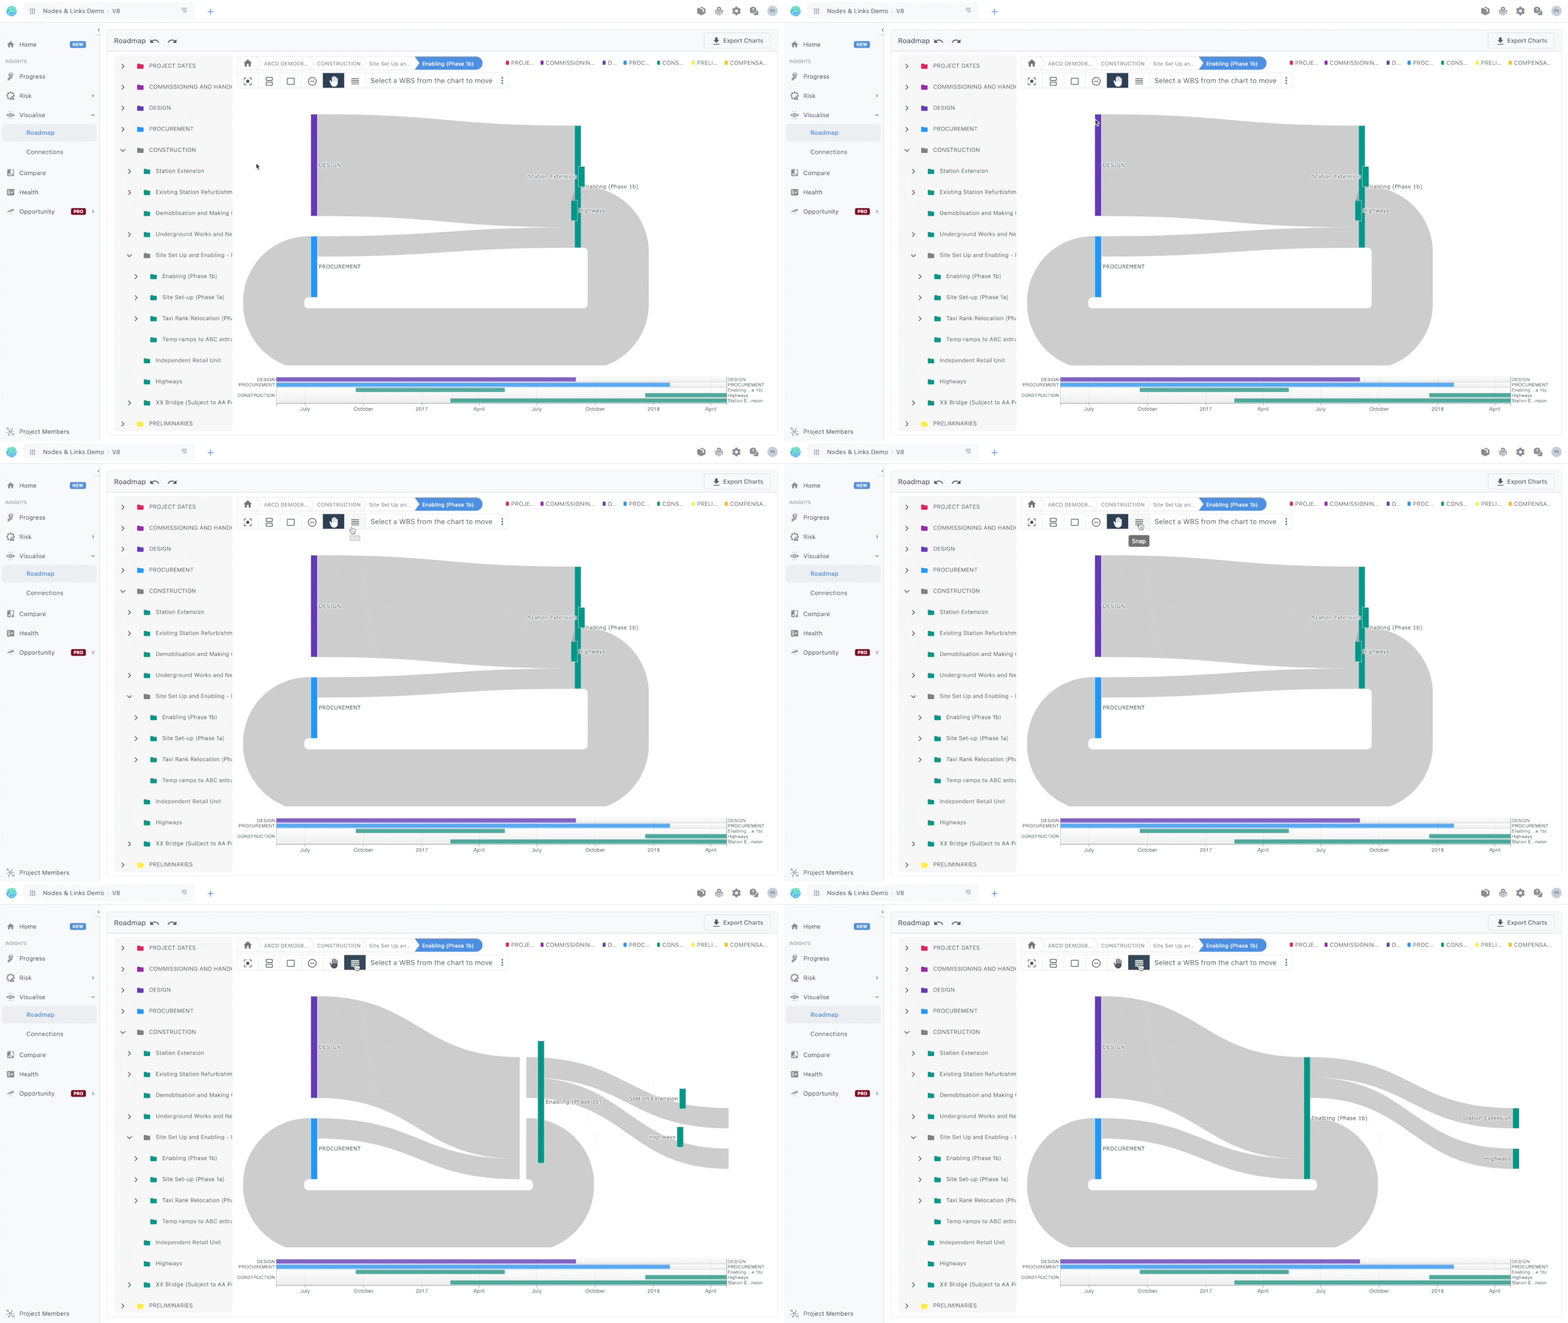
Snap
Snap all WBS in a position that they don't overlap themselves.
Undo, Redo buttons
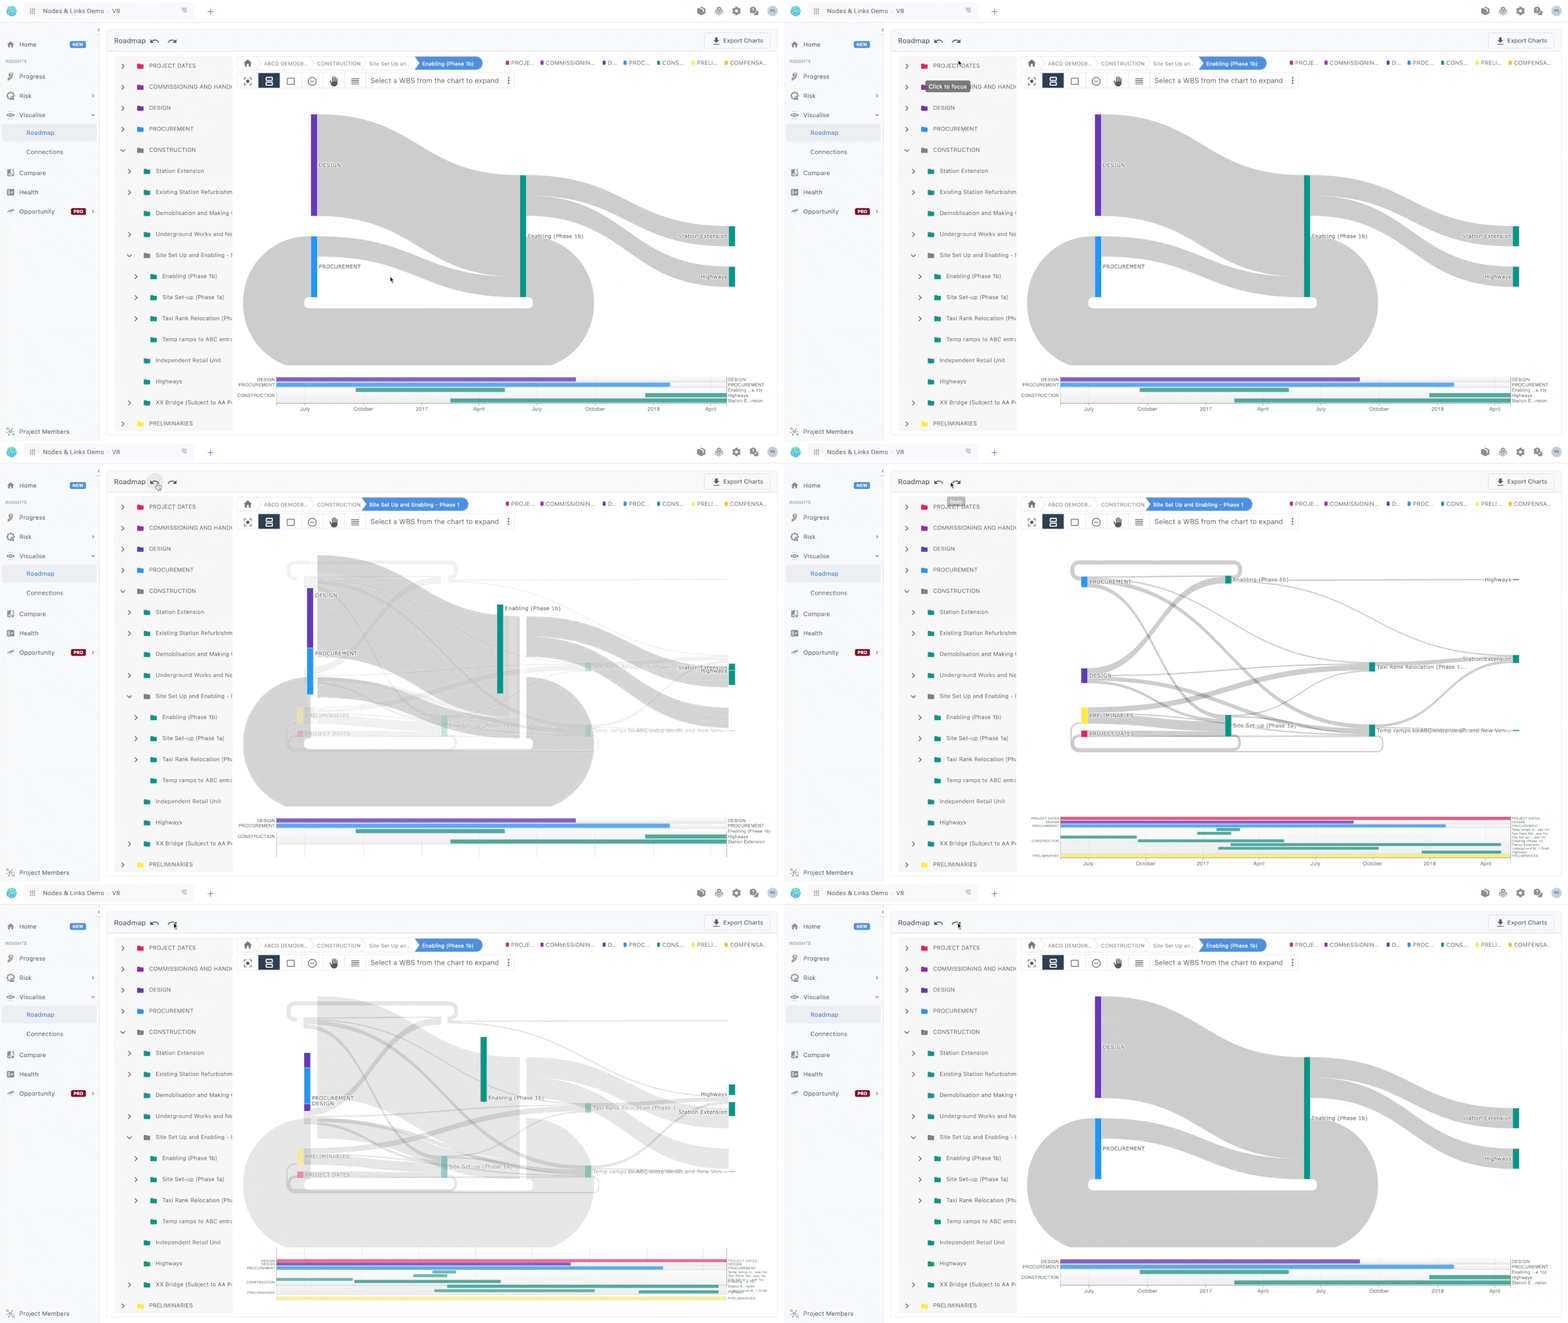
We get that navigating the whole project may be difficult so even if you find yourself somewhere you don't want, you can always go back with the undo and redo buttons.
