AI Reports
At a glance
An AI Report is essentially a collection of smart widgets that you can share with anyone who is already on your project. You can also create private reports for your own workflow and use them as rich notes - no one is able to see those.
We offer two types of reports:
- AI Templated Reports: The AI automatically generates a templated report for you
- Custom Reports: You can create your own reports from scratch.
How to create an AI Templated Report
AI templated reports offer massive time savings by allowing you to automate a repetitive and laborious task. To generate an AI templated report follow these steps:
- Navigate to AI Report
- Choose AI Templates
- Select a Report Category
- Progress
- Risk
- Health
- Change control
- Choose a Report Template
Once the report is generated, you have the option to customize it by adding or removing text, and widgets, to better align with your reporting needs. After finalizing any changes, you can also download the report in PDF format for sharing or future reference.
| Template | Available |
| Progress Overview | Yes ✅ |
| Progress last 30 days | Yes ✅ |
| Progress next 30 days | Yes ✅ |
| Health Overview | Yes ✅ |
| Risk Overview | Yes ✅ |
| Change control | Yes ✅ |
| Project Delays | Coming soon! |
How to create a CustomReport
You can decide to create a custom report from scratch. To do this select “Custom Report”
Meet our widgets
Widgets are the building blocks of every AI Report. There are 2 kinds of widgets:
- Graph widget - these are interactive, and you can use AI to generate their narrative
- Text widget - this is for you to create your own narrative
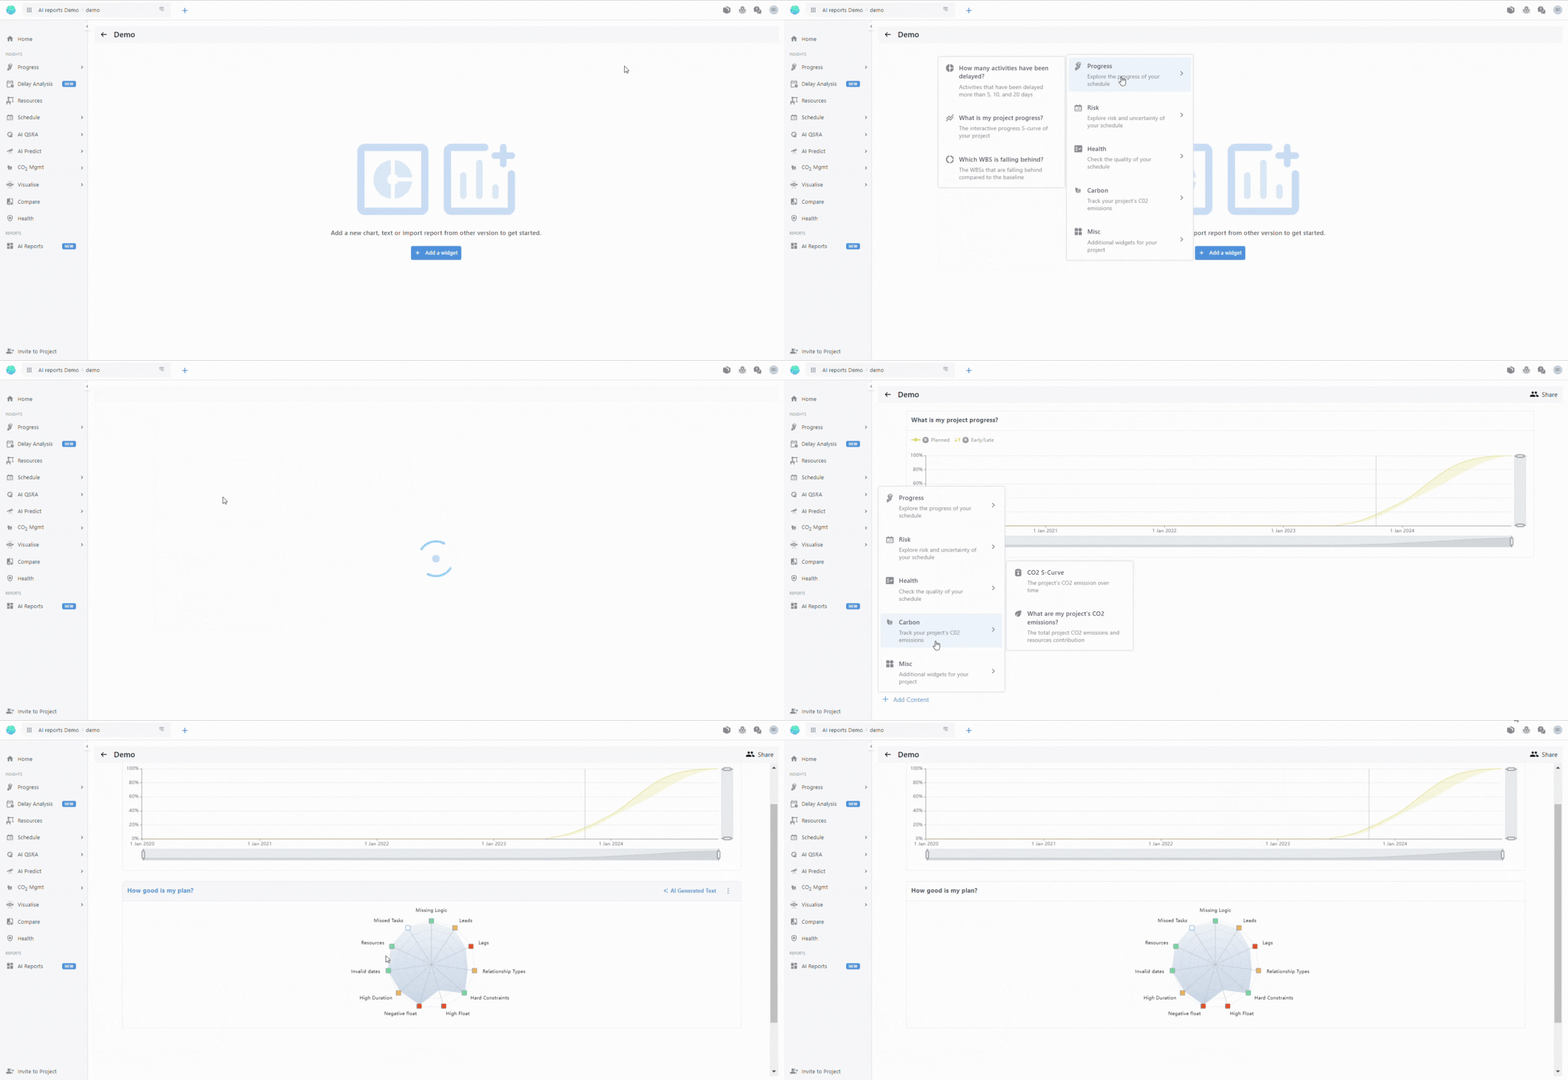
Create your first widget by clicking on the Add widget button. This will open a menu where you can see all the available widgets (we will keep adding new widgets every few weeks!)
Graph Widgets
Graph widgets allow you to add graphs in the report, and use AI to automatically generate their narrative. Every graph widget is interactive and dynamic, and is designed to answer specific questions.
| Theme | Focus | Details | AI-Generated text |
| Progress | What is my progress? | This is the interactive version of your project’s S-curve. You can edit the widget to focus on a specific WBS or ACS by clicking on the 3 dots and selecting Edit. | ✅ |
| How many activities have been delayed? | An interactive donut that shows the number of activities that have been delayed by more than 5, 10, and 20 days. | Coming Soon! | |
| Which WBSs are falling behind? | An interactive donut that shows WBS Level 1, and their delay compared to the set baseline. | ✅ | |
| Trend Analysis | An interactive chart that tracks how the finish dates of the activities you are interested in are changing across updates. | ✅ | |
| Activities Table | A detailed list of the project activities. | ✅ | |
| Schedule Health | How good is my plan? | An overview of the schedule’s health checks (DCMA 14), with the number of activities that fail each check. The widget uses the thresholds set in the main schedule health check page. | ✅ |
| Risk | QSRA Results | An interactive QSRA graph, showing planned completion and your simulated P-Positions. This widget requires you to have run at least one QSRA analysis from the main AI-QSRA screen. | ✅ |
| Carbon | CO2 s-curve | Similar to the progress s-curve, this widget shows how your project’s CO2 emissions accumulate over time. This widget requires your schedule to be resource loaded. | Coming Soon! |
| What are my project CO2 emission? | An overview of the total CO2 footprint of your project, and the various resources that contribute to it. This widget requires your schedule to be resource loaded. | Coming Soon! | |
| Change Control | Project Overview KPIs | Overall Progress, Duration, Compression & Completion Date | ✅ |
Generating AI Text for each widget
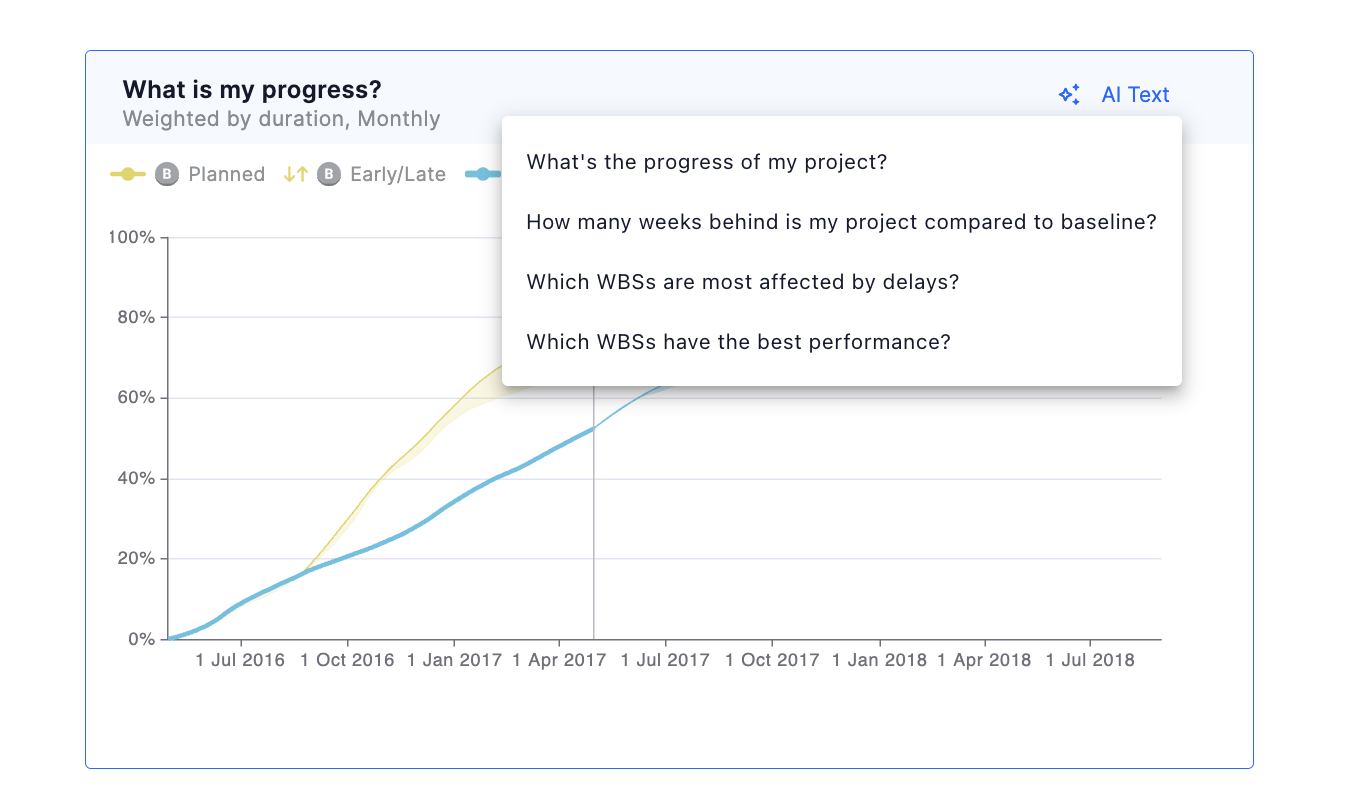
When available, you can use our Generative AI to create text that answers key questions that are available to each widget. In this way, you can tell the story of your project in a fast and data driven way. Once the AI has generated the text, you can further edit it if you want to add more information. Note that our Generative AI is pre-trained, private and secure - your data never leaves the Nodes & Links platform, nor is it used to train future responses.
Text and Header Widget
A widget that allows you to write your own text in the report. You can easily format your text to make your narrative look instantly professional with just a few clicks, everything from headers to bullet points.
You can find the Text and the Header widget widget under Misc.
Working with widgets
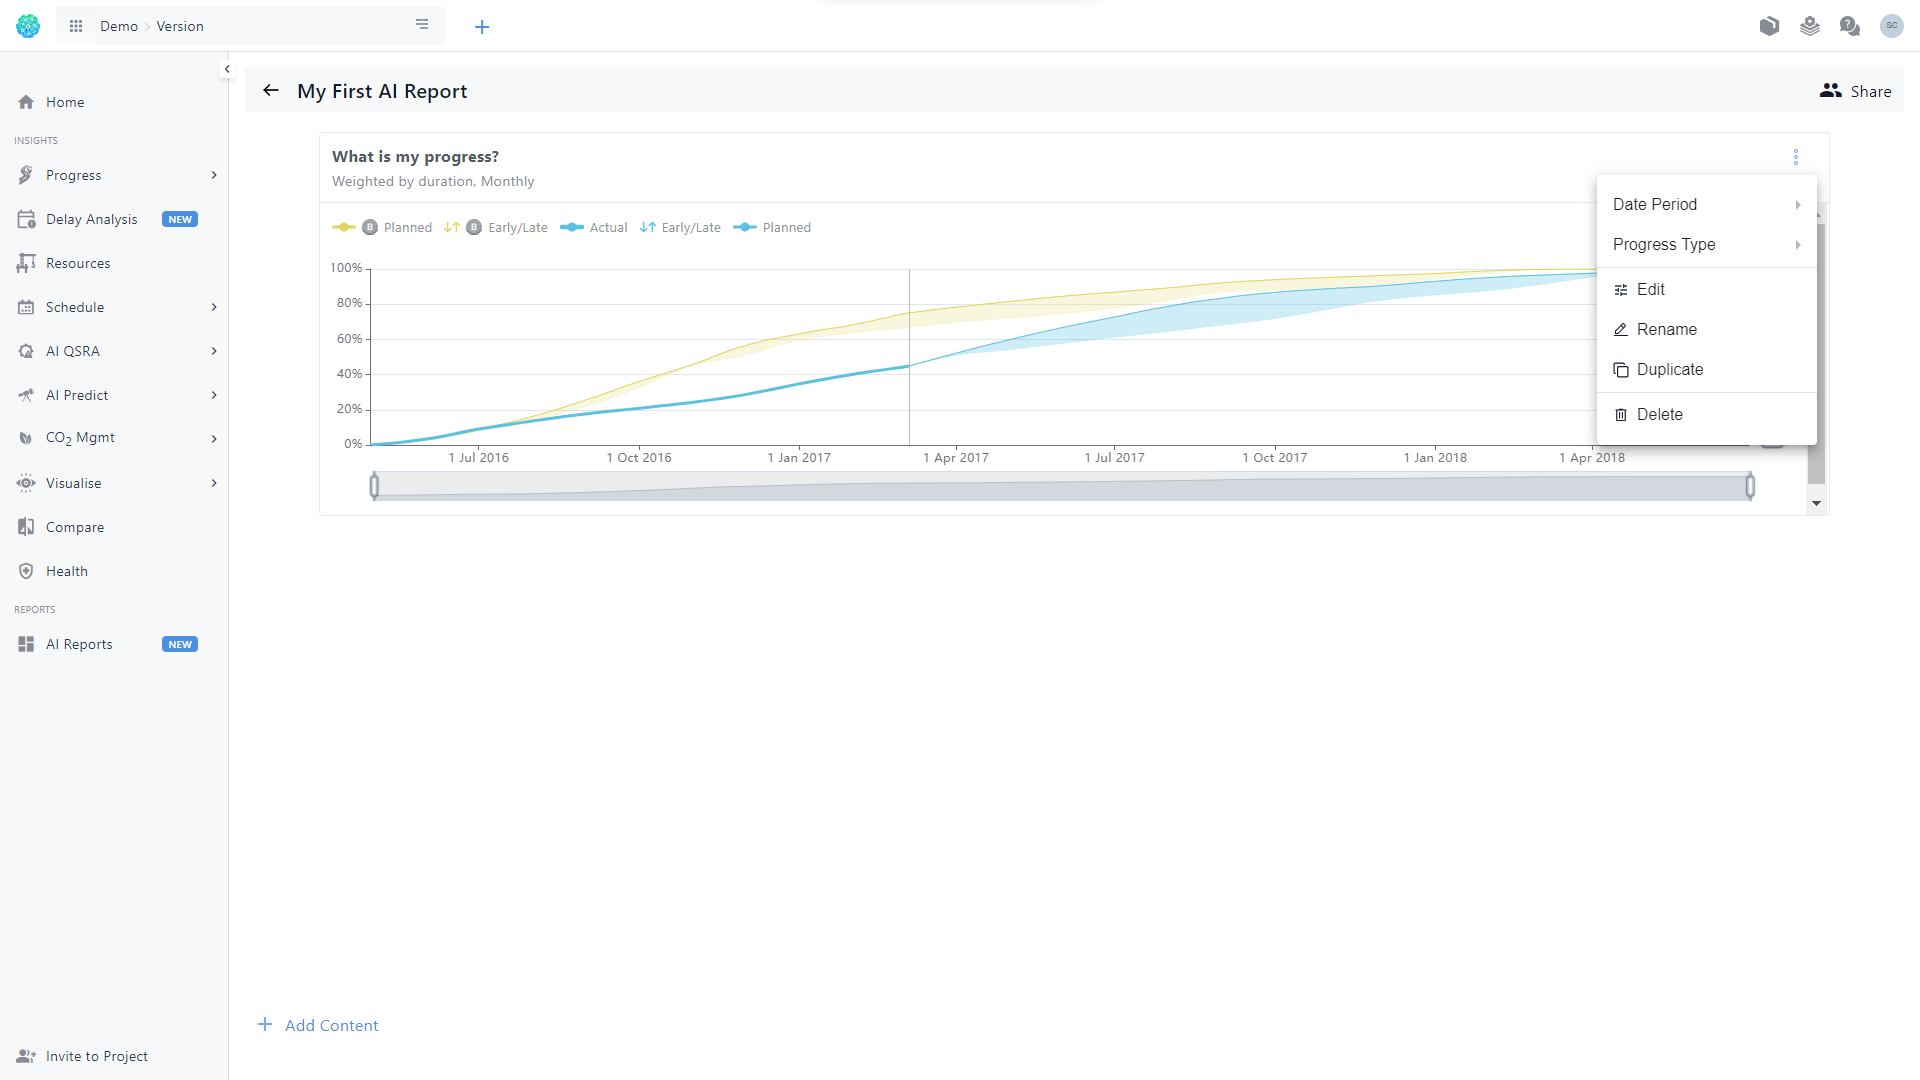
You can make various changes to a widget by clicking on the 3 dots in its right top corner:
- Rename the widget title
- Delete the widget
- Duplicates the widget
You can also move a widget anywhere you want by dragging it and dropping it.
Sharing your AI Report
Your report is by default, not shared (or visible) by anyone - you can use them as your own internal notes.
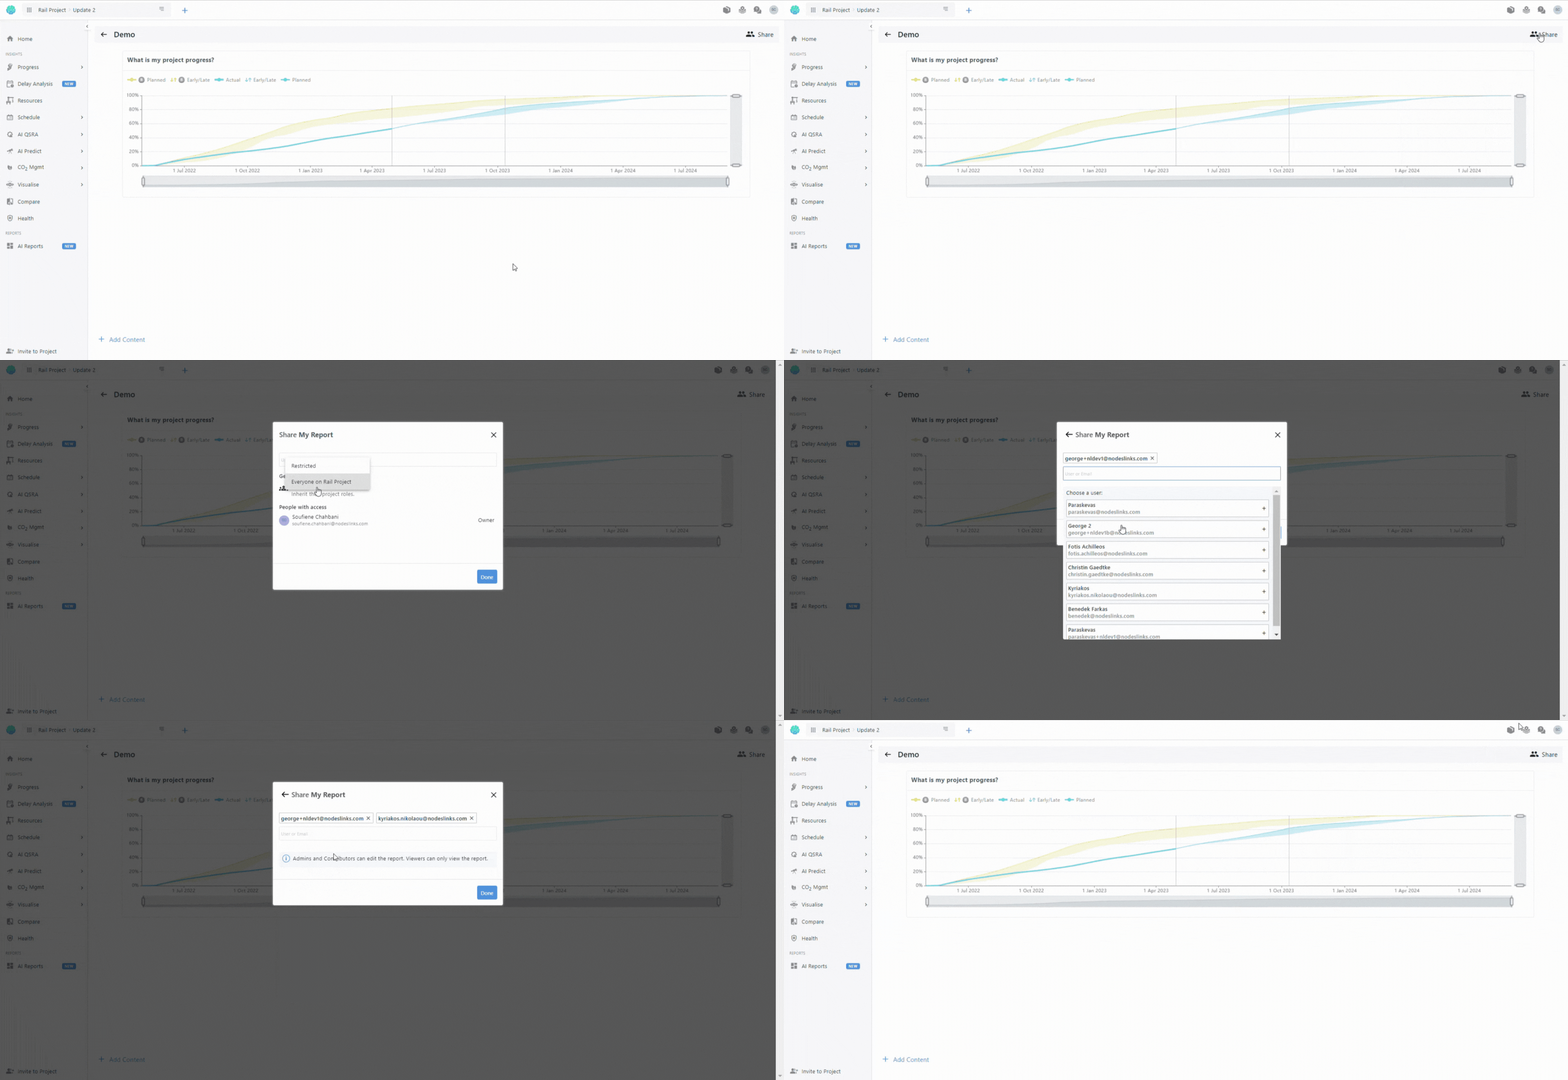
You can share it with anyone in your team who is already on Nodes & Links - simply click Share and add the emails of whom you want to share it. Once shared, everyone will see the same information live, ensuring everyone is working with the same information.
If you are sharing it with someone who is not on your project, by inviting them to view your report, you are also inviting them to your project.
Depending on the platform role they already have, sharing a report with your colleague means that they will either only be able to view it (if their platform role is Viewer) or they will also be able to contribute to it (if their platform role is Contributor or Admin).
Exporting your AI Report
When you click the Export button in the top-right corner of the AI report, you’ll be taken to a preview screen where you can adjust how your report will look before downloading it.
On the right-hand drawer, you can choose a scaling option:
- Normal: keeps the original size
- Fit to Width: adjusts the content to fit the width of the page
- Custom: set your scale by entering a specific number
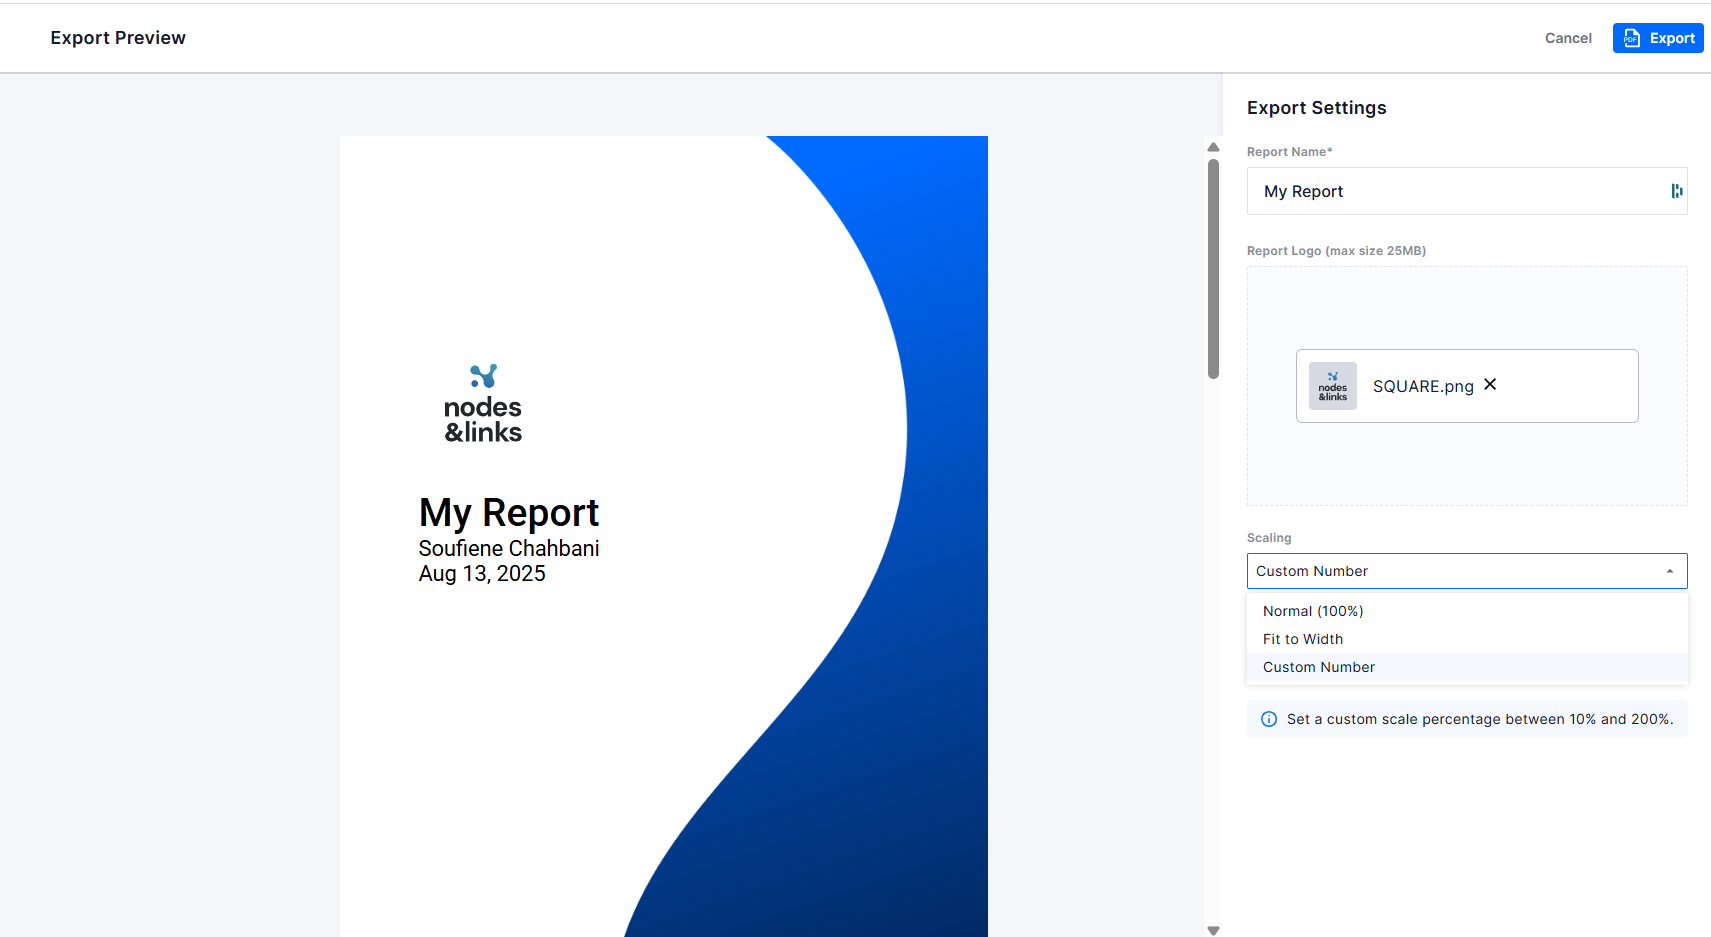
You can add a report name in the Report Name field and upload a logo, both of which will appear on the cover page of your report.
The preview updates instantly as you make changes, allowing you to see exactly how your report will look before exporting. Once you’ve finished making changes, click Export to download your report.
