Timeline
Overview
The Timeline screen allows you to view your schedule in a Gantt chart format easily. It enables you to track progress, understand dependencies, and focus on the critical aspects of your plan, all from a single, interactive view.
The screen allows you to:
- See the Gantt chart of your schedule
- Quickly assess progress across WBS levels and activities
- Spot critical path activities at a glance
- Easily filter your data.
- See the activities relationships
- See an Activity, WBS, or milestone info in one click
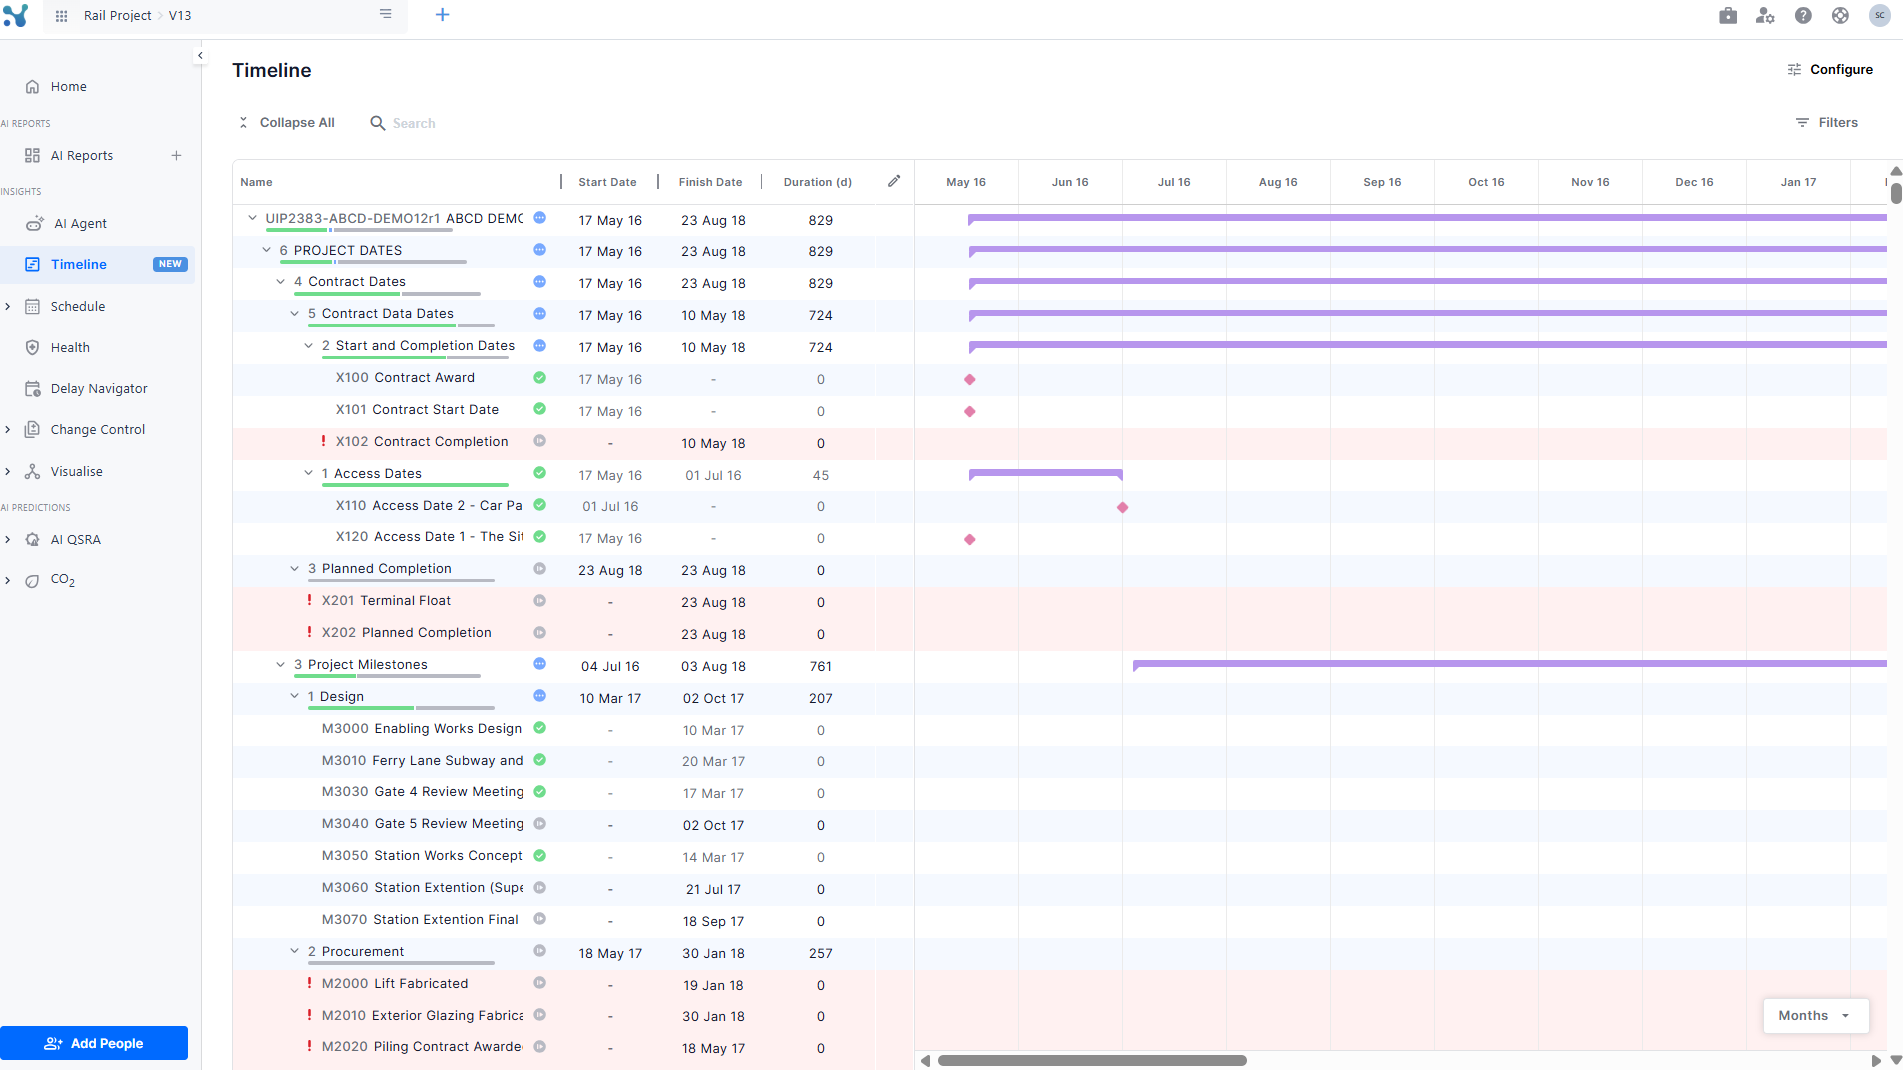
Explaining the screen
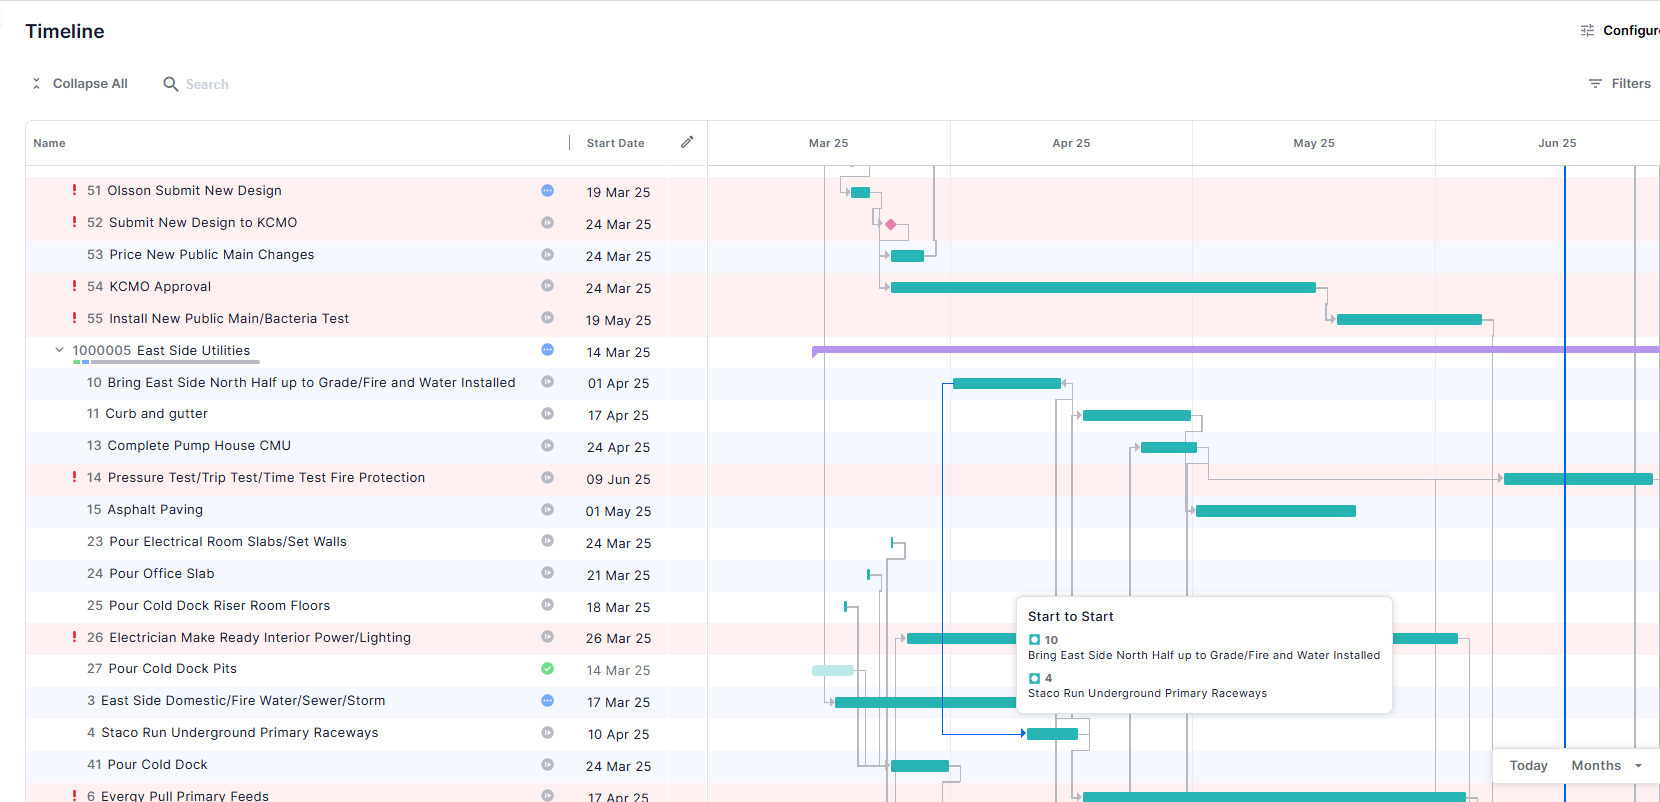
The Timeline screen displays your project schedule with a table and a Gantt timeline. Bars represent WBS and activities, diamonds represent milestones, and dependencies are shown with connecting arrows.
Progress Bars under the WBS
Each WBS row contains a progress bar segmented by activity status colors:
- Green indicates completed activities.
- Blue indicates activities currently in progress.
- Grey indicates activities that have not started yet.
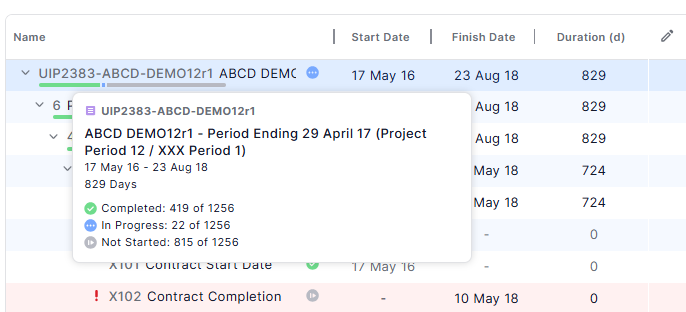
Hover over the progress bar to see counts for each status category. This visual indicator helps you quickly understand progress at a glance for each WBS and its activities.
Spot critical path activities at a glance
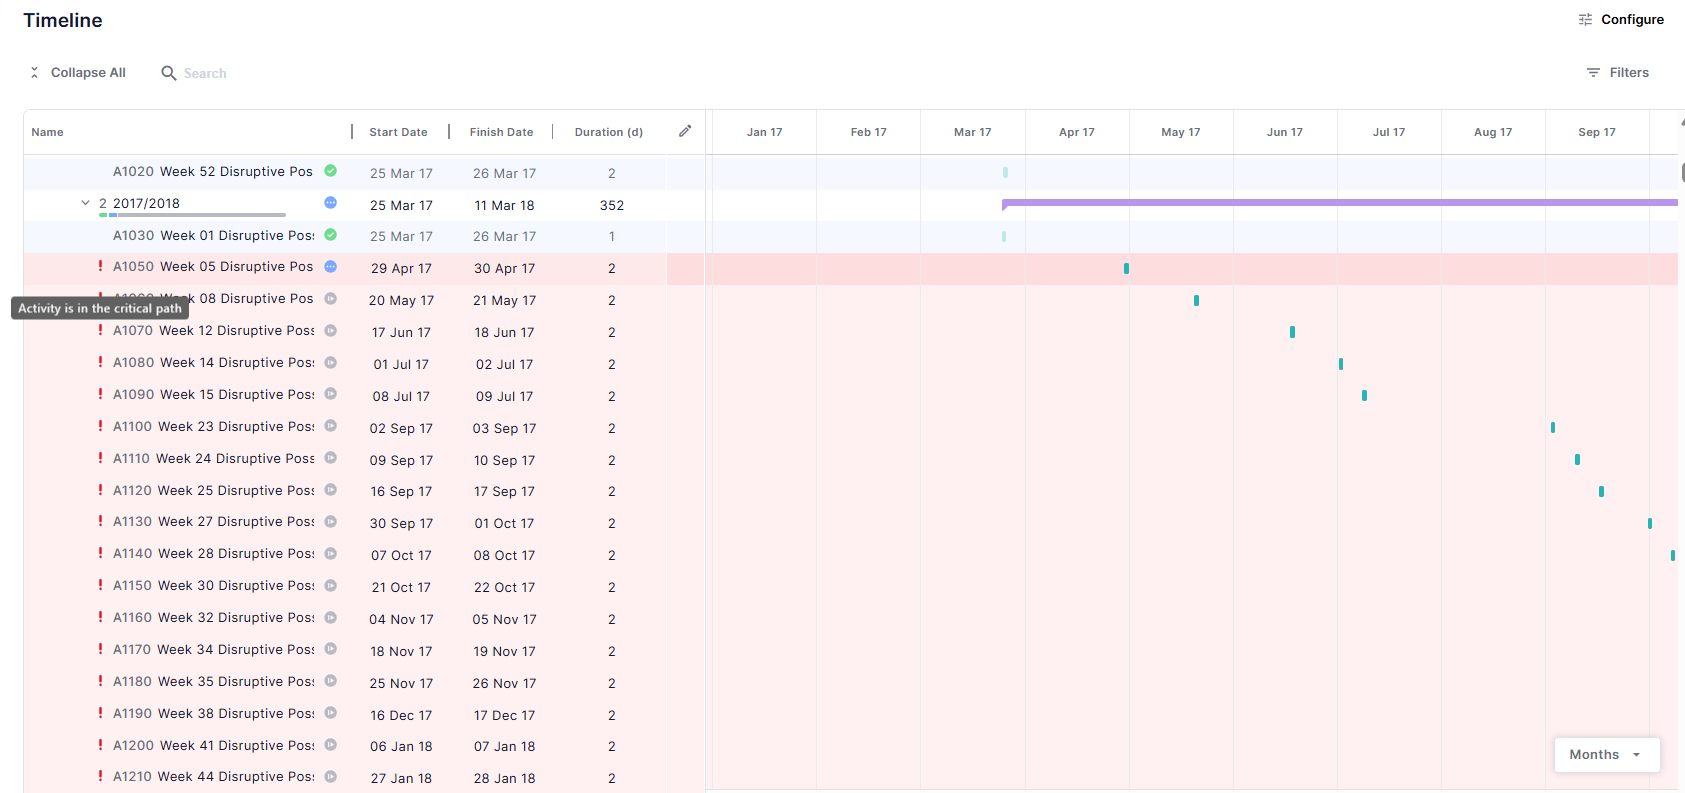
Critical path activities are marked in the table with a red background and an exclamation mark next to their name. This visual cue helps you quickly identify the tasks that directly impact your project’s finish date.
Customize columns
You can tailor the table view to display the information most important to you.
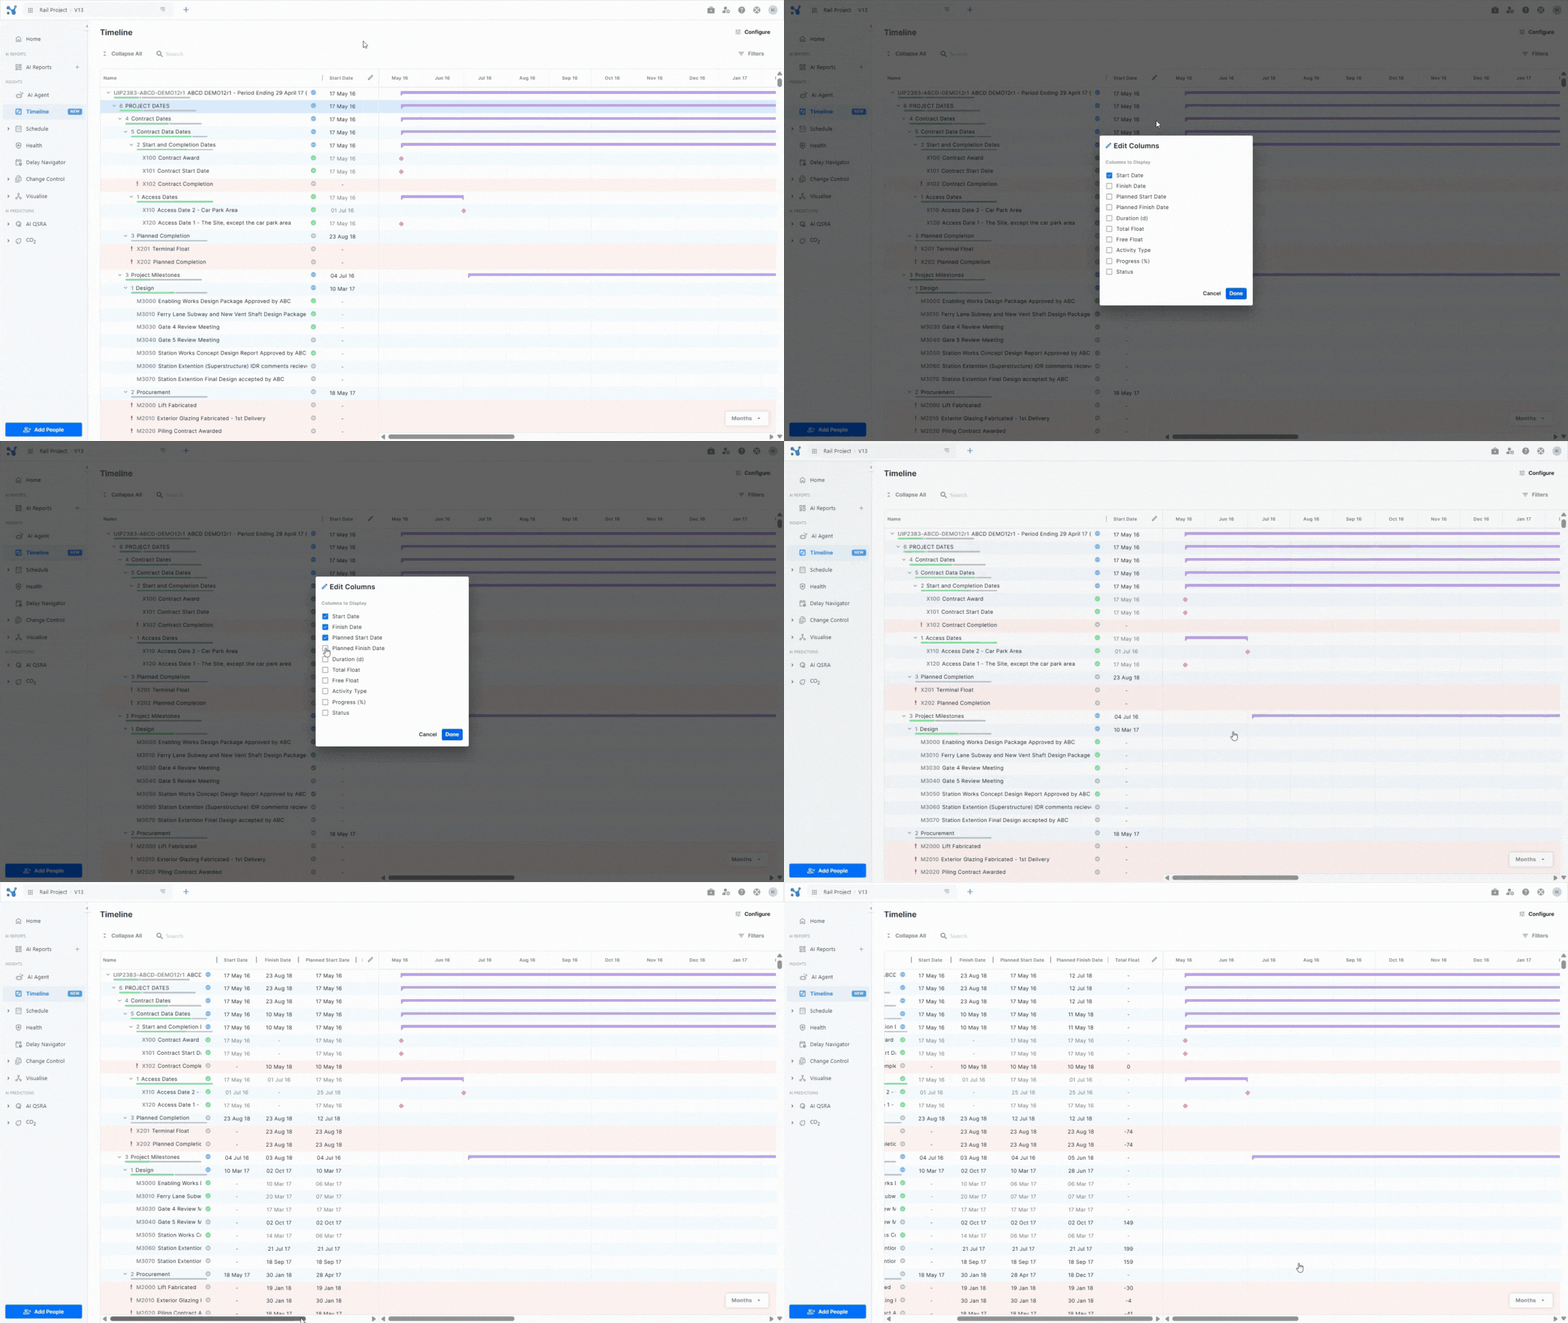
- Click the pencil icon at the top corner of the table to open the column selector.
- From the list, select the columns you want to add, such as progress, free float, planned start and finish dates, total float, activity type, or status.
- To remove columns, simply uncheck them in the selector.
The table will update instantly to show only the columns you selected, helping you focus on the most relevant data.
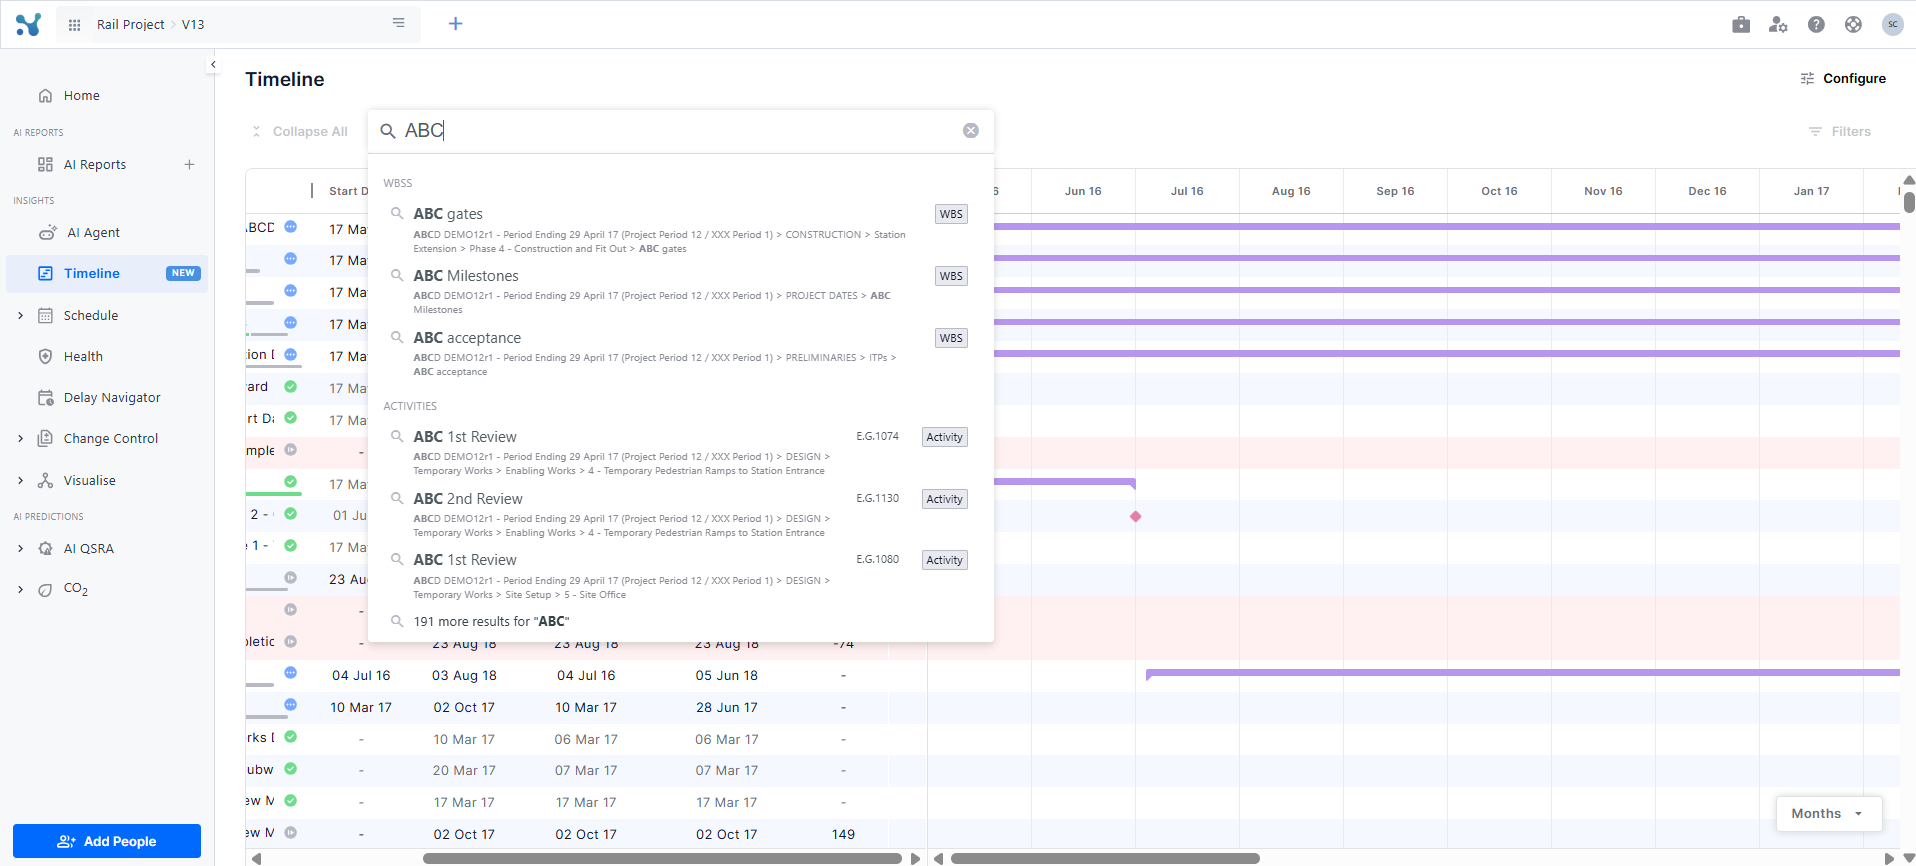
Search activities, WBS, or milestones by name or ID
Use the search bar above the table to quickly find specific activities, WBS elements, or milestones.
Filter activities
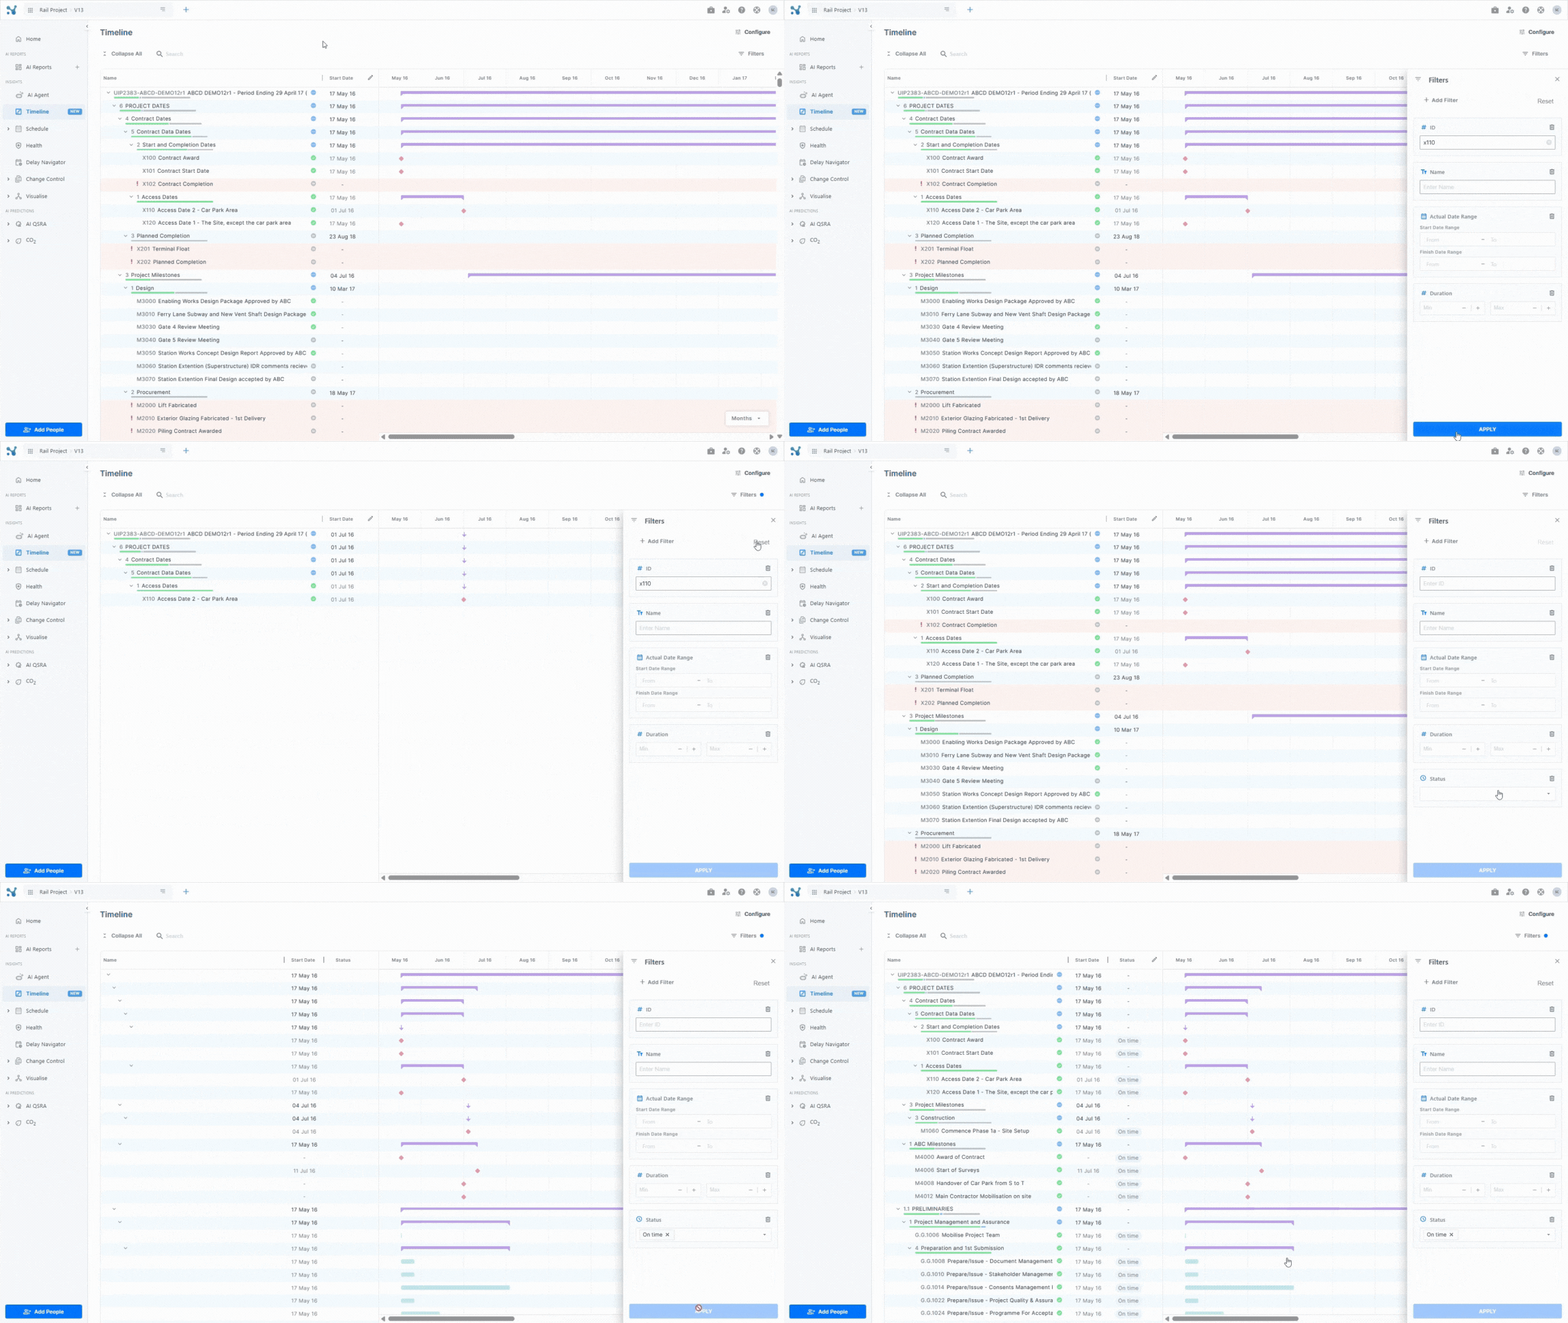
- To open the filters drawer, click the Filters button located above the table.
- Use the filters drawer to refine your view by applying criteria such as:
- ID
- Name
- Start date range
- Finish date range
- Duration
- Total float
- To add more filters, click the Add filter button and select from additional options like:
- Activity type
- Planned dates
- WBS/ACS
- Free float
- Status
- Progress
The table updates dynamically to display only rows matching your selected filters.
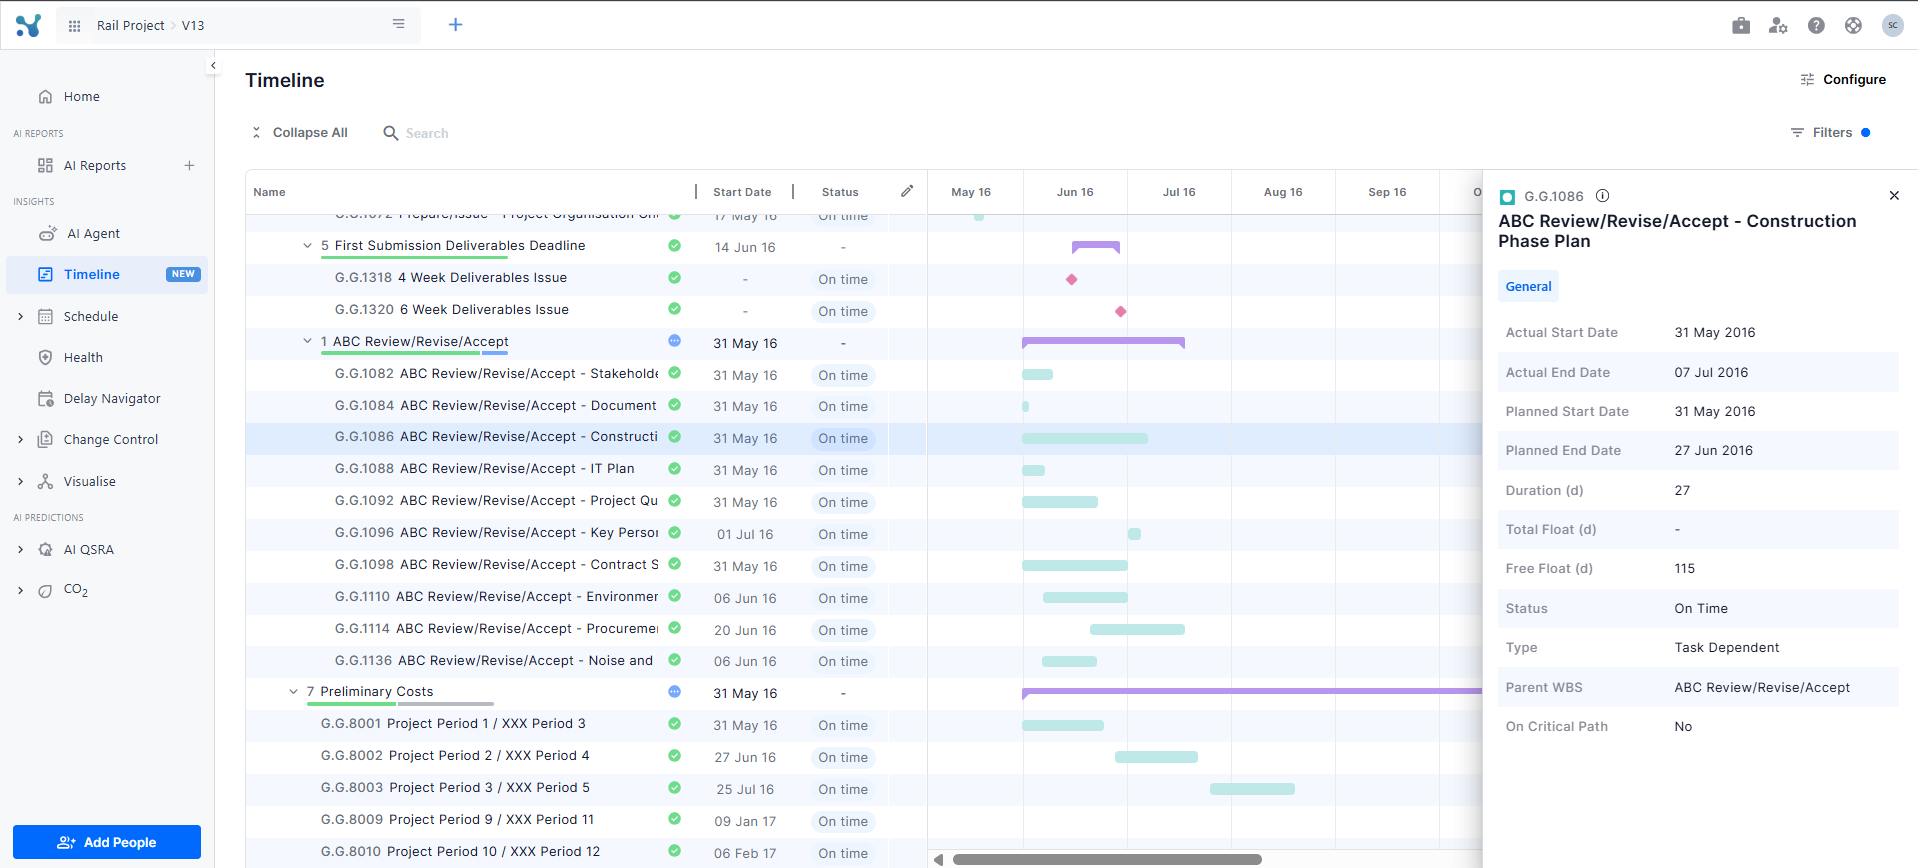
See activity info
- Click on any activity bar, WBS bar, or milestone diamond in the timeline or the corresponding row in the table.
- A drawer will open on the right side of the screen, displaying detailed information such as start and finish dates, duration, type, and critical path status.
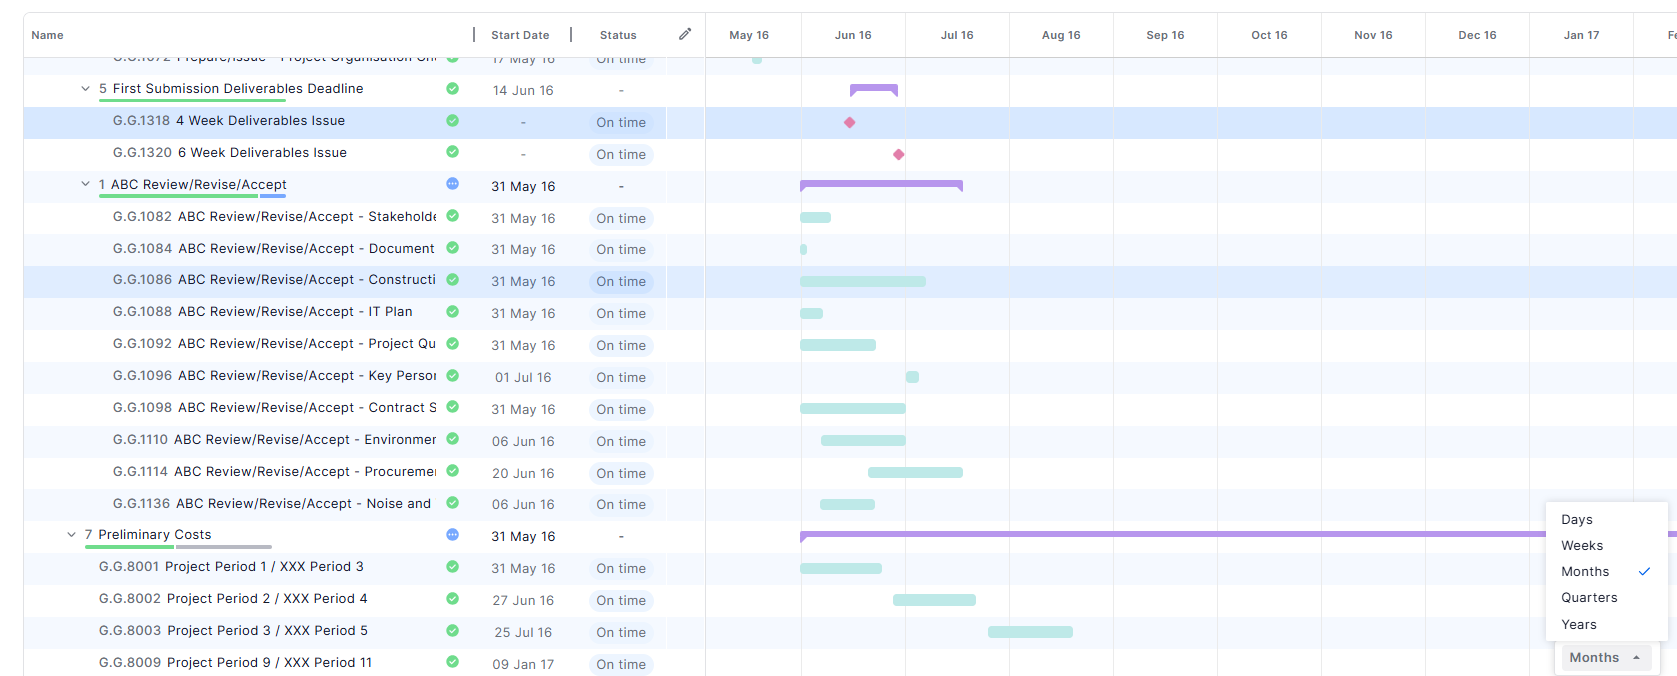
Zoom in and out
Change the timeline scale to view your schedule by years, quarters, months, weeks, or days using the dropdown at the bottom right corner. This lets you focus on the big picture or drill down into detailed timelines.
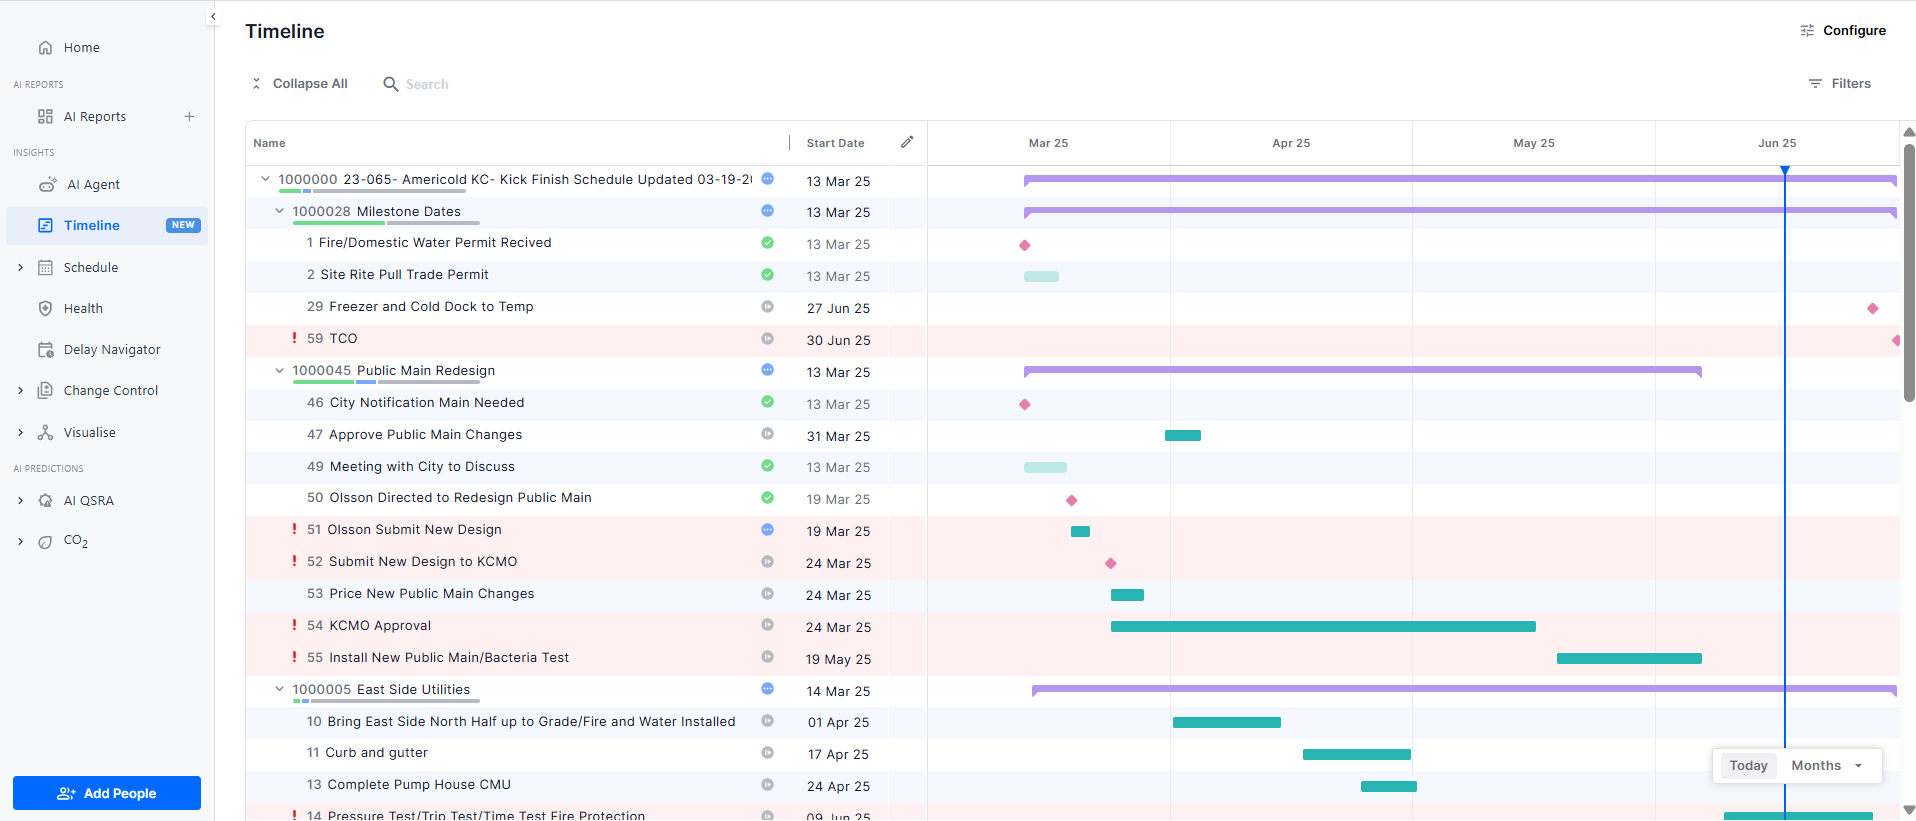
Go to today’s date
Click the Today button next to the granularity dropdown to instantly scroll the timeline to the current date, helping you quickly find where your project stands now.
Configure timeline display
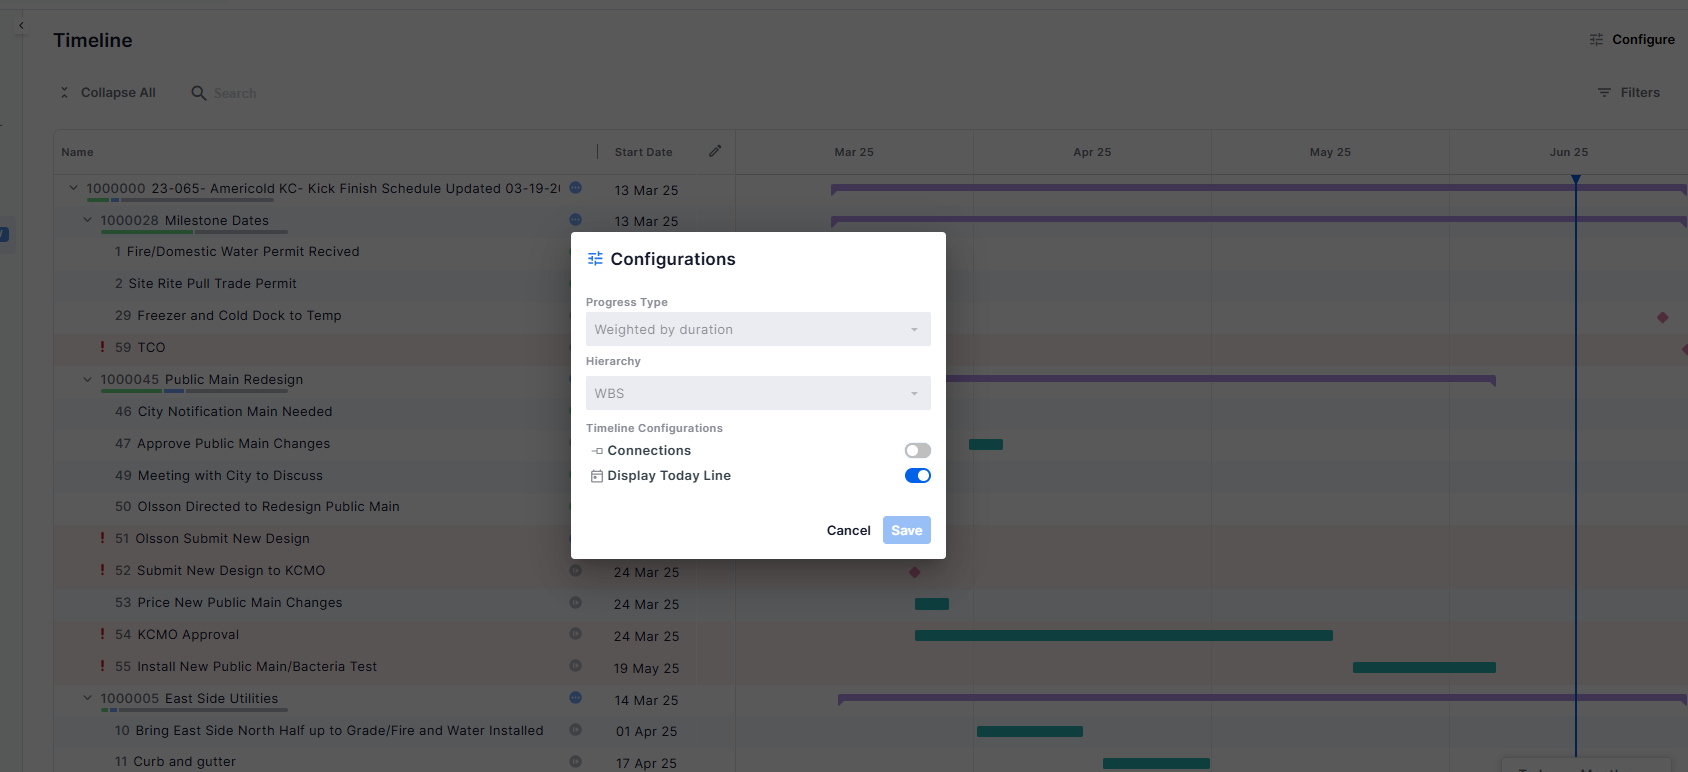
- Open the Configure pop-up from the top right corner to customize timeline settings:
- Choose progress calculation (weighted by duration or activity count)
- Toggle today’s vertical line on or off
- Enable or disable activity connections
Explore activity connections
When activity connections are enabled, you can visually explore dependencies directly on the timeline. Hover over arrows between activities on the timeline to see relationship types (e.g., finish-to-start) and connected activity details.
