📊 Change Control
🔍 What you'll learn:
- See a high-level overview of schedule changes at a glance
- Slice through changes by type (Schedule, Critical Path, Custom Paths, Calendars, Relationships, Dates, Durations)
- Inspect live Gantt context and per‑activity changes
- Dive into activity pop-ups showing full before/after stats
- Export views as PNG, PDF, or CSV
Overview: High‑Level Insights
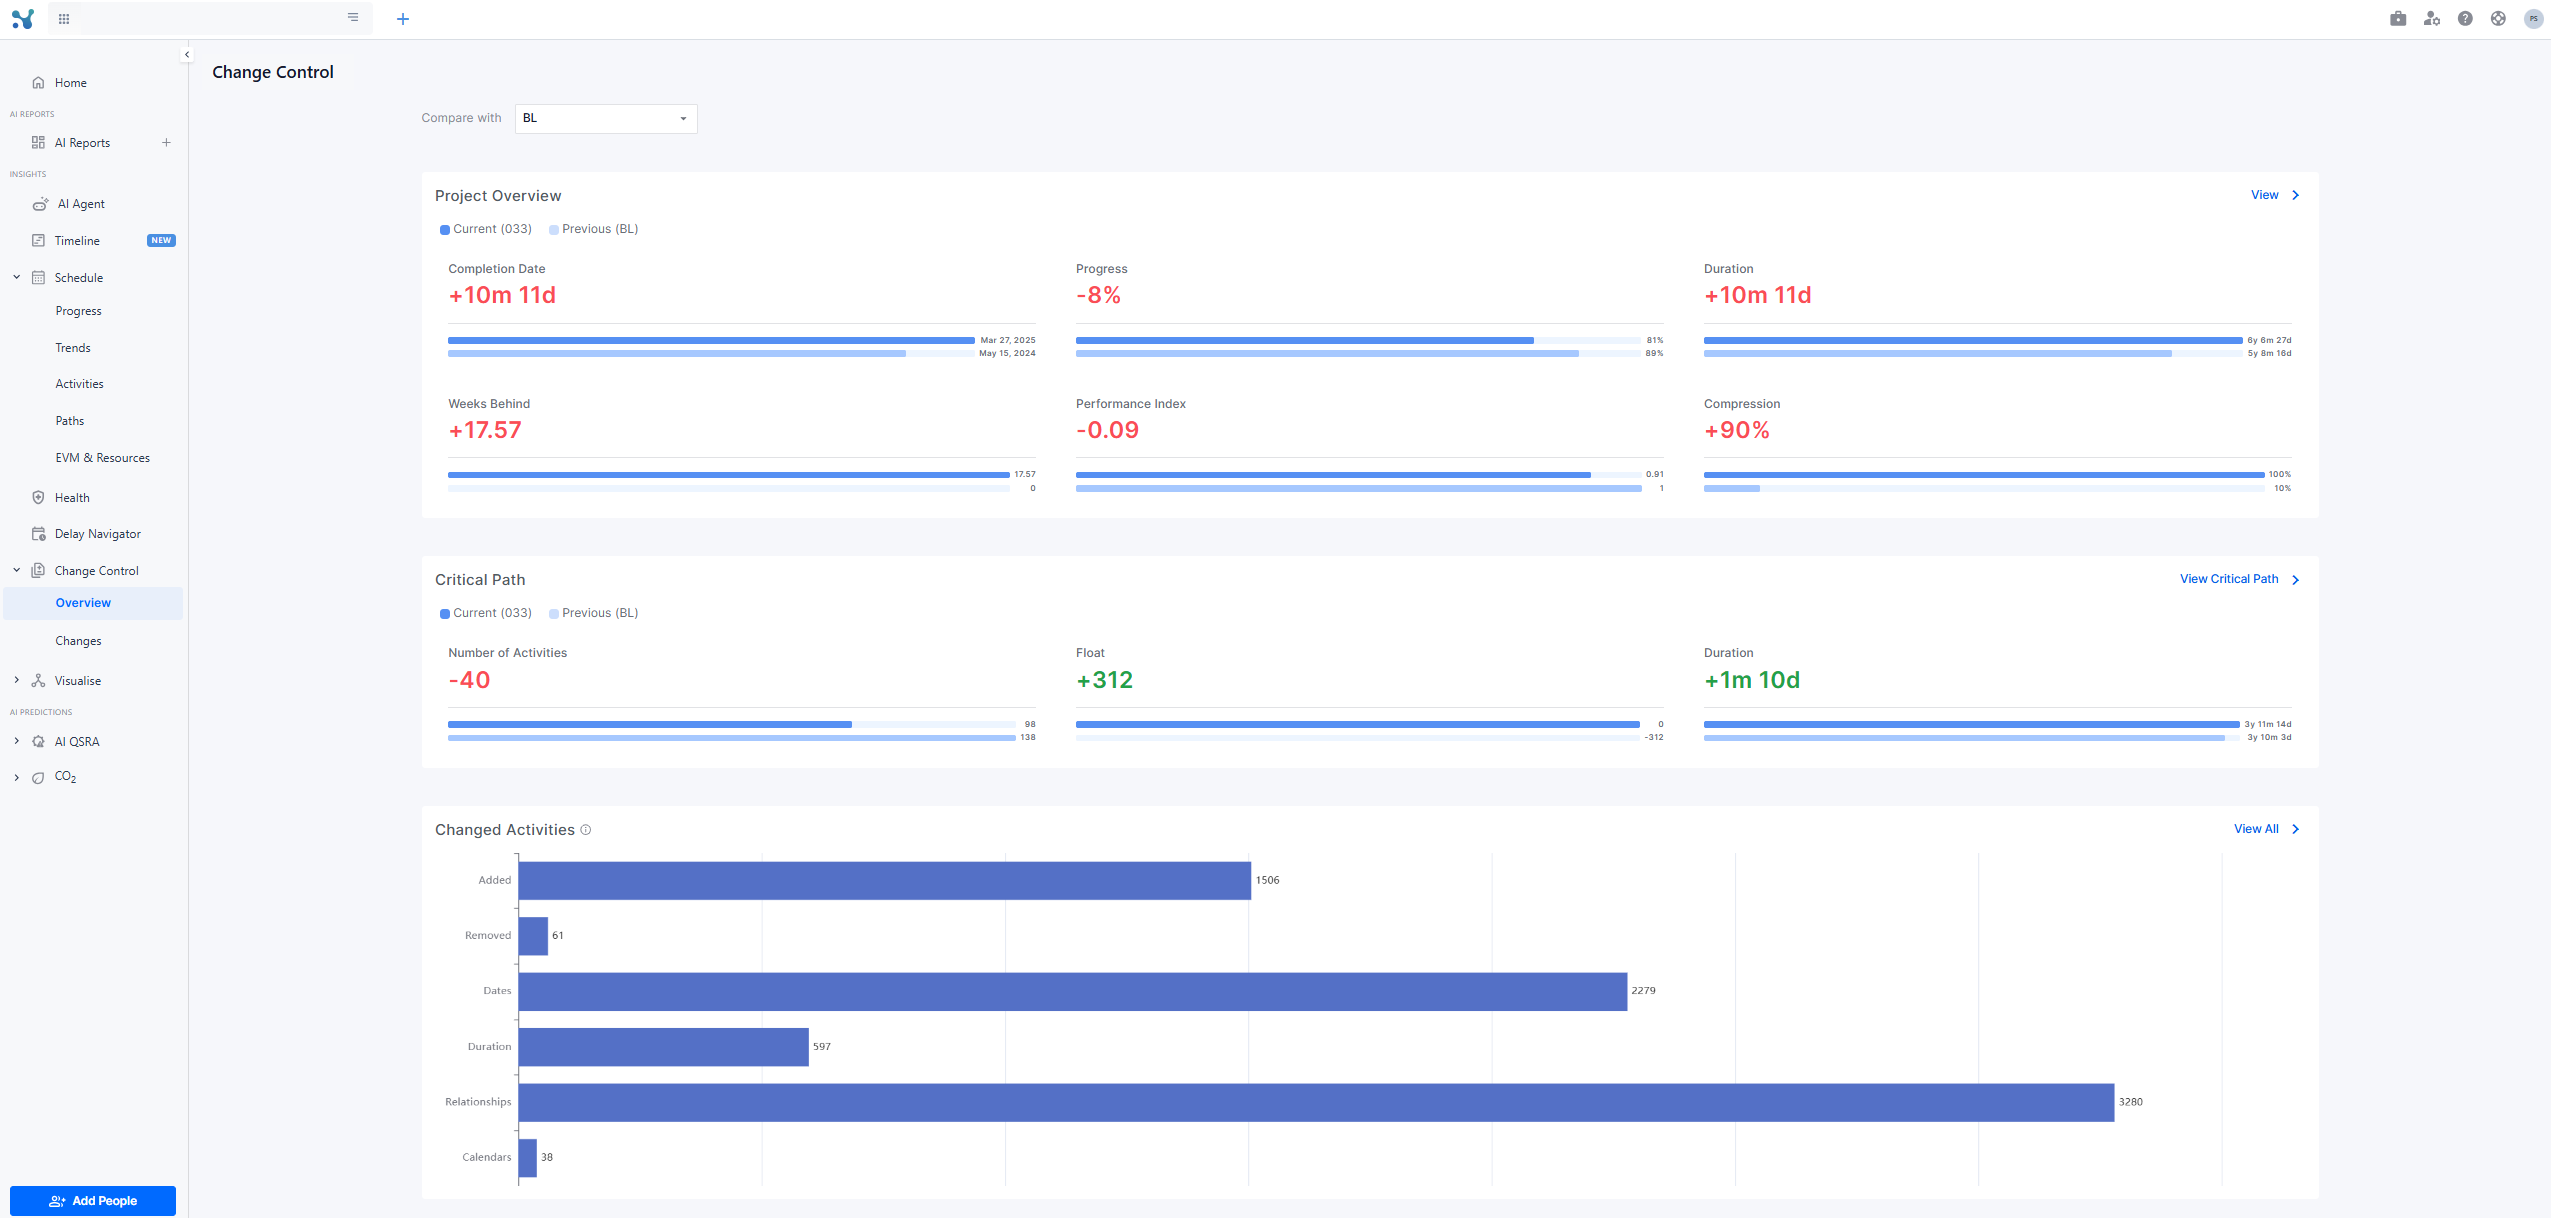
When you launch Change Control, you’re greeted with a clean, summary screen:
- Key KPIs—total updates, added/removed activities, critical path shifts, calendar adjustments—are displayed up front
- Choose your comparison schedule via dropdown
- Quickly drill down to a category that interests you by clicking on the bar at the the bottom bar graph!
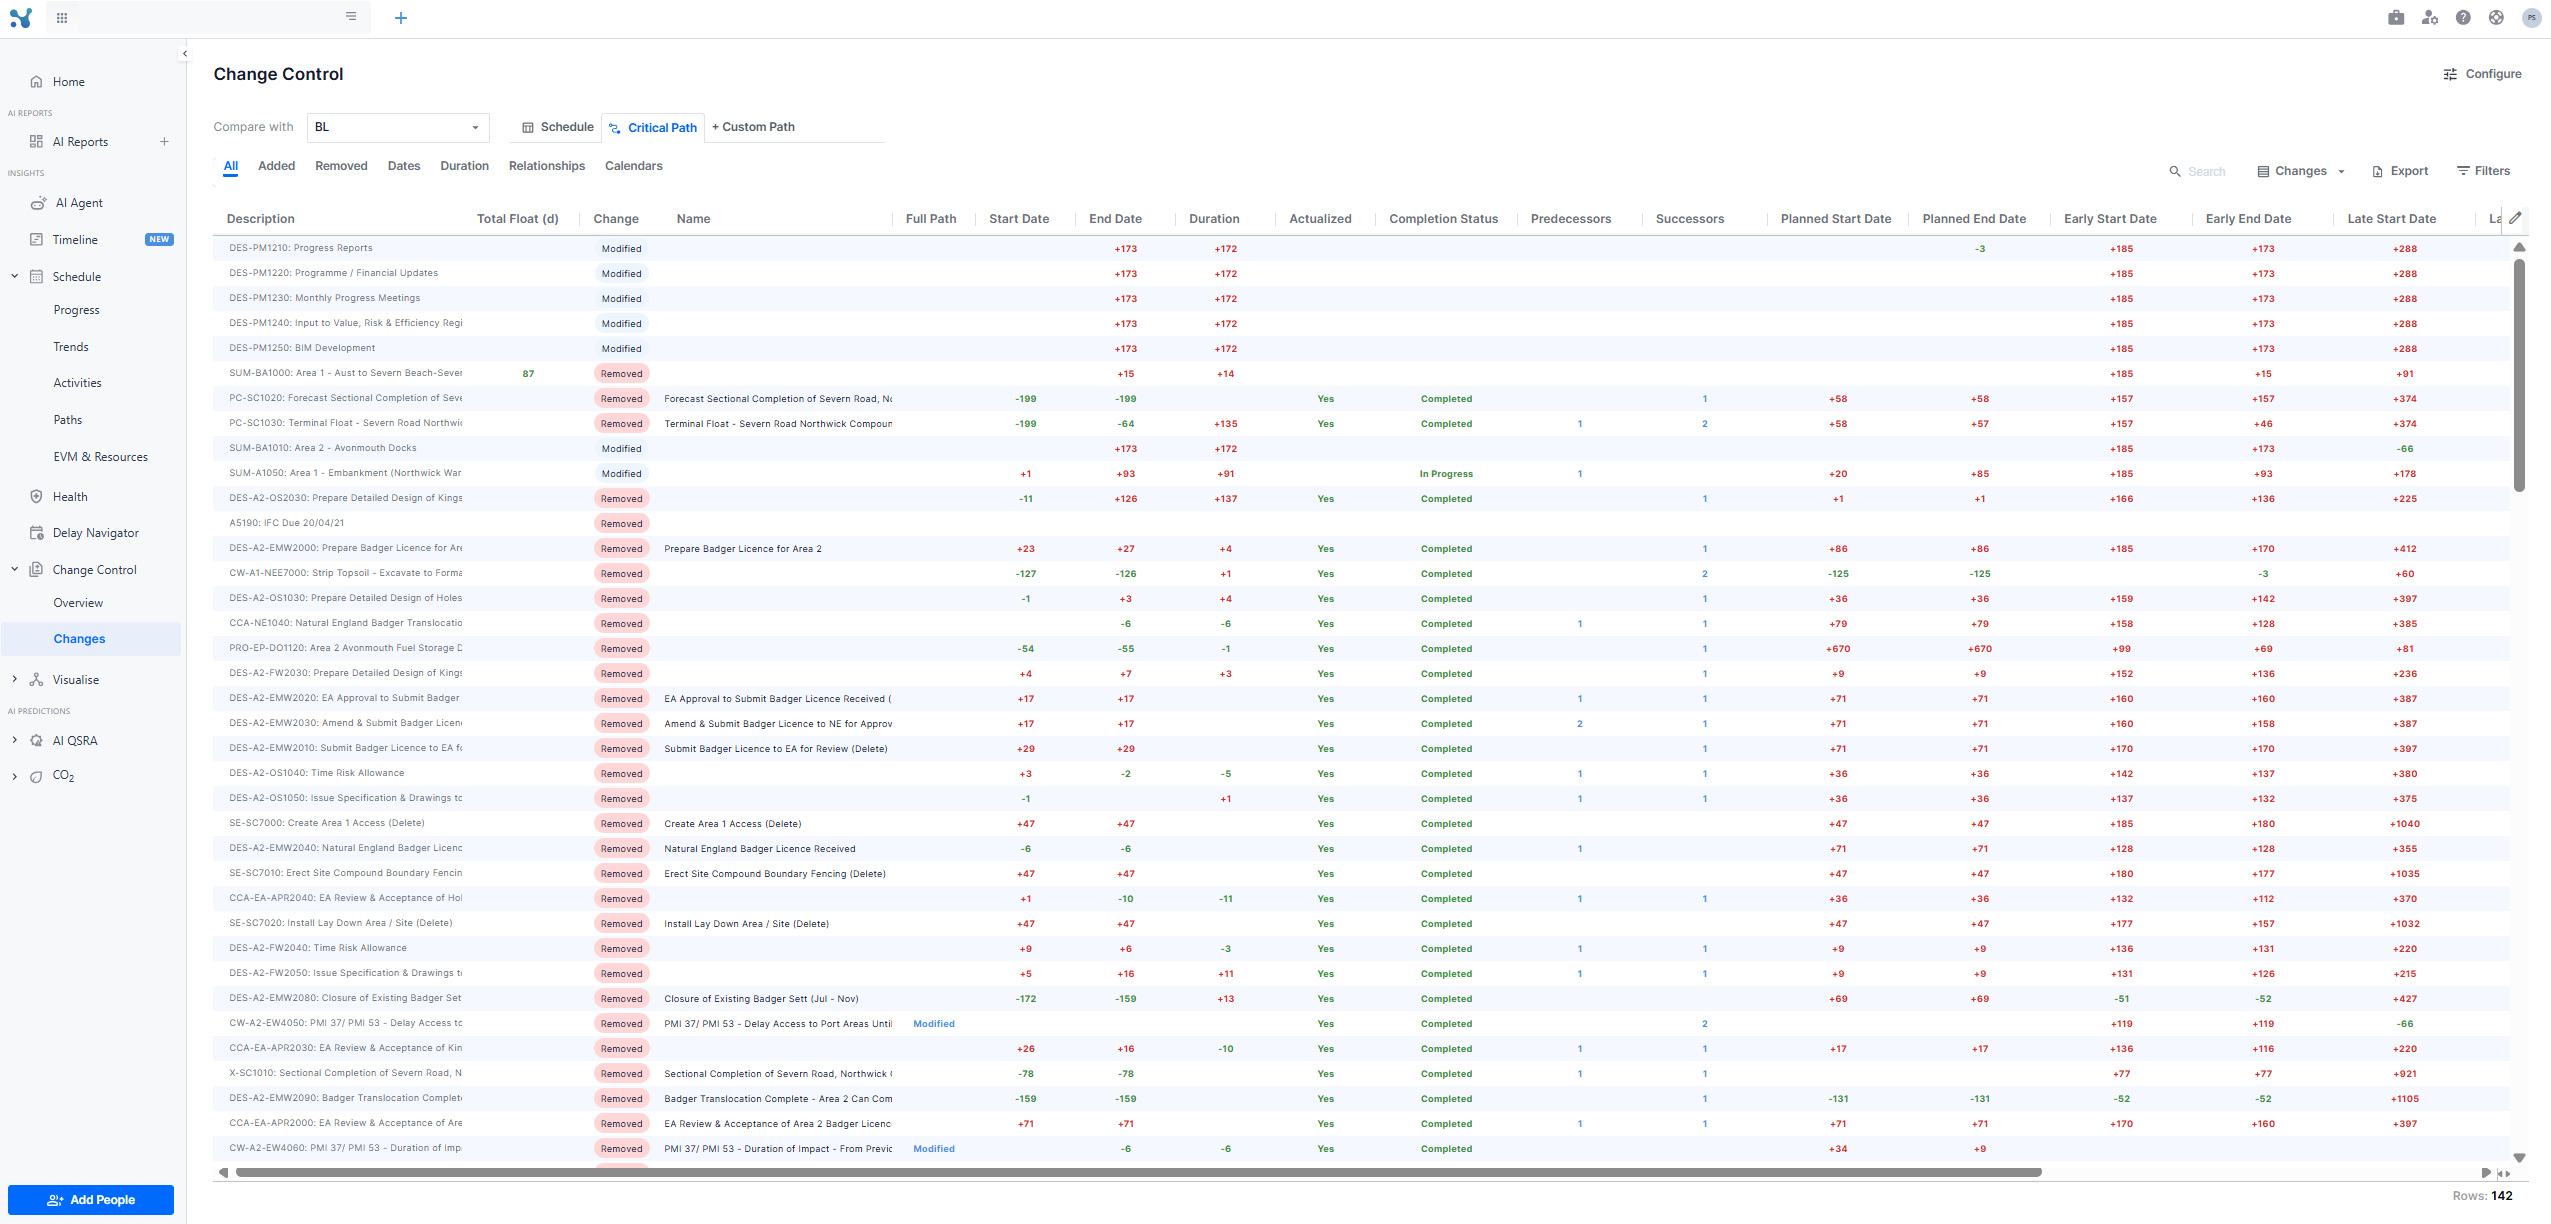 Changes: Detailed information view
The Change Control view is organized around three primary dimensions:
1. Comparison schedule (which version you're comparing against)
At the top left of the page you can select any of the schedules whose data date precedes the one you currently have as active
2. Scope selection (what to compare)
At the top of the page, you choose what subset of the schedule you want to analyze:
- All — Compares all activities in the current schedule to the previous schedule (typically a baseline)
- Critical Path — Focuses only on activities that are part of the current Critical Path, helping you identify changes to project finish
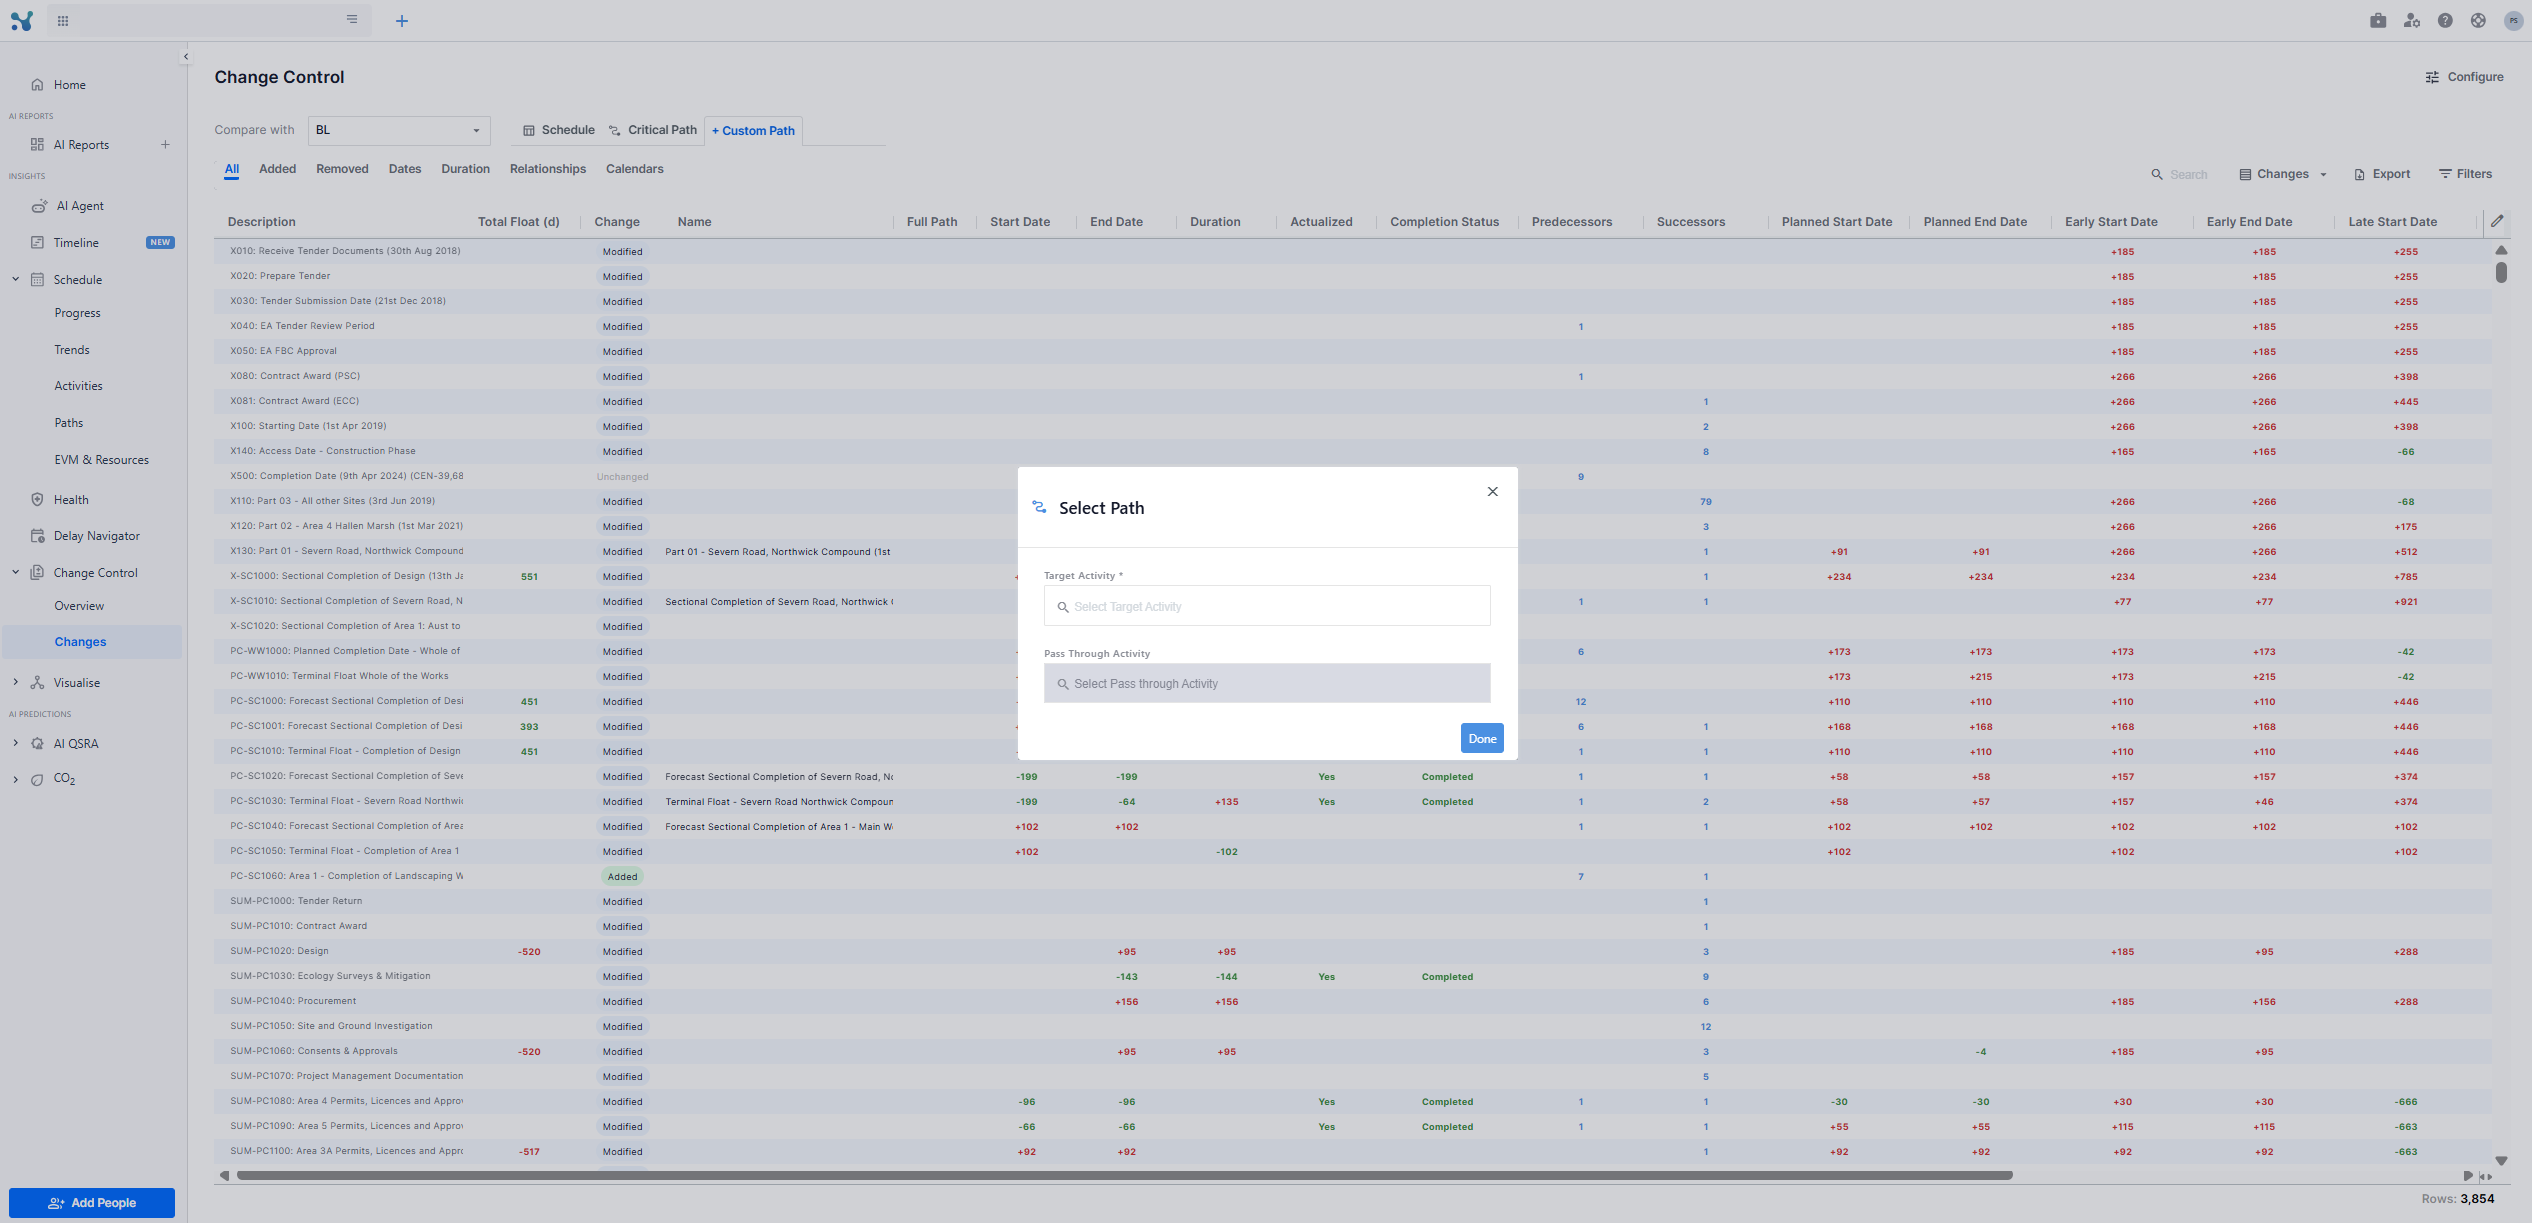
- Custom Path — Allows you to select:
- A Target Activity (e.g. milestone, deliverable)
- An optional Pass-Through Activity to define a custom sequence of dependencies for closer analysis
This selection controls which part of the schedule is visualized and analyzed across the rest of the view.
3. View type (how the information is depicted)
- Changes View - A data table mode where each activity change is shown in detail. You can use tabs to focus on specific types of changes (e.g. Dates, Durations, Relationships, etc.). Clicking on a row opens a side panel with full before/after details.
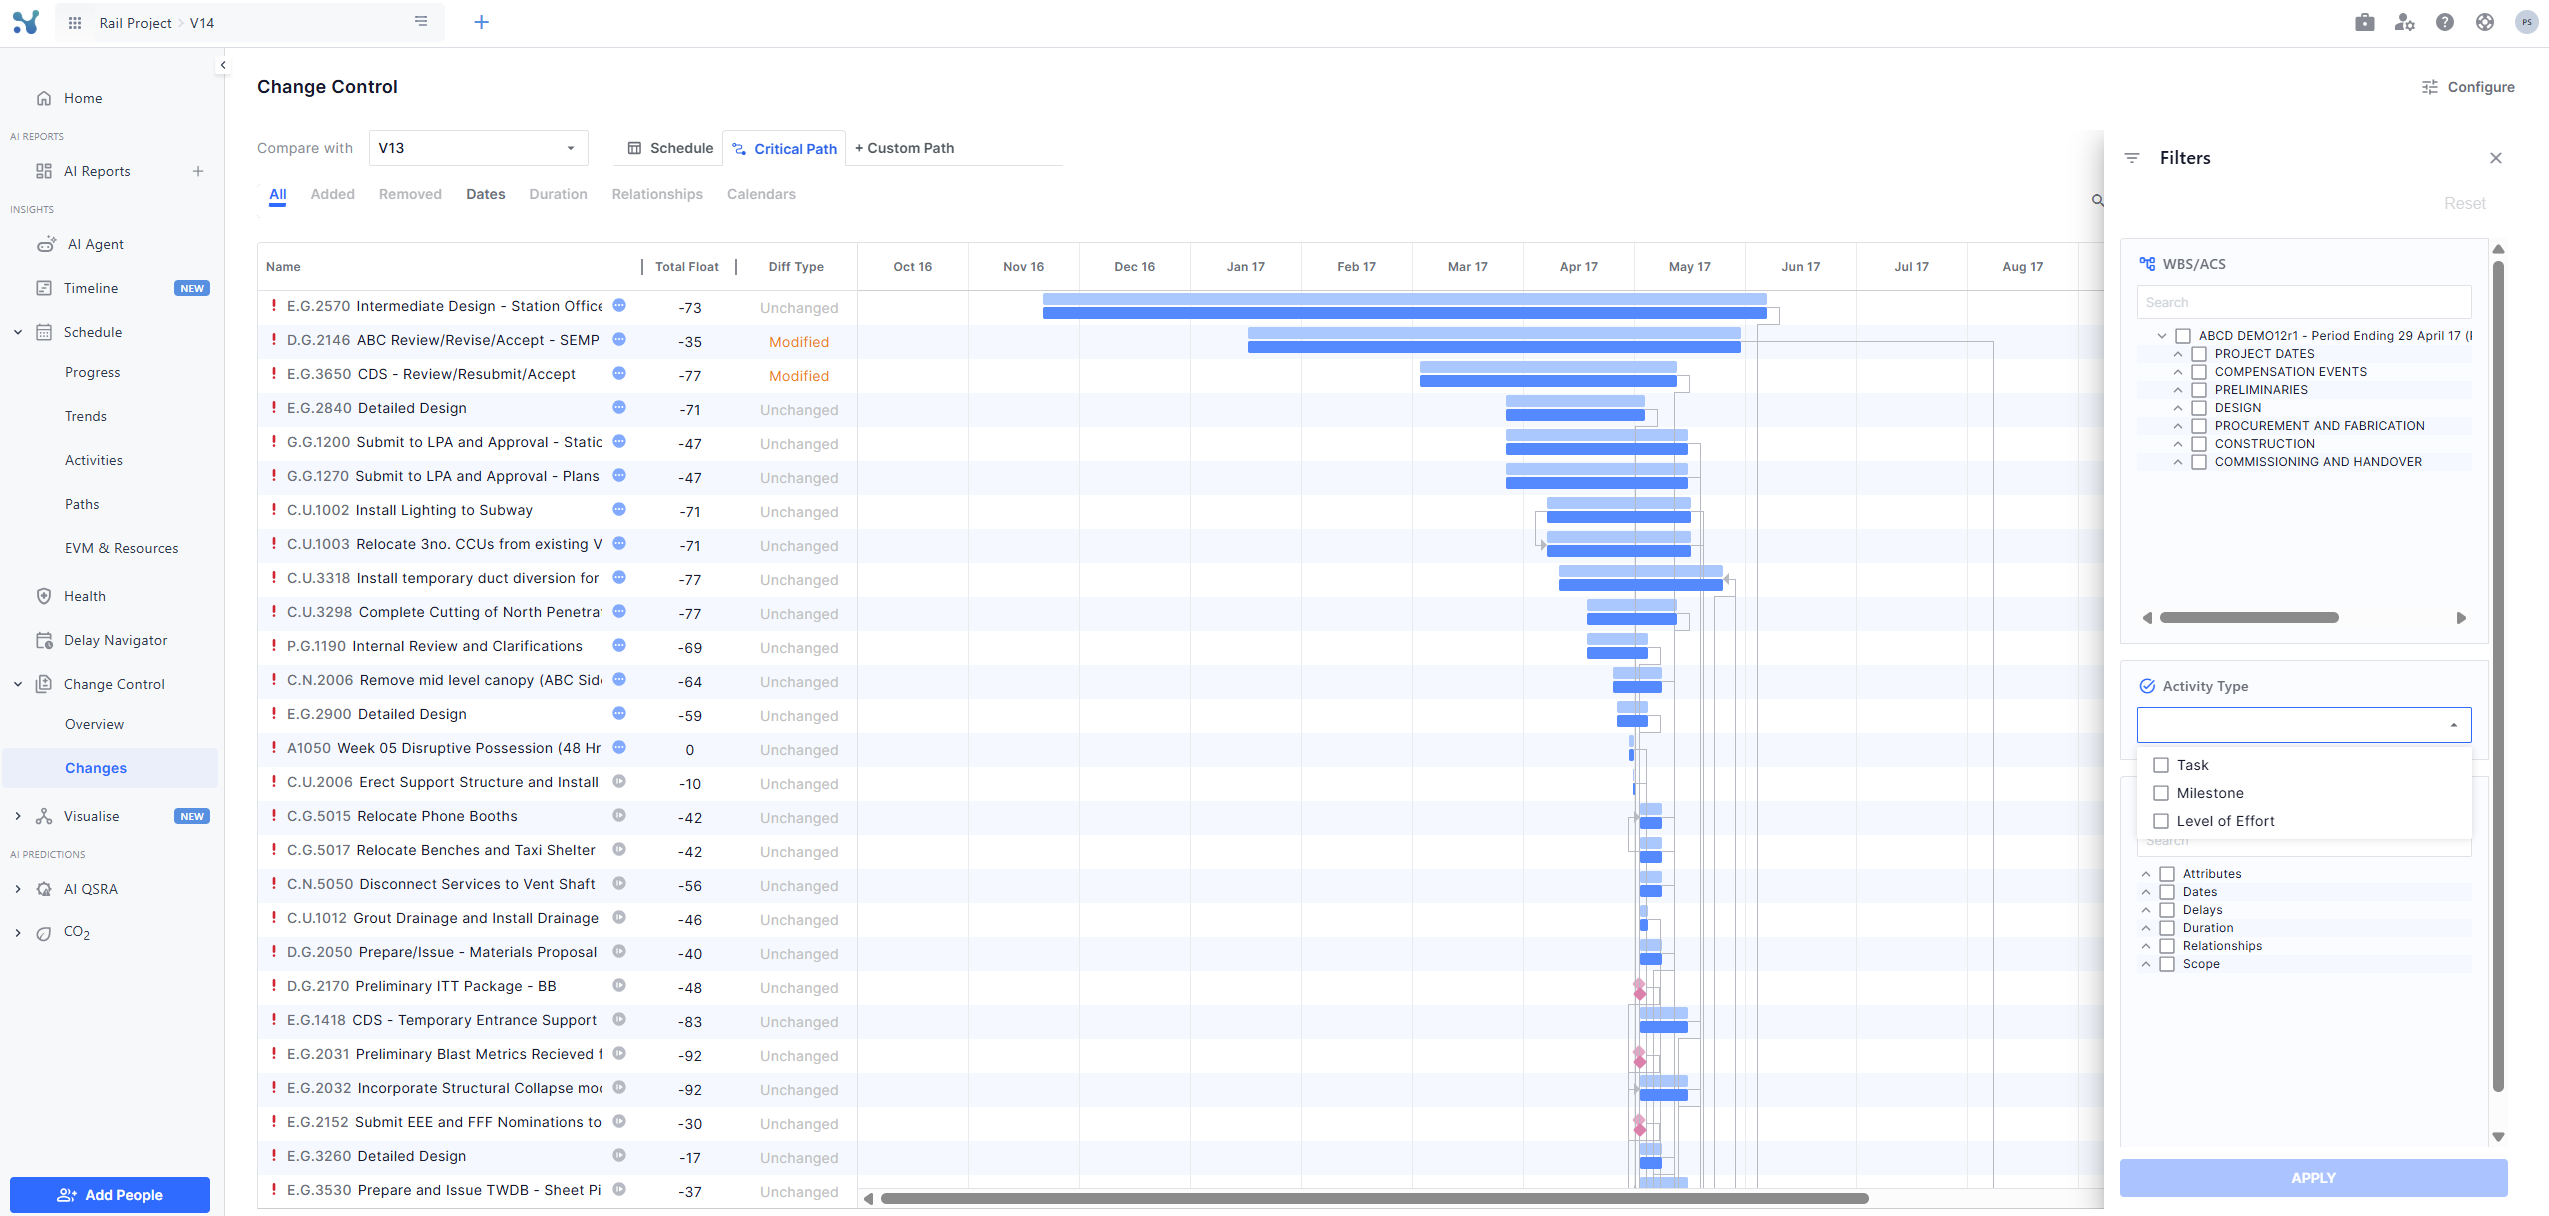
- Gantt View - A visual timeline view showing activity bars for before and after states, overlaid for easy comparison.
Tabular filters
Tabs dynamically group activities based on the kind of change they’ve undergone:
- All – Full list of changed activities
- Added / Removed – For new or deleted activities
- Dates – Start, finish, or actuals changed
- Duration – Duration changes detected
- Relationships – Logic changes (predecessors/successors added/removed)
- Calendar – Calendar assignments updated
🔍 Click any tab to auto-apply its filter to the table and Gantt (if active)
Data table
Each row in the data grid corresponds to a changed activity. Key capabilities:
Sortable Columns – Click on any column to sort; for example, find the activity with the worst duration slippage
Selectable Rows – You can manually select specific activities to analyze further
Customizable Columns – You can show/hide columns and reorder them to tailor the grid layout to your workflow. This lets you focus on the most relevant data—whether that’s dates, float, relationships, or delays.
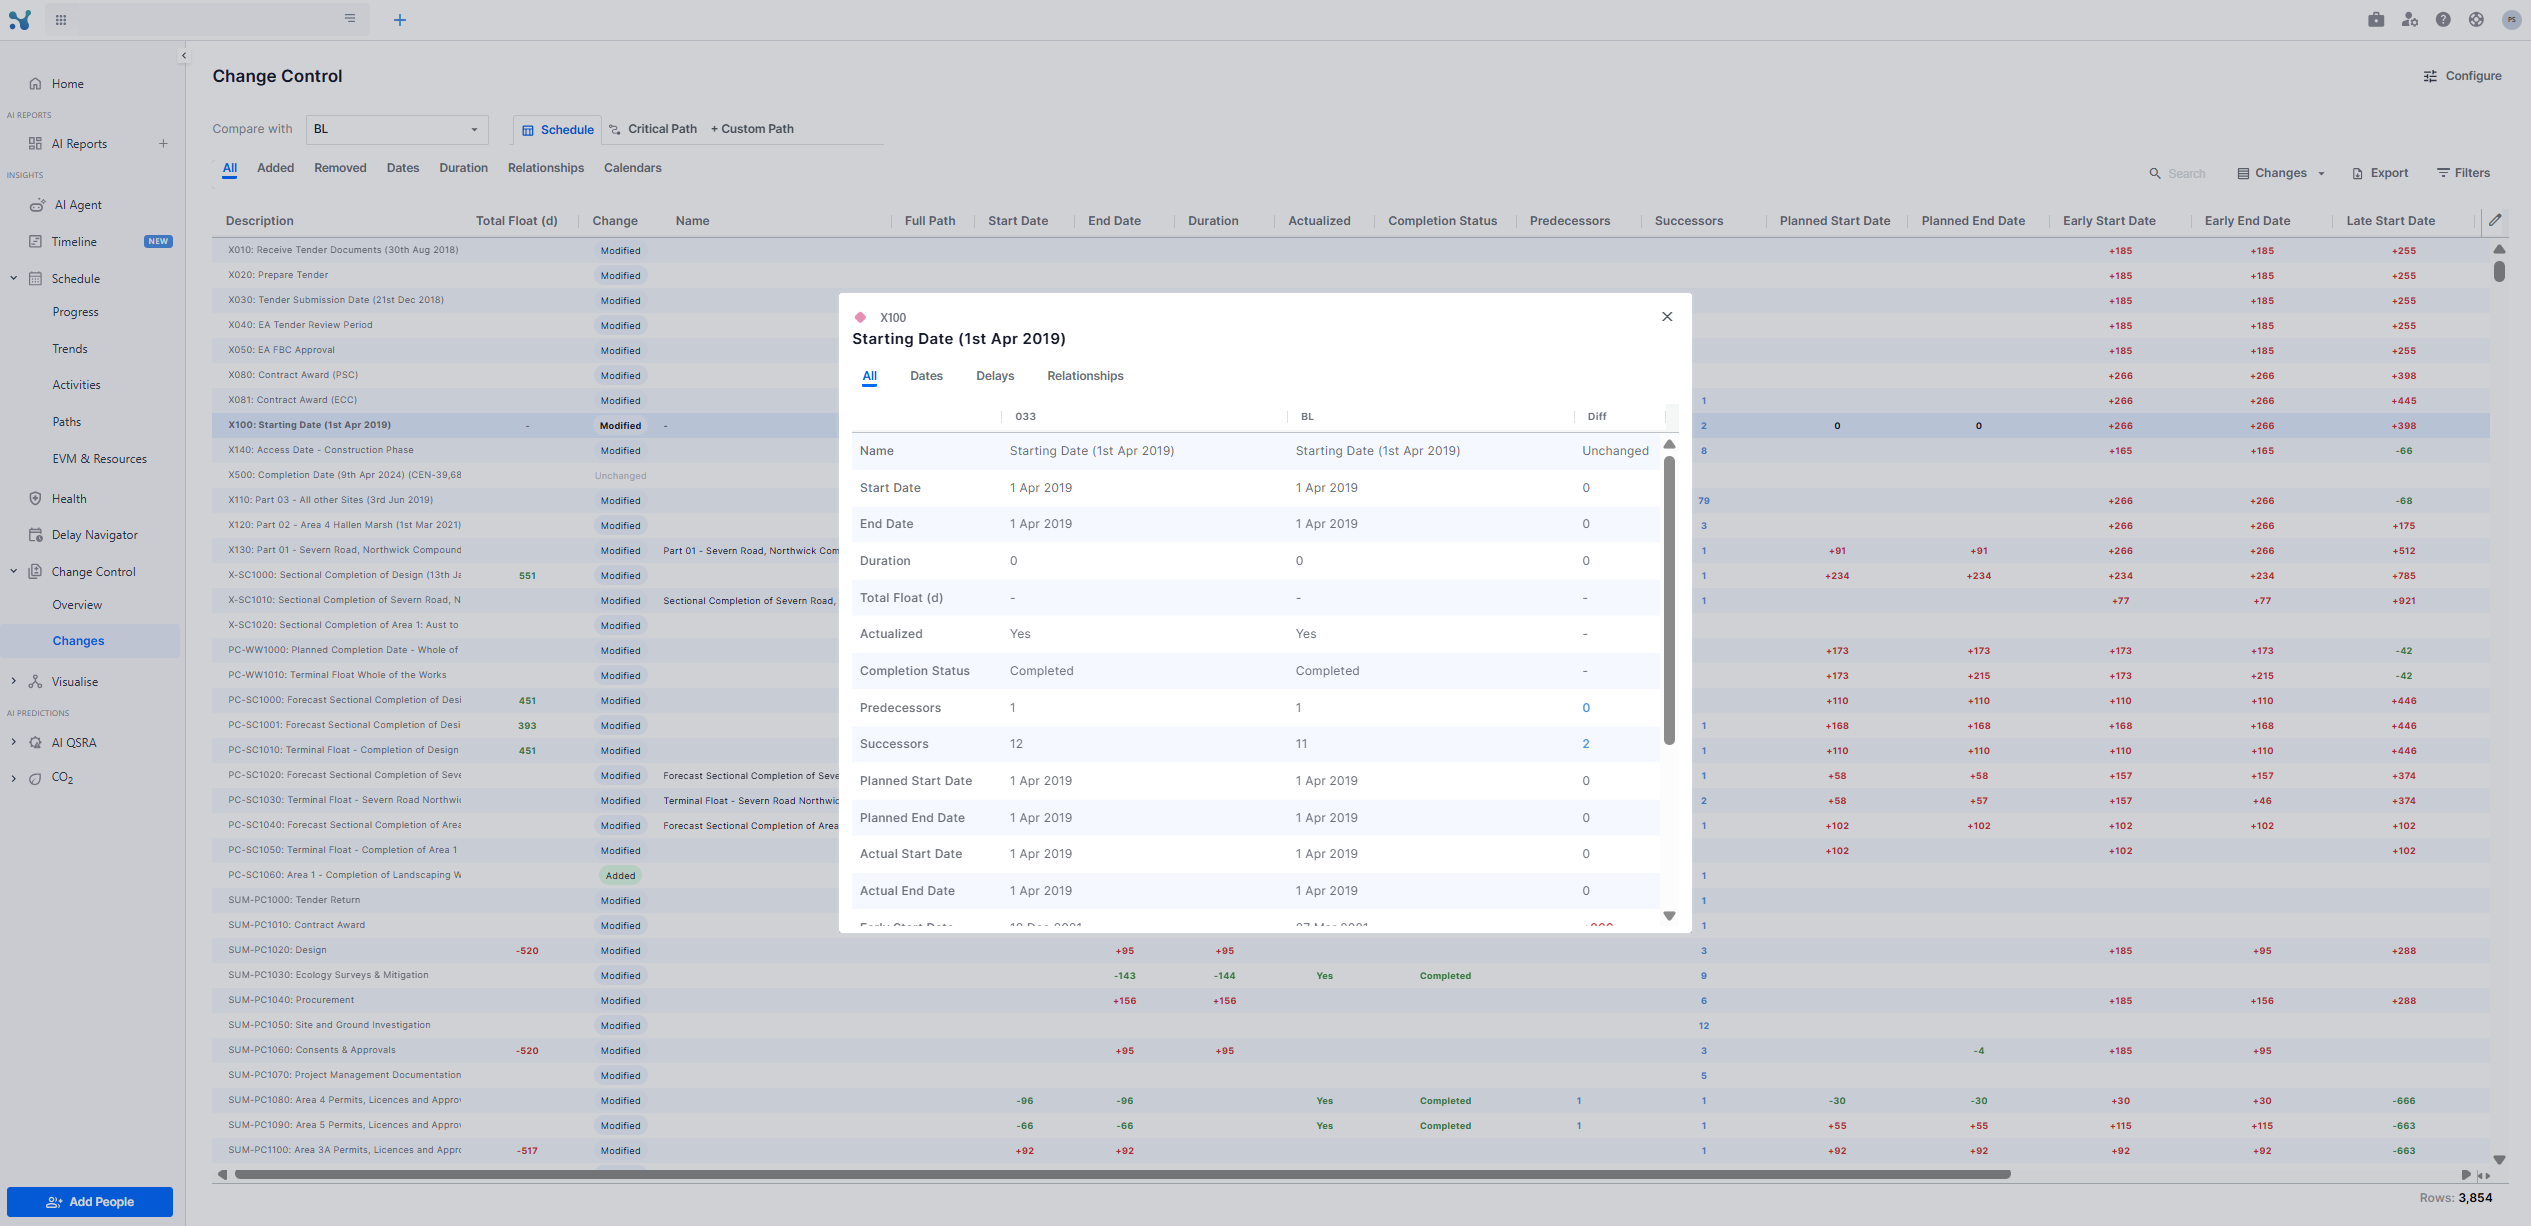
Activity details pop-up
Clicking any row in the grid or Gantt opens a pop-up showing full before vs. after details across multiple tabs:
- All – Unified comparison of all relevant fields (dates, durations, float, calendar, etc.)
- Dates – Start/Finish/Actual comparisons
- Delays – Delay analysis including variance in working days
- Relationships – Differences in predecessor/successor assignments
The panel works intelligently highlighting fields with changes across schedules.
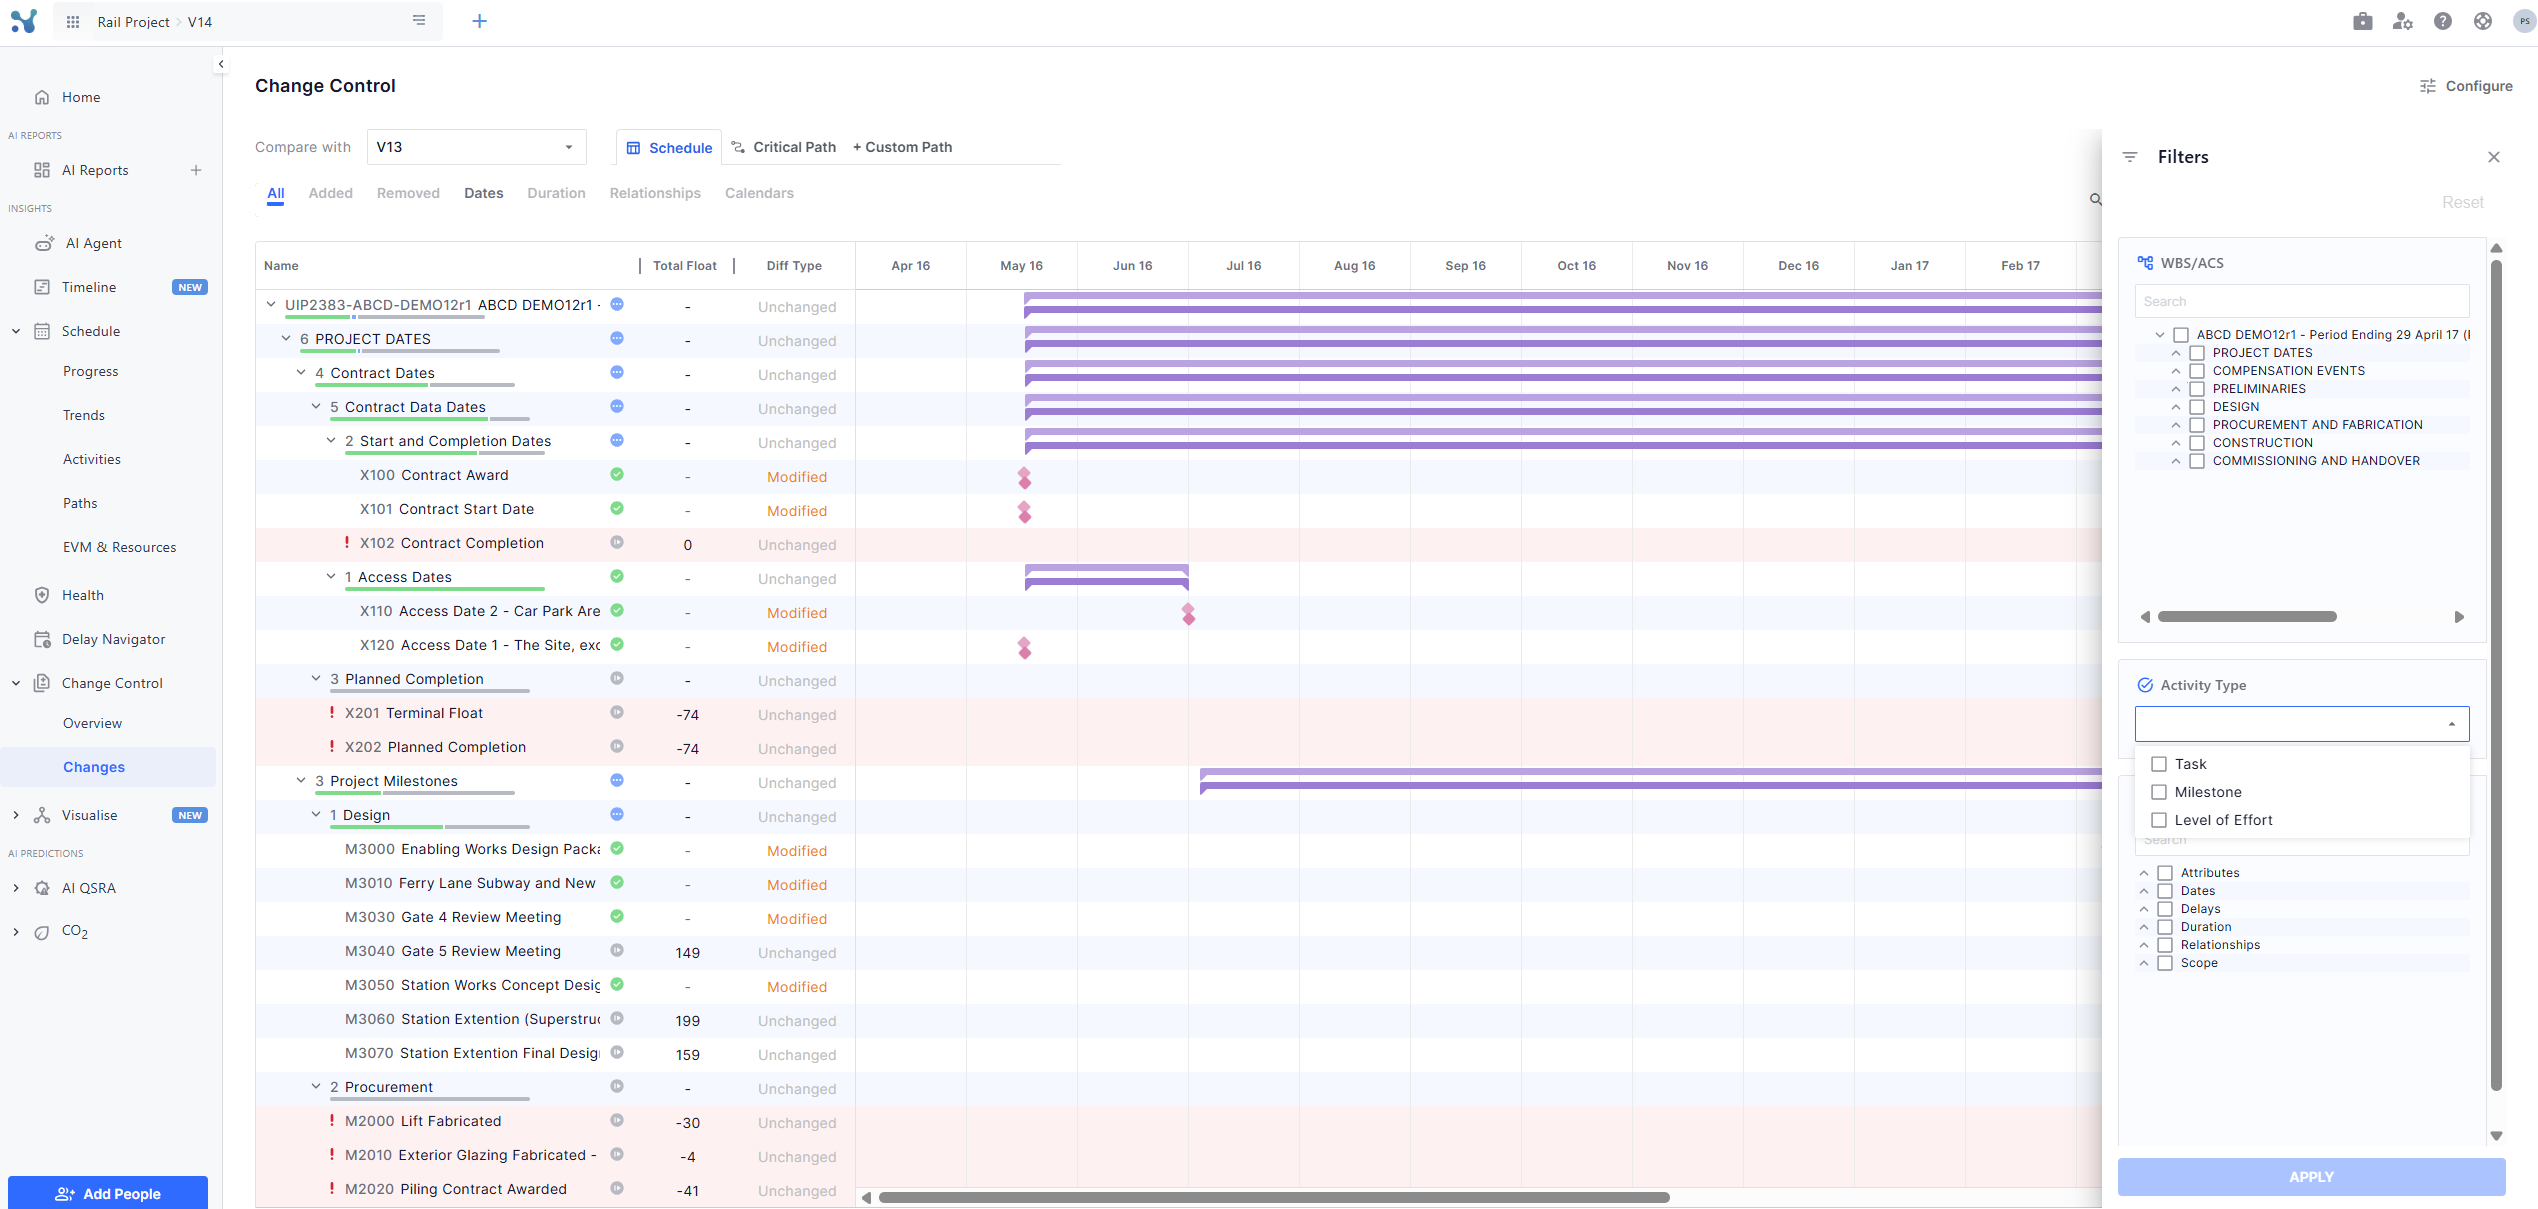
Filters
Click the Filters button to open a filter sidebar where you can filter by:
- Activity type
- ABS or ACS hierarchy
- Activity attributes
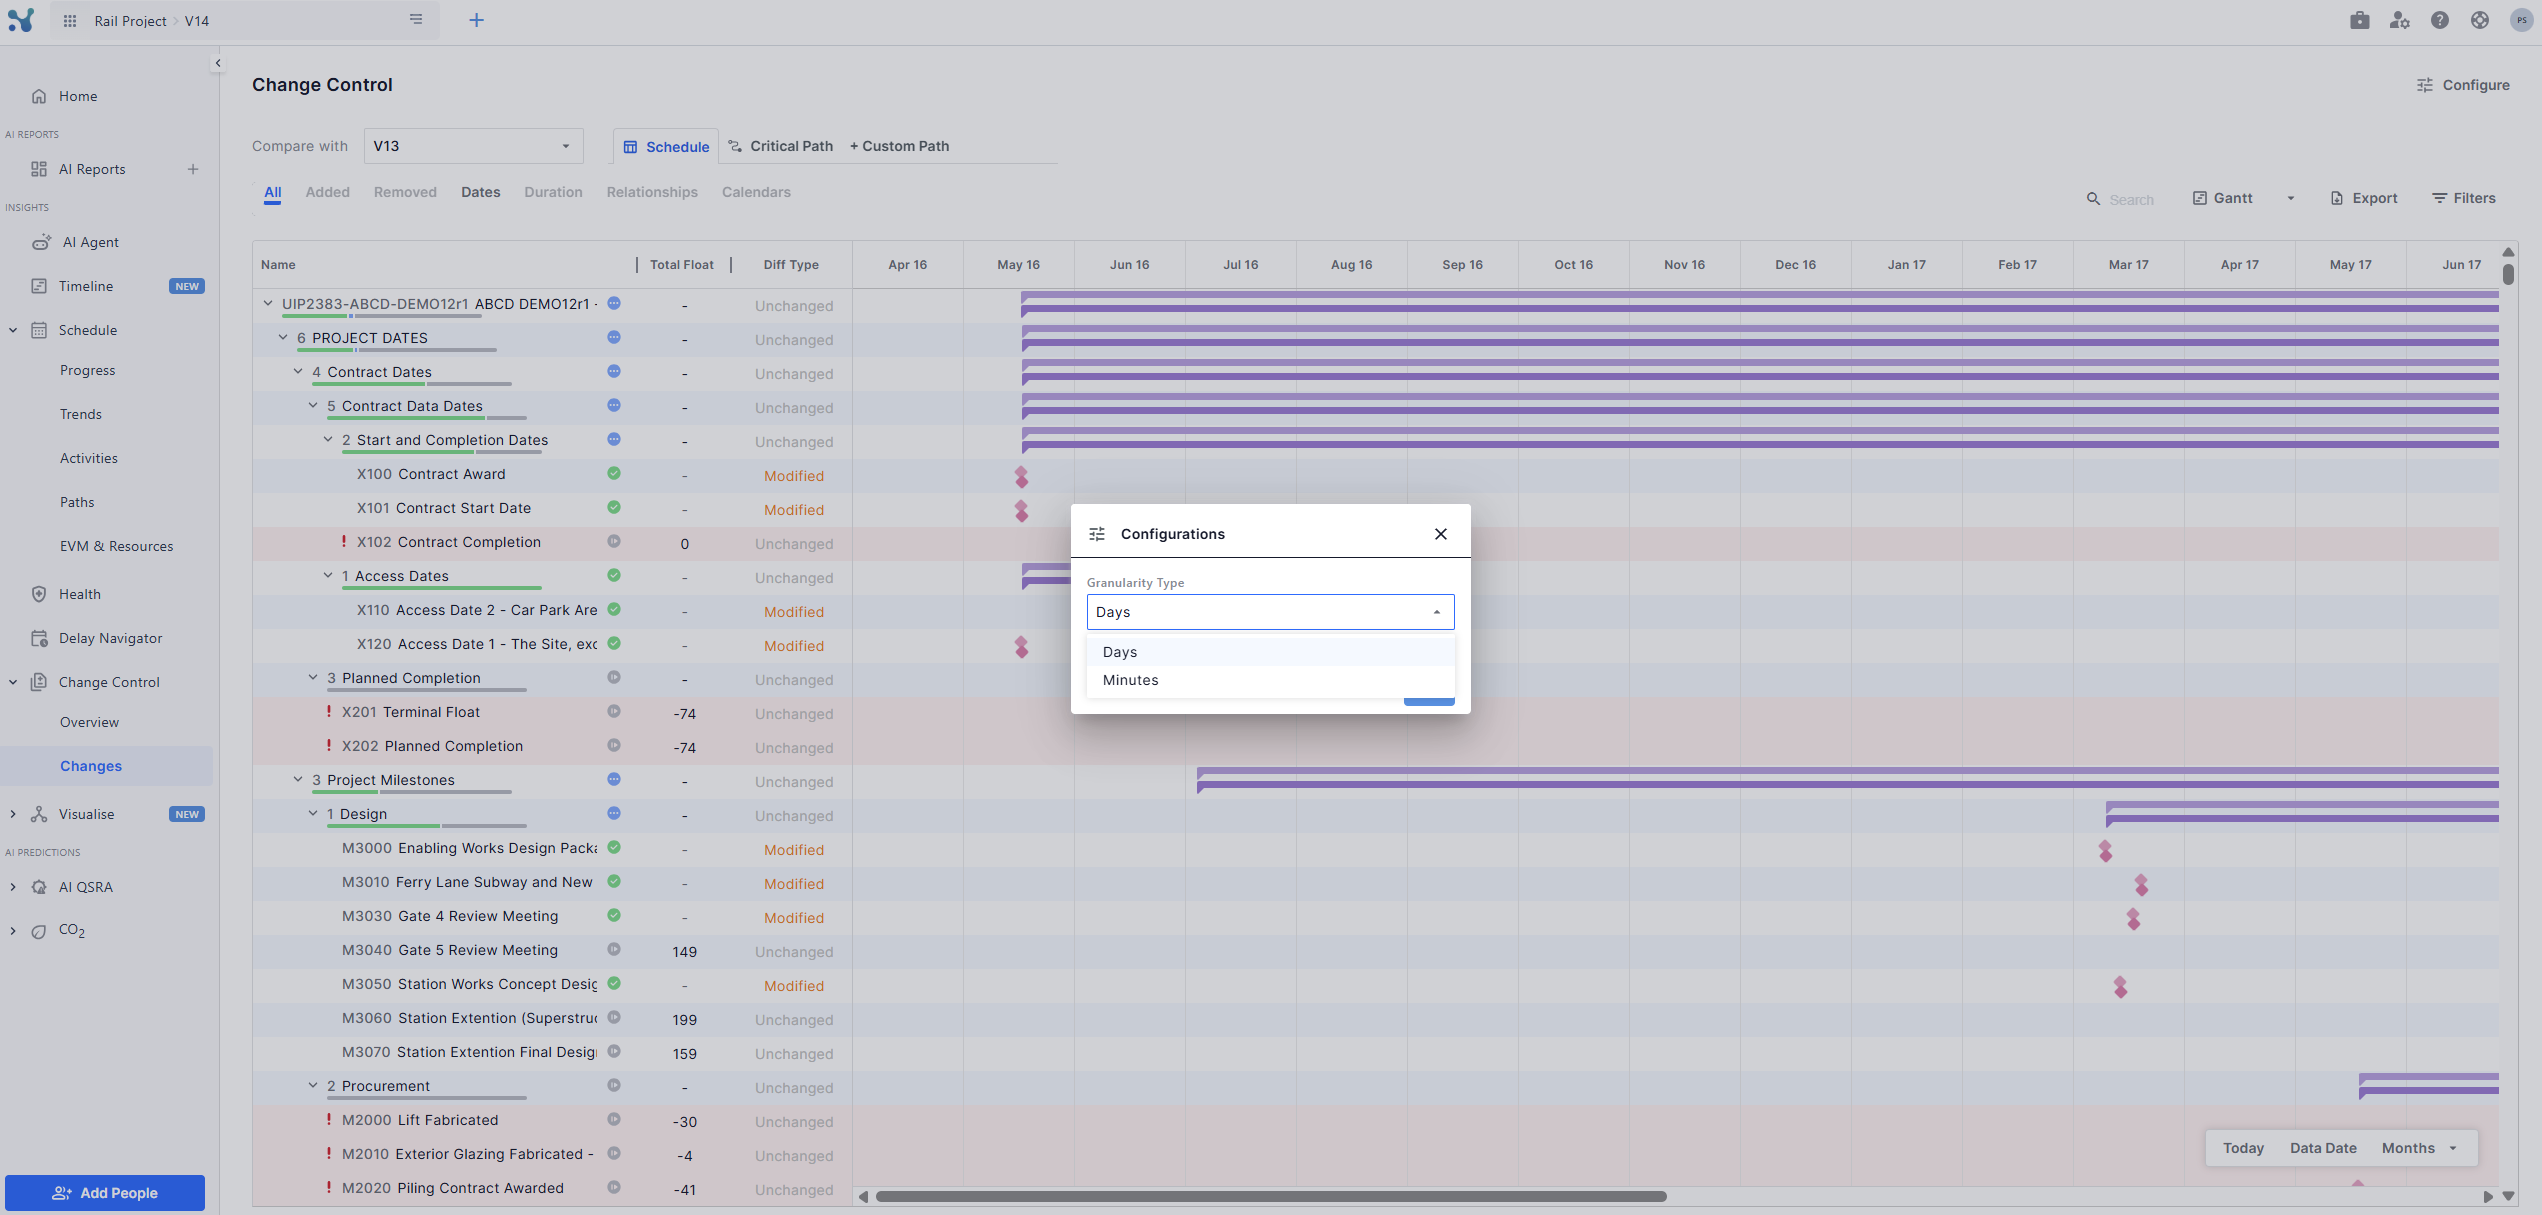
Granularity Control
From the top-right menu, you can toggle between:
- Day-Based View (default)
- Minute-Level View — Useful for short-term or high-precision projects where every minute matters
Export Options
Select Rows: Export to Spreadsheet → Export only the manually selected activities in the grid to Excel
Export Detailed Spreadsheet → Full dataset of all activities, split into Excel tabs matching your filter tabs (e.g., Dates, Durations)
Export Overview Spreadsheet → A high-level summary Excel showing KPIs, charts, counts of changes
Export Gantt as PDF → Captures your current Gantt view as a stylized PDF for presentations or reports
Export Gantt as PNG → Saves a clean image of the Gantt chart suitable for embedding in documentation
