🏠 Home Screen
💡This is where you land when you log in to N&L. The Home Screen helps you answer critical questions fast using data and AI. Whether you are looking for a quick update or key drivers for delivery, you can find high level answers here!
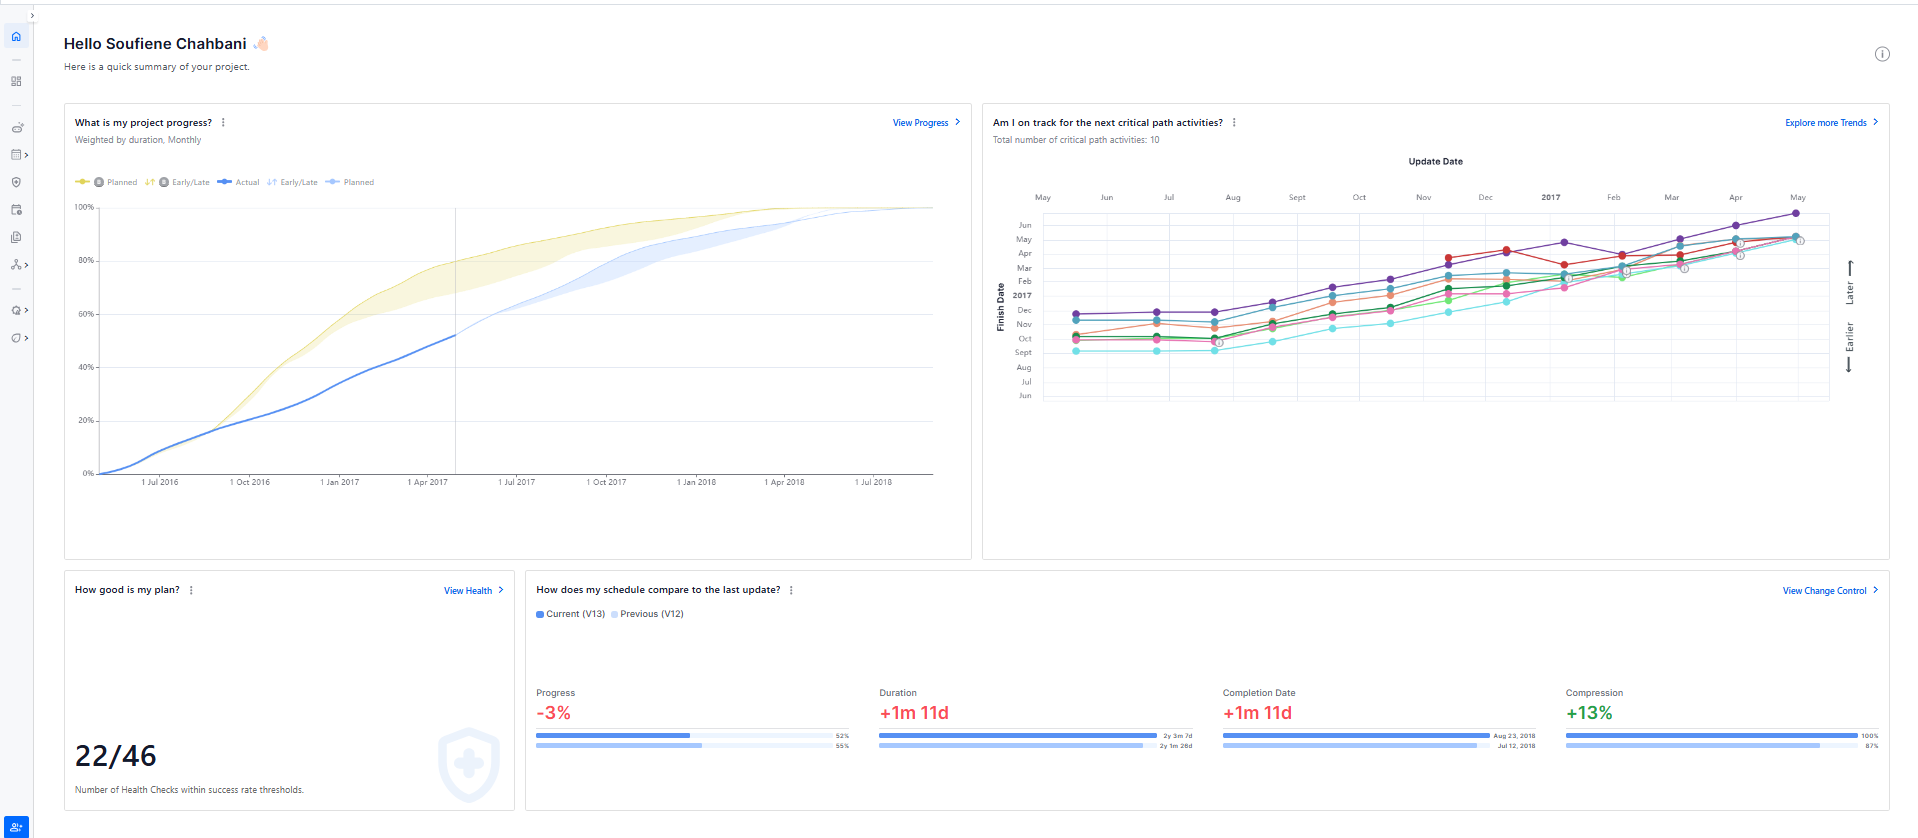
Here, you’ll learn how to quickly answer questions like:
- What is my project progress?
- Am I on track for the next critical path activities?
- How good is my plan?
- How does my schedule compare to the last update?
What is my project progress?
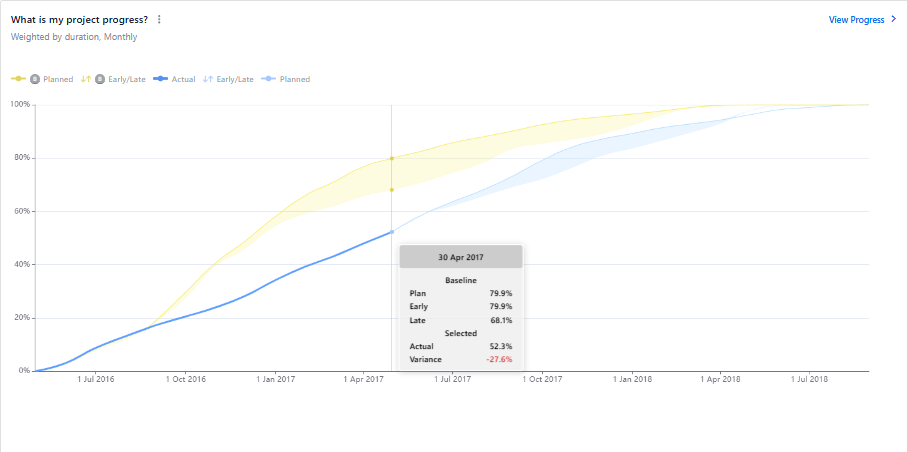
You can check the interactive S curve to measure your project progress to date, along with how future progress is planned. You can also visually compare your project-to-date with your baseline. You can easily select the information you wish to visualize, whether you just want to check your baseline or your current plan or include both actual and early/late dates. All are just one click away!
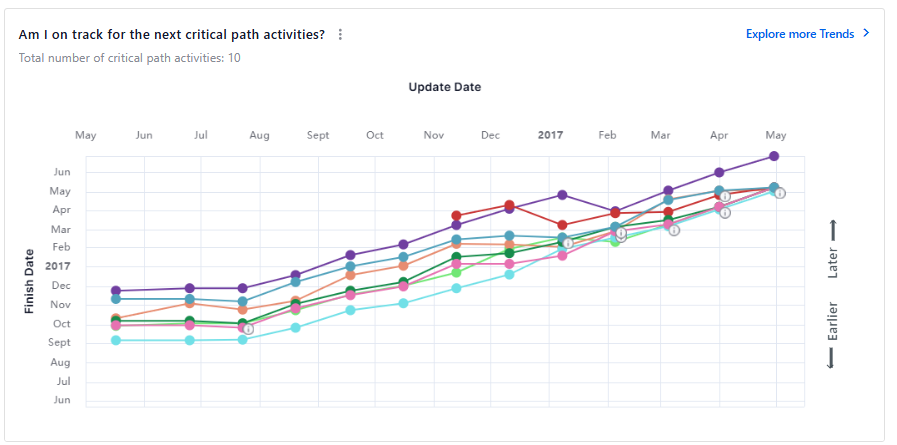
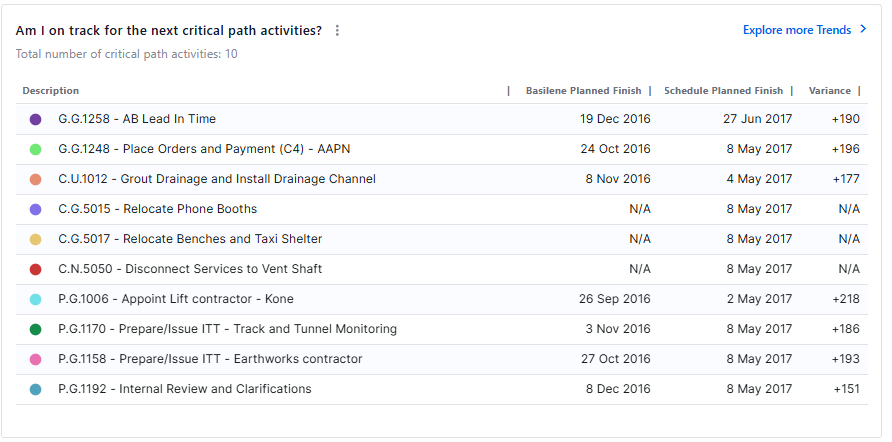
Am I on track for the next critical path activities?
This widget allows you to track how the finish dates of the next 10 critical path activities change across schedule updates. To switch between the chart and table view, click on the three-dot menu and change the display type.
How good is my plan?
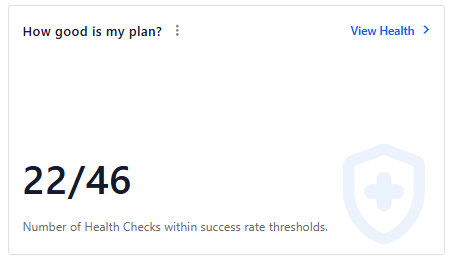
This widget displays the number of health checks that fall within the defined success threshold. It provides a quick overview of how many checks meet the expected criteria, helping you assess overall project health at a glance.
How does my schedule compare to the last update?
Use this widget to see how your schedule has changed compared to the previous update. It highlights differences in overall progress, duration, compression, and completion date, helping you track key shifts between updates.

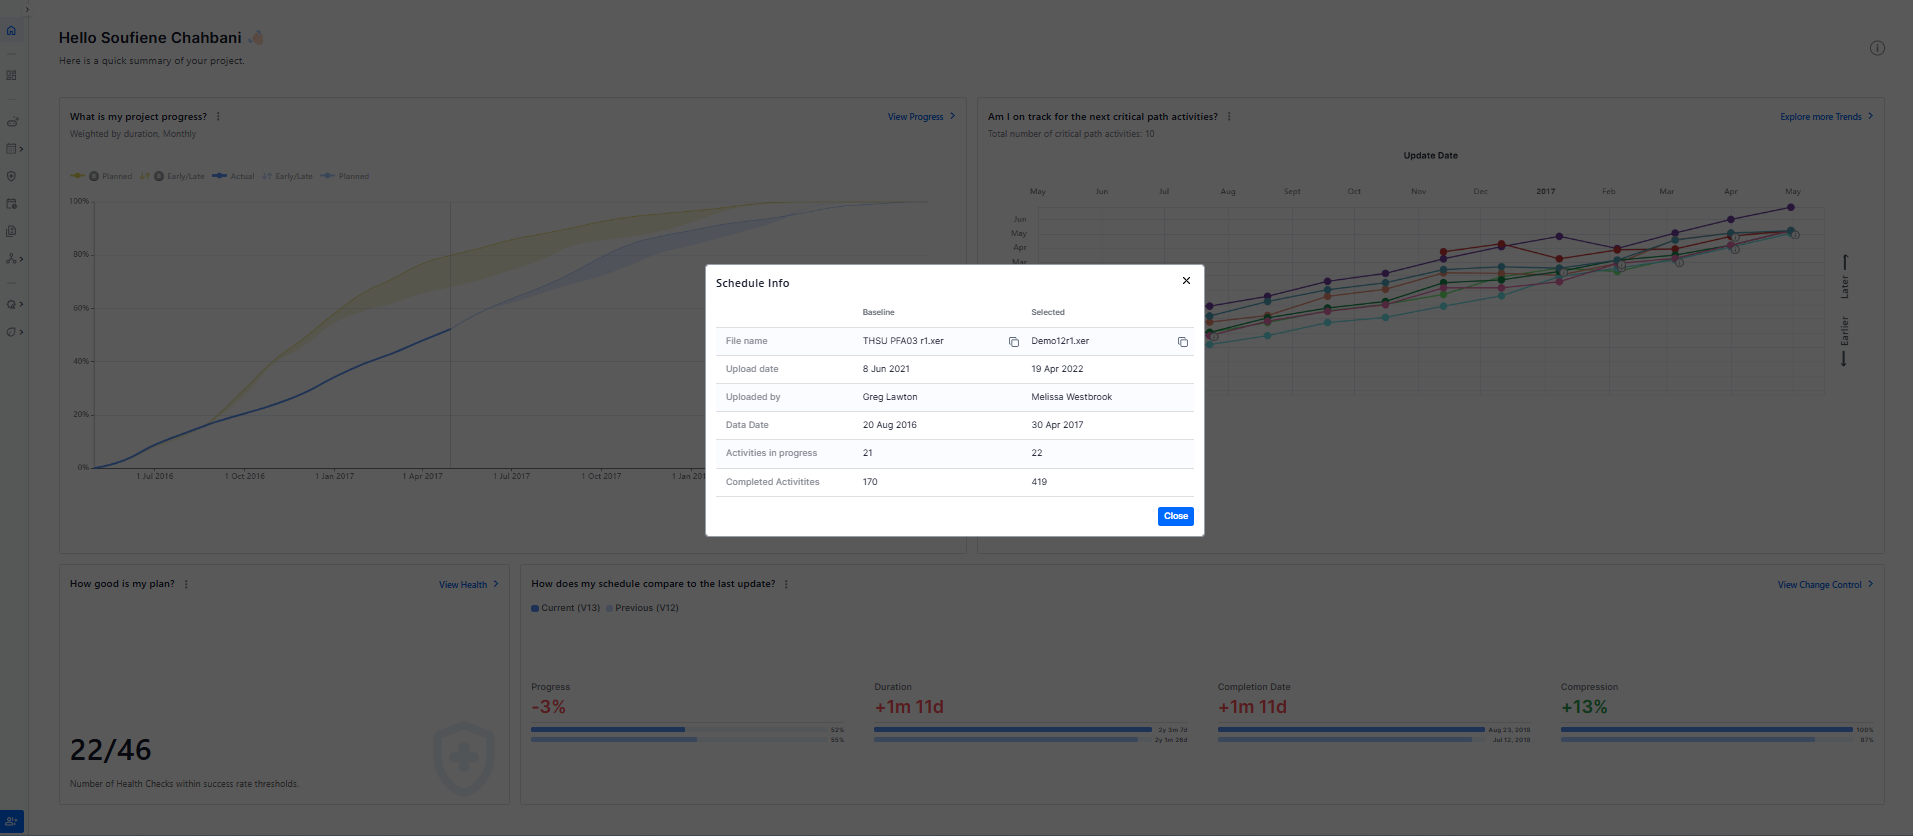
View Schedule Information
Click the (i) button on the top right to access key schedule details, including the Data Date, the number of Activities in Progress, and the count of Completed Activities.
