Health Checks in detail
DCMA Checks
| Metric | What it Measures | Extra Description | Activities included |
| Missing Logic | Percentage (%) of activities missing logical dependencies, i.e. without any predecessors or successors, or both.
| This metric identifies activities with missing logic links. It helps identify how well or poorly the schedule is linked together. All activities should have at least one predecessor and one successor associated with it. Failure to do so will impact the quality of results derived from a time analysis as well as a risk analysis
| Milestones Task/resource dependent activities
|
| Leads | Percentage (%) of relationships that have negative lag
| Lags are a scheduled delay between activities. It is important to identify lags in the schedule as they can manipulate float and constrain a schedule. You can replace a lag with a task to avoid the problems that lags can create. | Milestones Task/resource dependent activities
|
| Lags | Percentage (%) of relationships that have positive lag | Lags are a scheduled delay between activities. It is important to identify lags in the schedule as they can manipulate float and constrain a schedule. You can replace a lag with a task to avoid the problems that lags can create. | Milestones Task/resource dependent activities
|
| Relationship Types | Percentage (%) of relationships that are NOT of Finish-Start type.
|  | Milestones Task/resource dependent activities |
Hard Constraints
| Number of activities with hard or two-way constraints.
| Hard constraints override logical relationships and thereby prevent activities from being scheduled according to the logic. Consider using soft constraints if absolutely necessary. | Task/resource dependent activities Milestones Level of Effort activities WBS summary activities
|
| High Float | Percentage (%) of activities with Total Float greater 44 days |  | Milestones Task/resource dependent activities |
| Negative Float | Percentage (%) of activities with total float less than 0 working days
|  | Milestones Task/resource dependent activities |
| High Duration | Percentage (%) of Activities with duration greater than 10% of the total remaining project duration |  | Milestones Task/resource dependent activities
|
| Invalid Dates | Percentage (%) of activities that have invalid dates
| Activities that have
| Milestones Task/resource dependent activities |
| Missing Resources | Percentage (%) of activities that have either unassigned resources, or assigned resources without a budget.
| Task/resource dependent activities
| |
Missed Tasks
| Percentage (%) of activities that were planned to be completed by the data date in the baseline, but are (i) either still not actualised or (ii) completed but not on time.
| Completed Task/resource dependent activities
| |
| Critical Path Test | If I introduce 1 day of delay in the critical path does the project get delayed by one day? | Milestones Task/resource dependent activities | |
Critical Path Length Index
| Measure of efficiency of current project progress.
|  | Milestones Task/resource dependent activities |
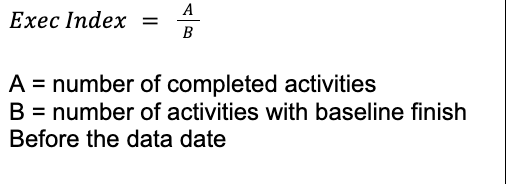
Baseline Execution Index
| Measure how many activities were finished compared to what was planned on the baseline
|  | Milestones Task/resource dependent activities
|
N&L Checks
| Metric | What it Measures | Extra Description | Activities included |
| Logic Density | Average number of logic links per activity
|  | Milestones Completed Task/resource dependent activities |
Isolated Networks
| Percentage (%) of activities that are neither isolated, nor members of the largest component in the network.
|  | Milestones Task/resource dependent activities
|
| High Minimum Free Float | Percentage (%) of Activities with free float greater than 44 days |  | Milestones Task/resource dependent activities
|
| Zero Duration Tasks | Percentage (%) of Activities with duration of 0 |  | Milestones Task/resource dependent activities
|
Circular Logical Dependencies
| Percentage (%) of activities involved in circular logical dependencies within the schedue
|  | Milestones Task/resource dependent activities |
Obsolete Activities | Percentage (%) of activities marked as obsolete, deleted, retired, canceled or superseded in either the Activity Name or the containing WBS name and any of its higher-level WBS. |  | Task/resource dependent activities Milestones Level of Effort activities WBS summary activities Completed activities
|
Out-Of-Sequence
| Percentage (%) of out-of-sequence activities, i.e. with a logical inconsistency in their dates.
|  | Task/resource dependent activities Milestones Level of Effort activities WBS summary activities Completed activities |
| Duplicate Activity ID | Percentage (%) of activities with a duplicate Activity ID, i.e. pairs/triplets of activities in different WBS/projects sharing the same Activity ID. |  | Task/resource dependent activities Milestones Level of Effort activities WBS summary activities Completed activities |
| Critical Activities | Percentage (%) of critical activities, i.e. with a total float less than or equal to zero |  | Milestones Task/resource dependent activities |
| Open Start | Percentage (%) of activities whose relationship to all their predecessors are exclusively of Finish-to-Finish or Start-to-Finish type. | Milestones Task/resource dependent activities | |
| Open Finish | Percentage (%) of activities whose relationship to all their successors are exclusively of Start-to-Start or Start-to-Finish types | Milestones Task/resource dependent activities | |
As Late As Possible Constraints
| Percentage (%) of activities with an As-Late-As-Possible constraint.
| 
| Milestones Task/resource dependent activities |
| Riding Data Date | Percentage (%) of activities whose start date is the same as the data date.
| Milestones Task/resource dependent activities
| |
| Constraints not on milestones | Percentage (%) of non-milestone activities with a hard/soft constraint. | Milestones Task/resource dependent activities | |
| High Duration Critical Activities | Percentage (%) of critical activities with a duration greater than 44 working days | Milestones Task/resource dependent activities | |
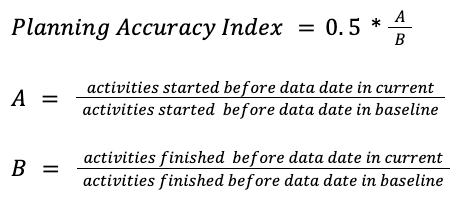
| Planning Accuracy Index | A metric telling you how accurate your plan is compared to the baseie |  | |
| No Predecessors | Percentage (%) of activities without any predecessors. | ||
| No succesors | Percentage (%) of activities without any successors. | ||
| Percentage of milestones | Percentage (%) of activities that are milestones. | ||
| Contraints | Percentage (%) of activities with soft constraints, i.e. of type Must Start/End On or Before, Must Start/End On or After, As Late As Possible. | ||
| SF relationships | Percentage (%) of logical dependencies which are Start-To-Finish (SF). | ||
| FF relationships | Percentage (%) of logical dependencies which are Finish-To-Finish (FF). | ||
| SS relationships | Percentage (%) of logical dependencies which are Start-To-Start (SS). | ||
| FF with predecessor | Percentage (%) of activities with at least one Finish-To-Finish (FF) logical dependency with predecessor(s). | ||
| SF with predecessor | Percentage (%) of activities with at least one Start-To-Finish (SF) logical dependency with predecessor(s). | ||
| SS with predecessors | Percentage (%) of activities with at least one Start-To-Start (SS) logical dependency with predecessor(s). | ||
| SS lag greater than the predecessor duration | Percentage (%) of logical dependencies with Start-To-Start (SS) lag greater than the duration of the predecessor. | ||
| Isolated activities | Percentage (%) of activities with neither predecessor or successor. |
