🏗 EVM & Resources
This screen enables you to:
Track progress and performance through three views:
- EVM based on cost
- EVM based on units
- Progress by units (Daily, Cumulative)
Track Progress: EVM-Cost
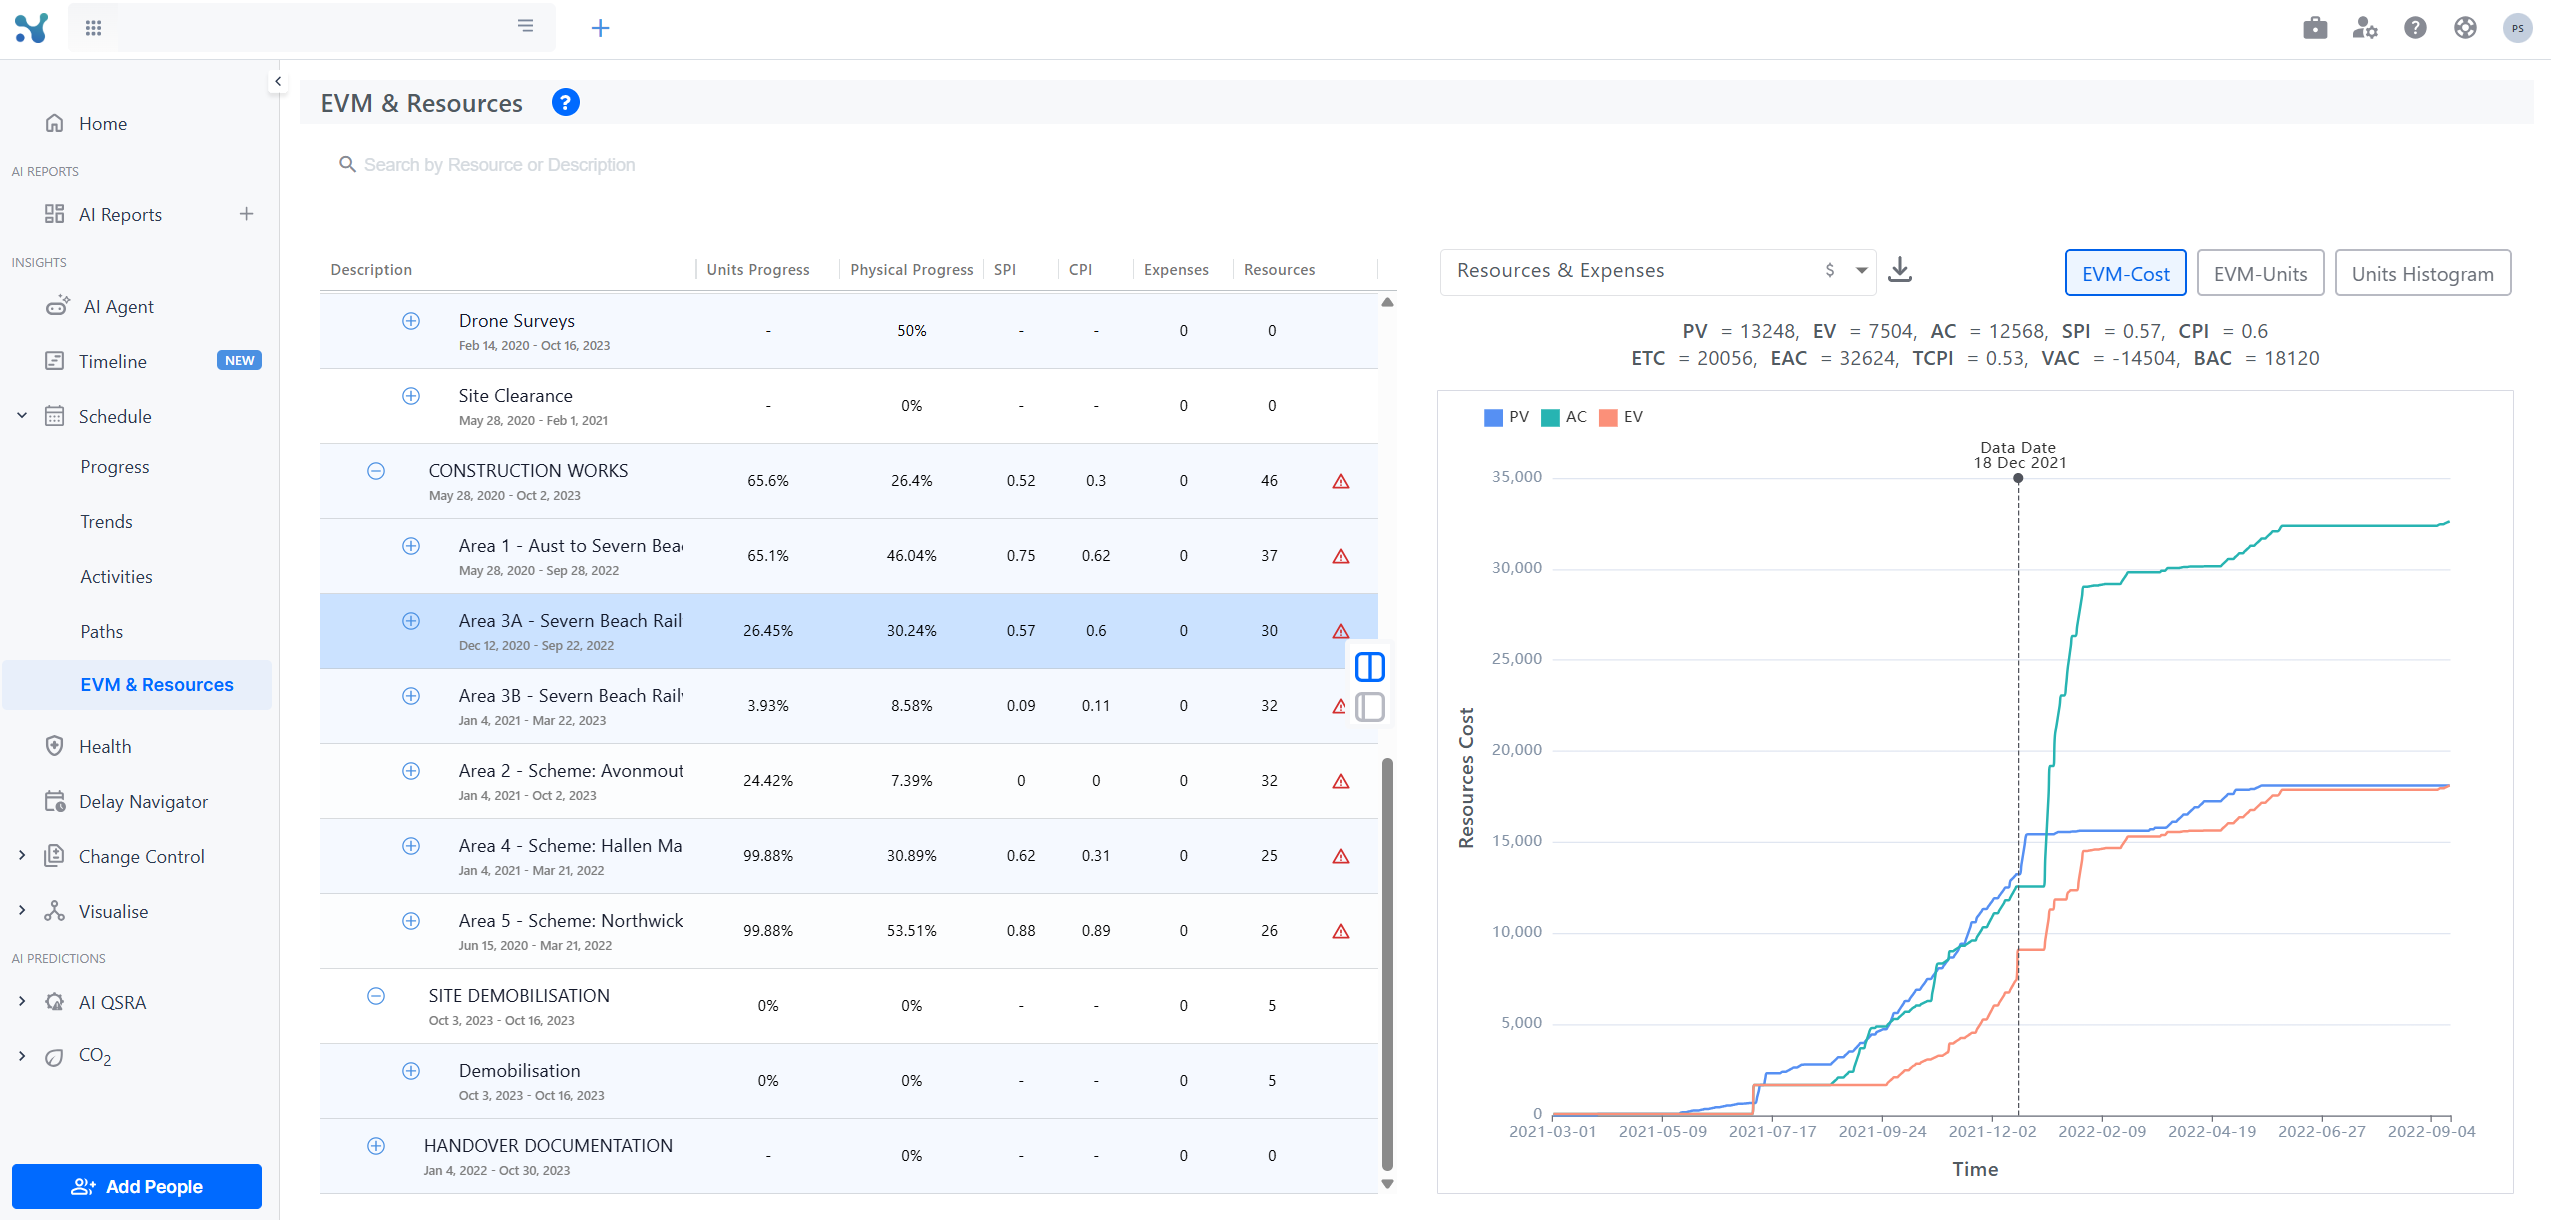
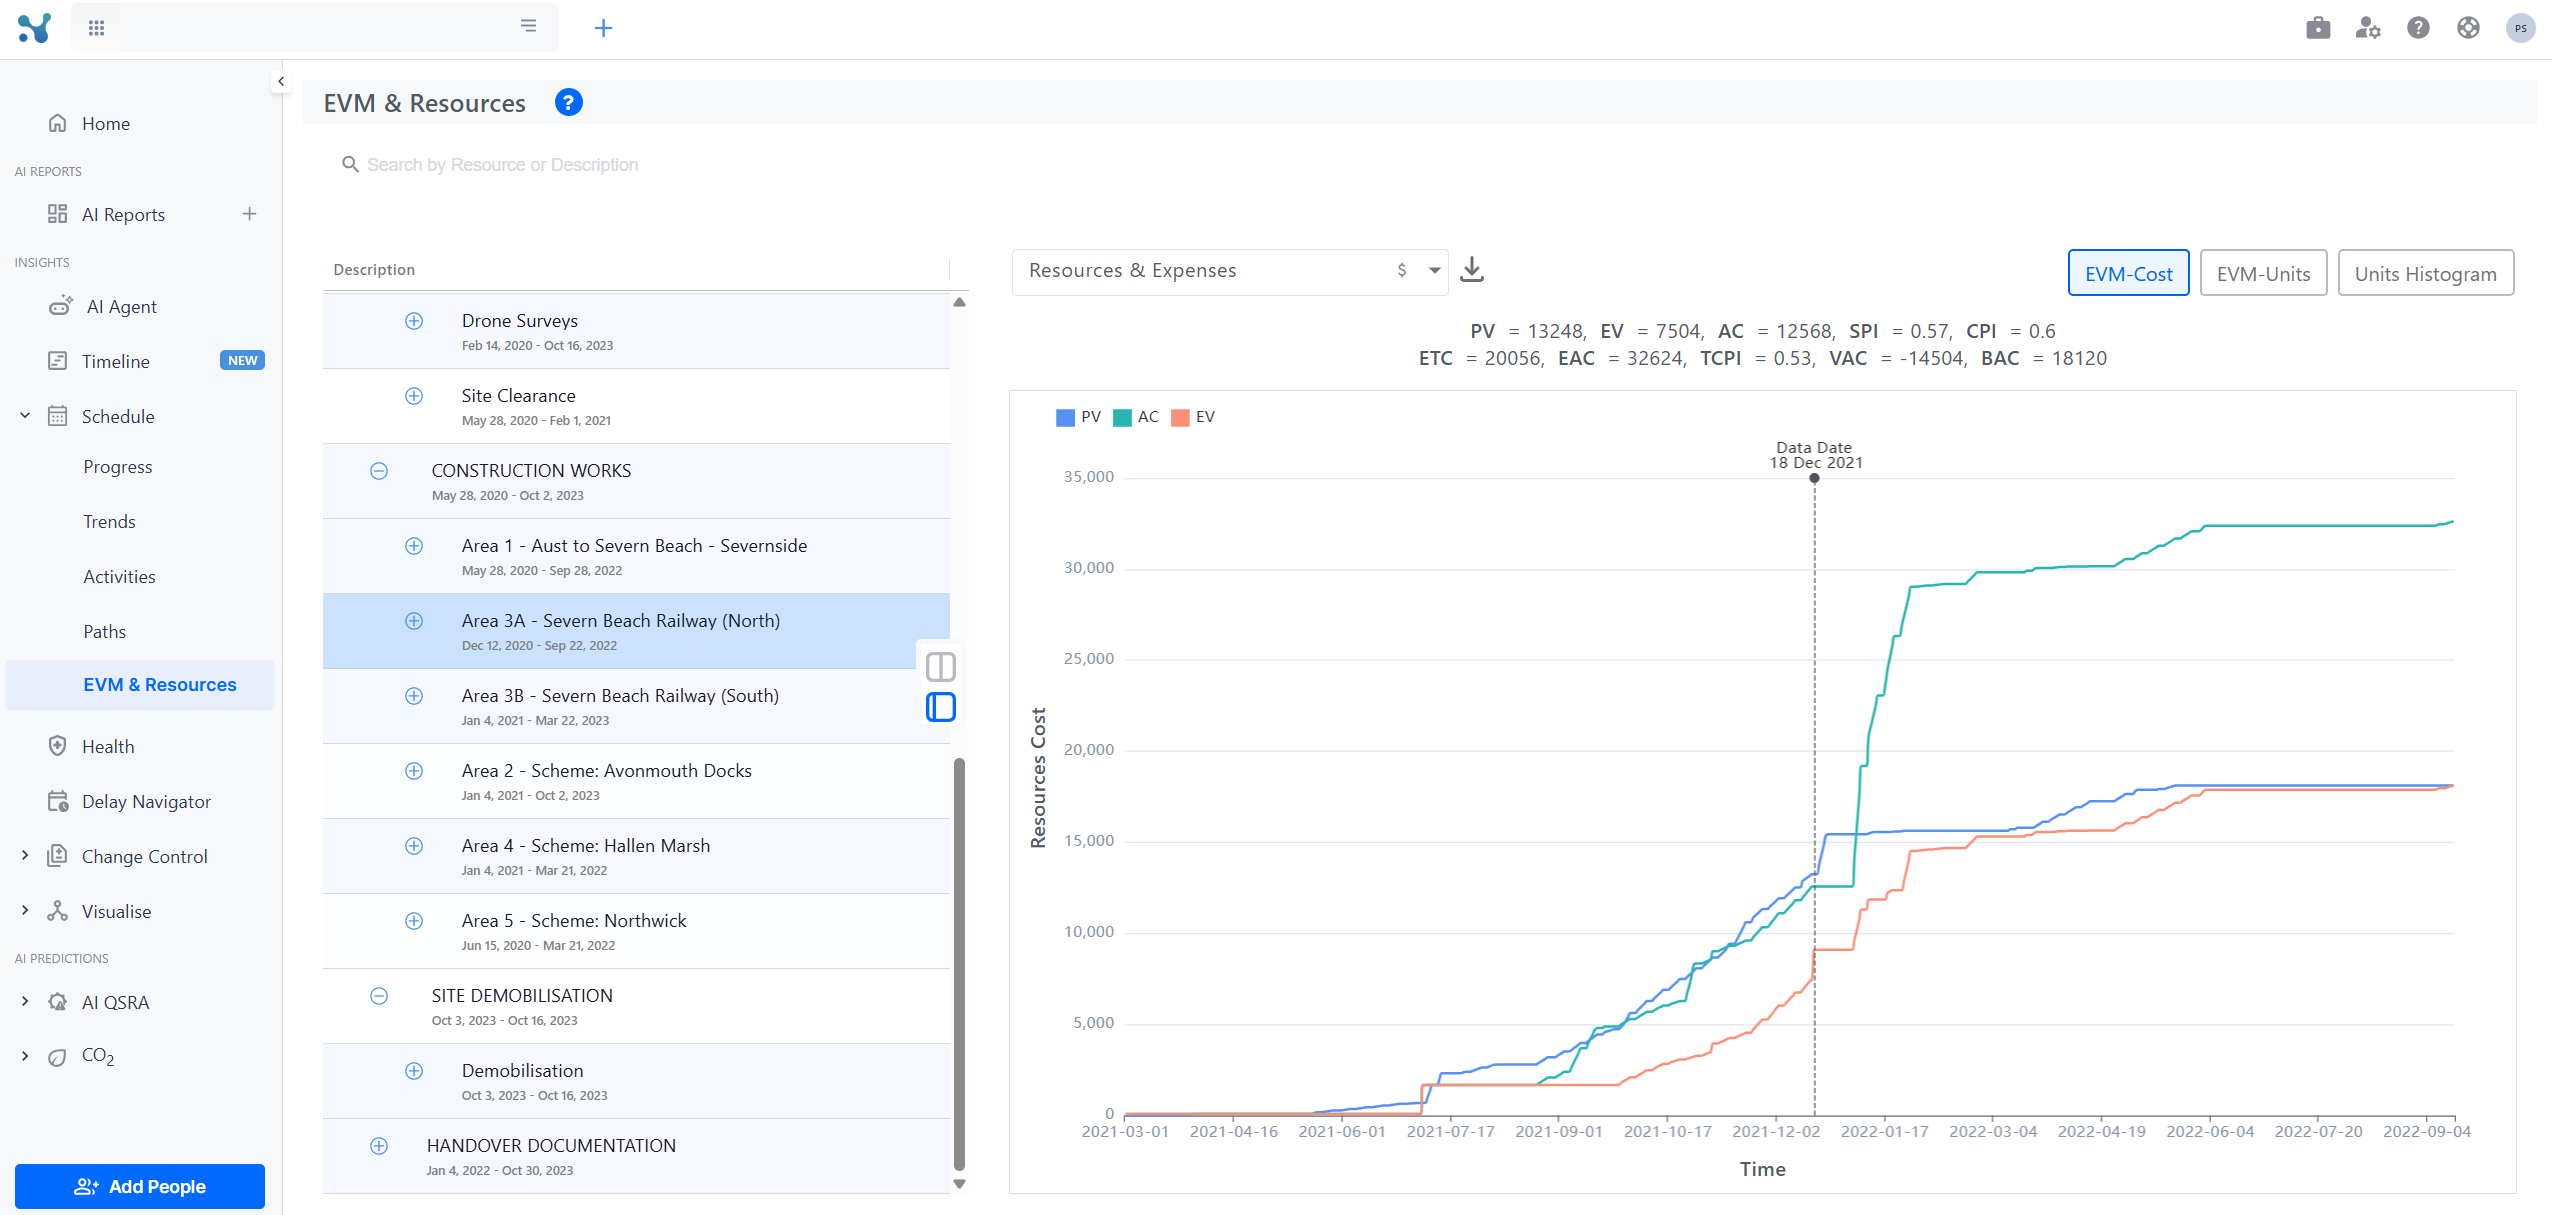
By using the WBS navigation tree on the left, you can check EVM KPIs throughout your project's work breakdown structure. From the overall project down to a singular activity. You can then utilise the chart on the right to narrow down even more by targeting a specific resource.
The metrics offers are:
- Earned Value (EV)
- Actual Cost (AC)
- Planned Value (PV)
- Schedule Performance Index (SPI) = EV/PV
- Cost Performance Index (CPI) = A/PV
- Actual Cost (AC) = Cost of the project so far
- Estimate to Complete (ETC) = expected cost to finish remainder of project
- Estimated at Completion Cost (AC + ETC): Total expected cost for 100% of the project
- Budget at completion BAC: Estimation what the cost will be at completion
- Variance at completion VAC = BAC - EAC : How much the cost will differ at the end
- To Complete Performance Index (TCPI)

Track Progress: EVM-Units
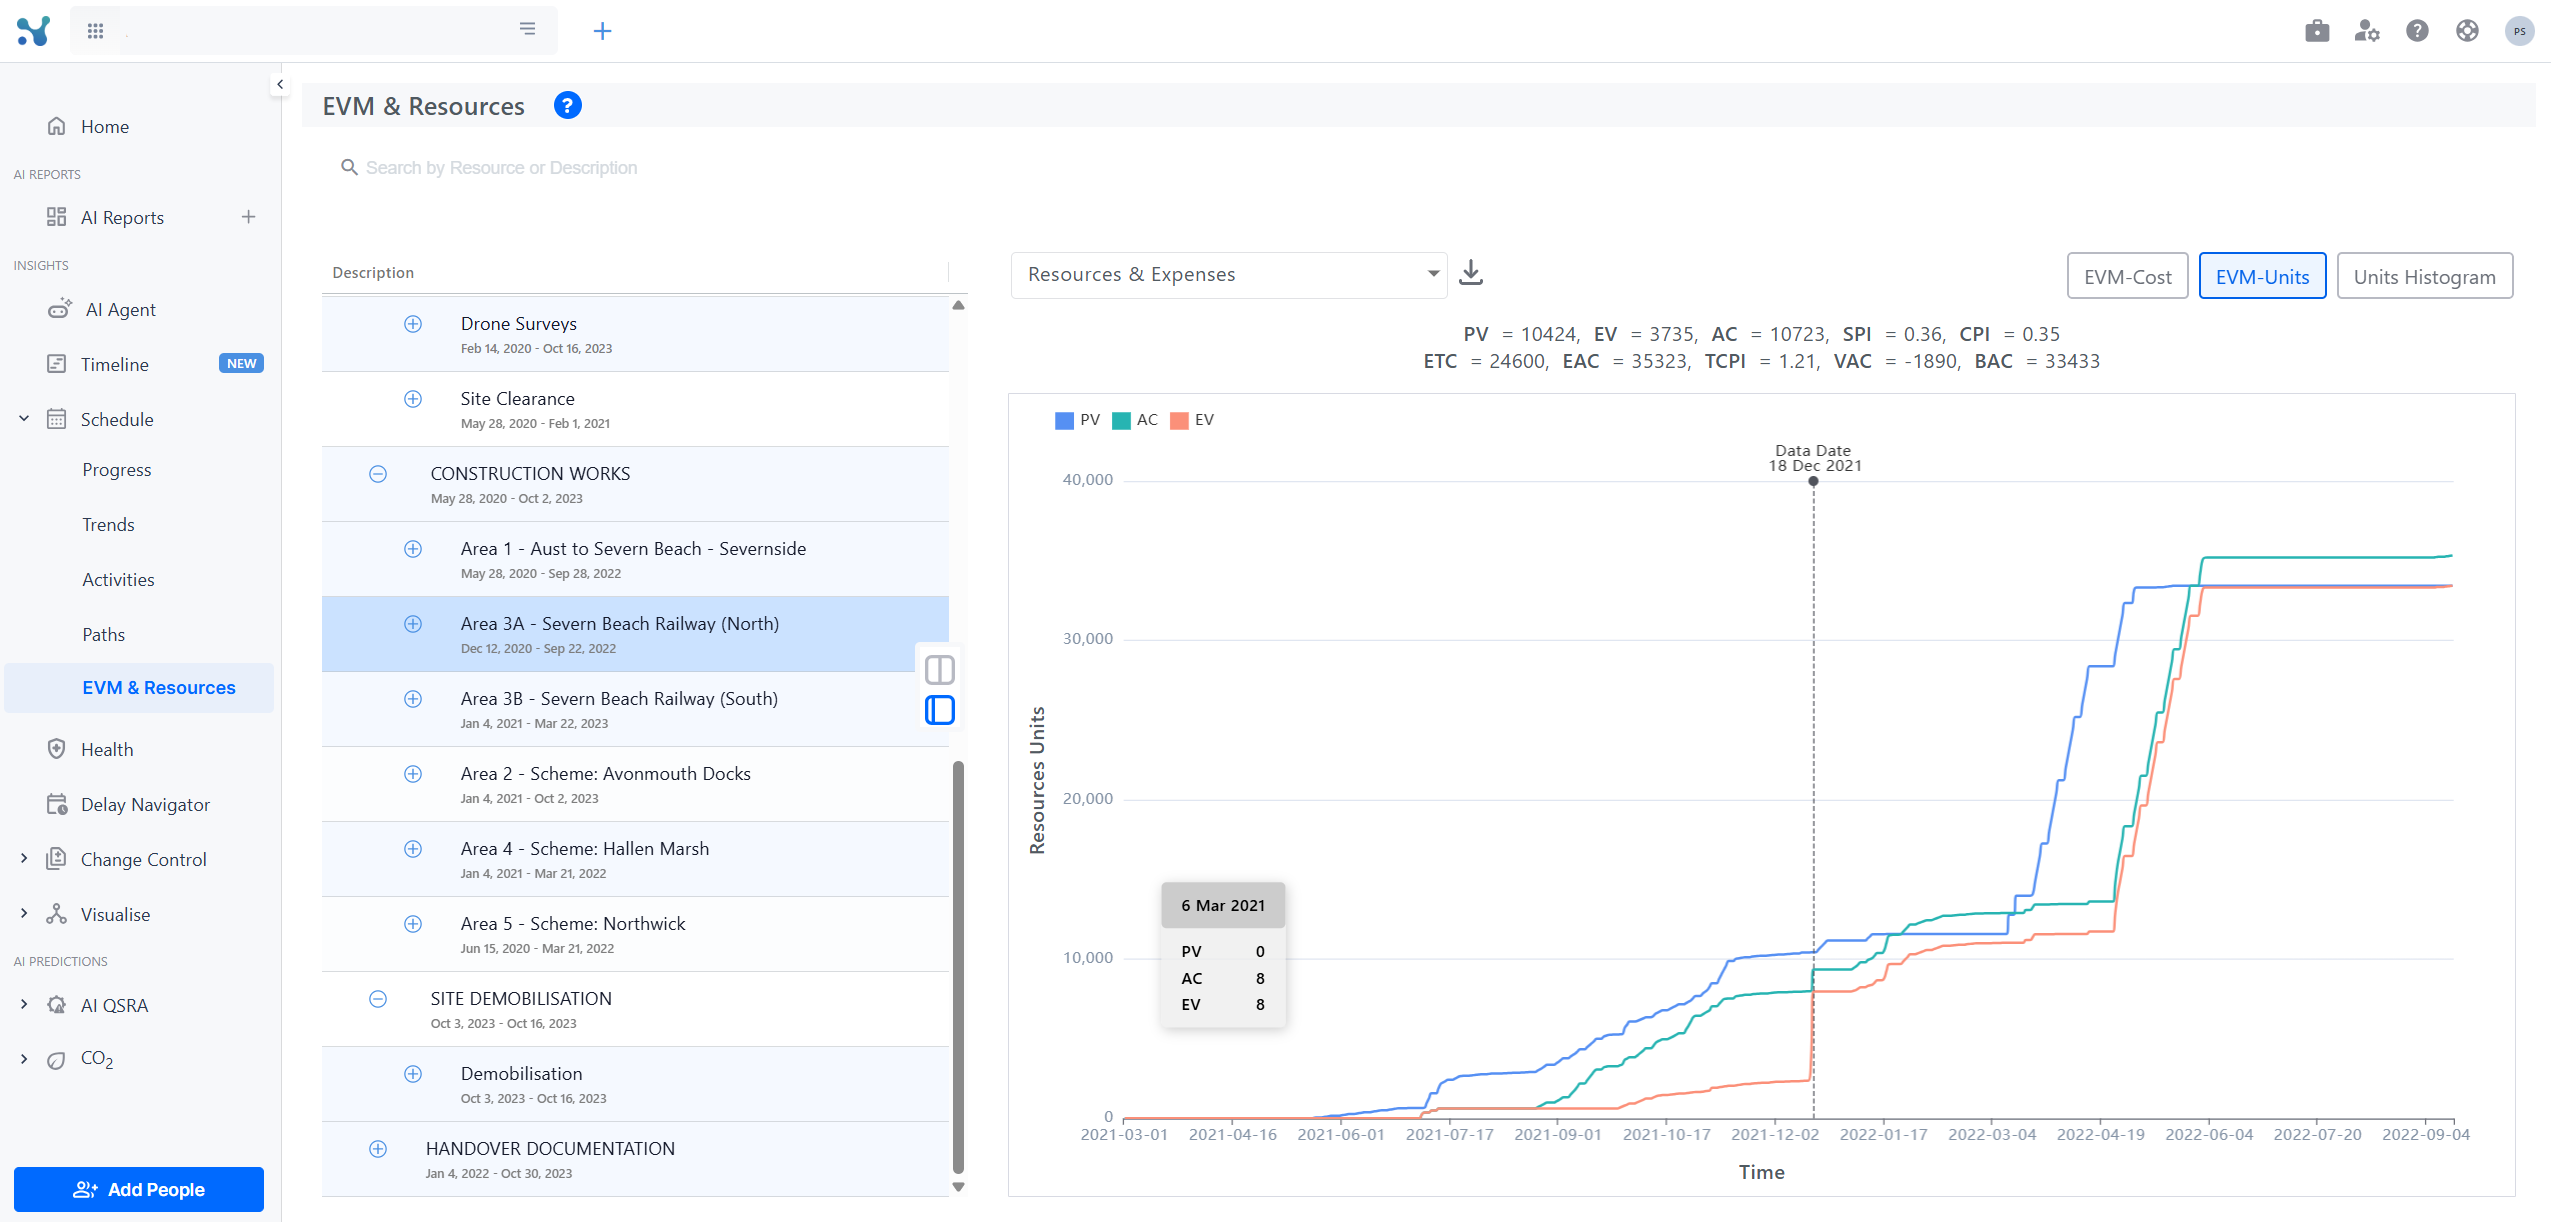
This view mirrors the standard EVM-Cost metrics — EV, AC, PV, SPI, CPI, etc. — but evaluates them based on resource and expense units rather than monetary cost.
Use this mode to assess how efficiently unitized resources are progressing relative to plan.
Track Progress: Units Histogram
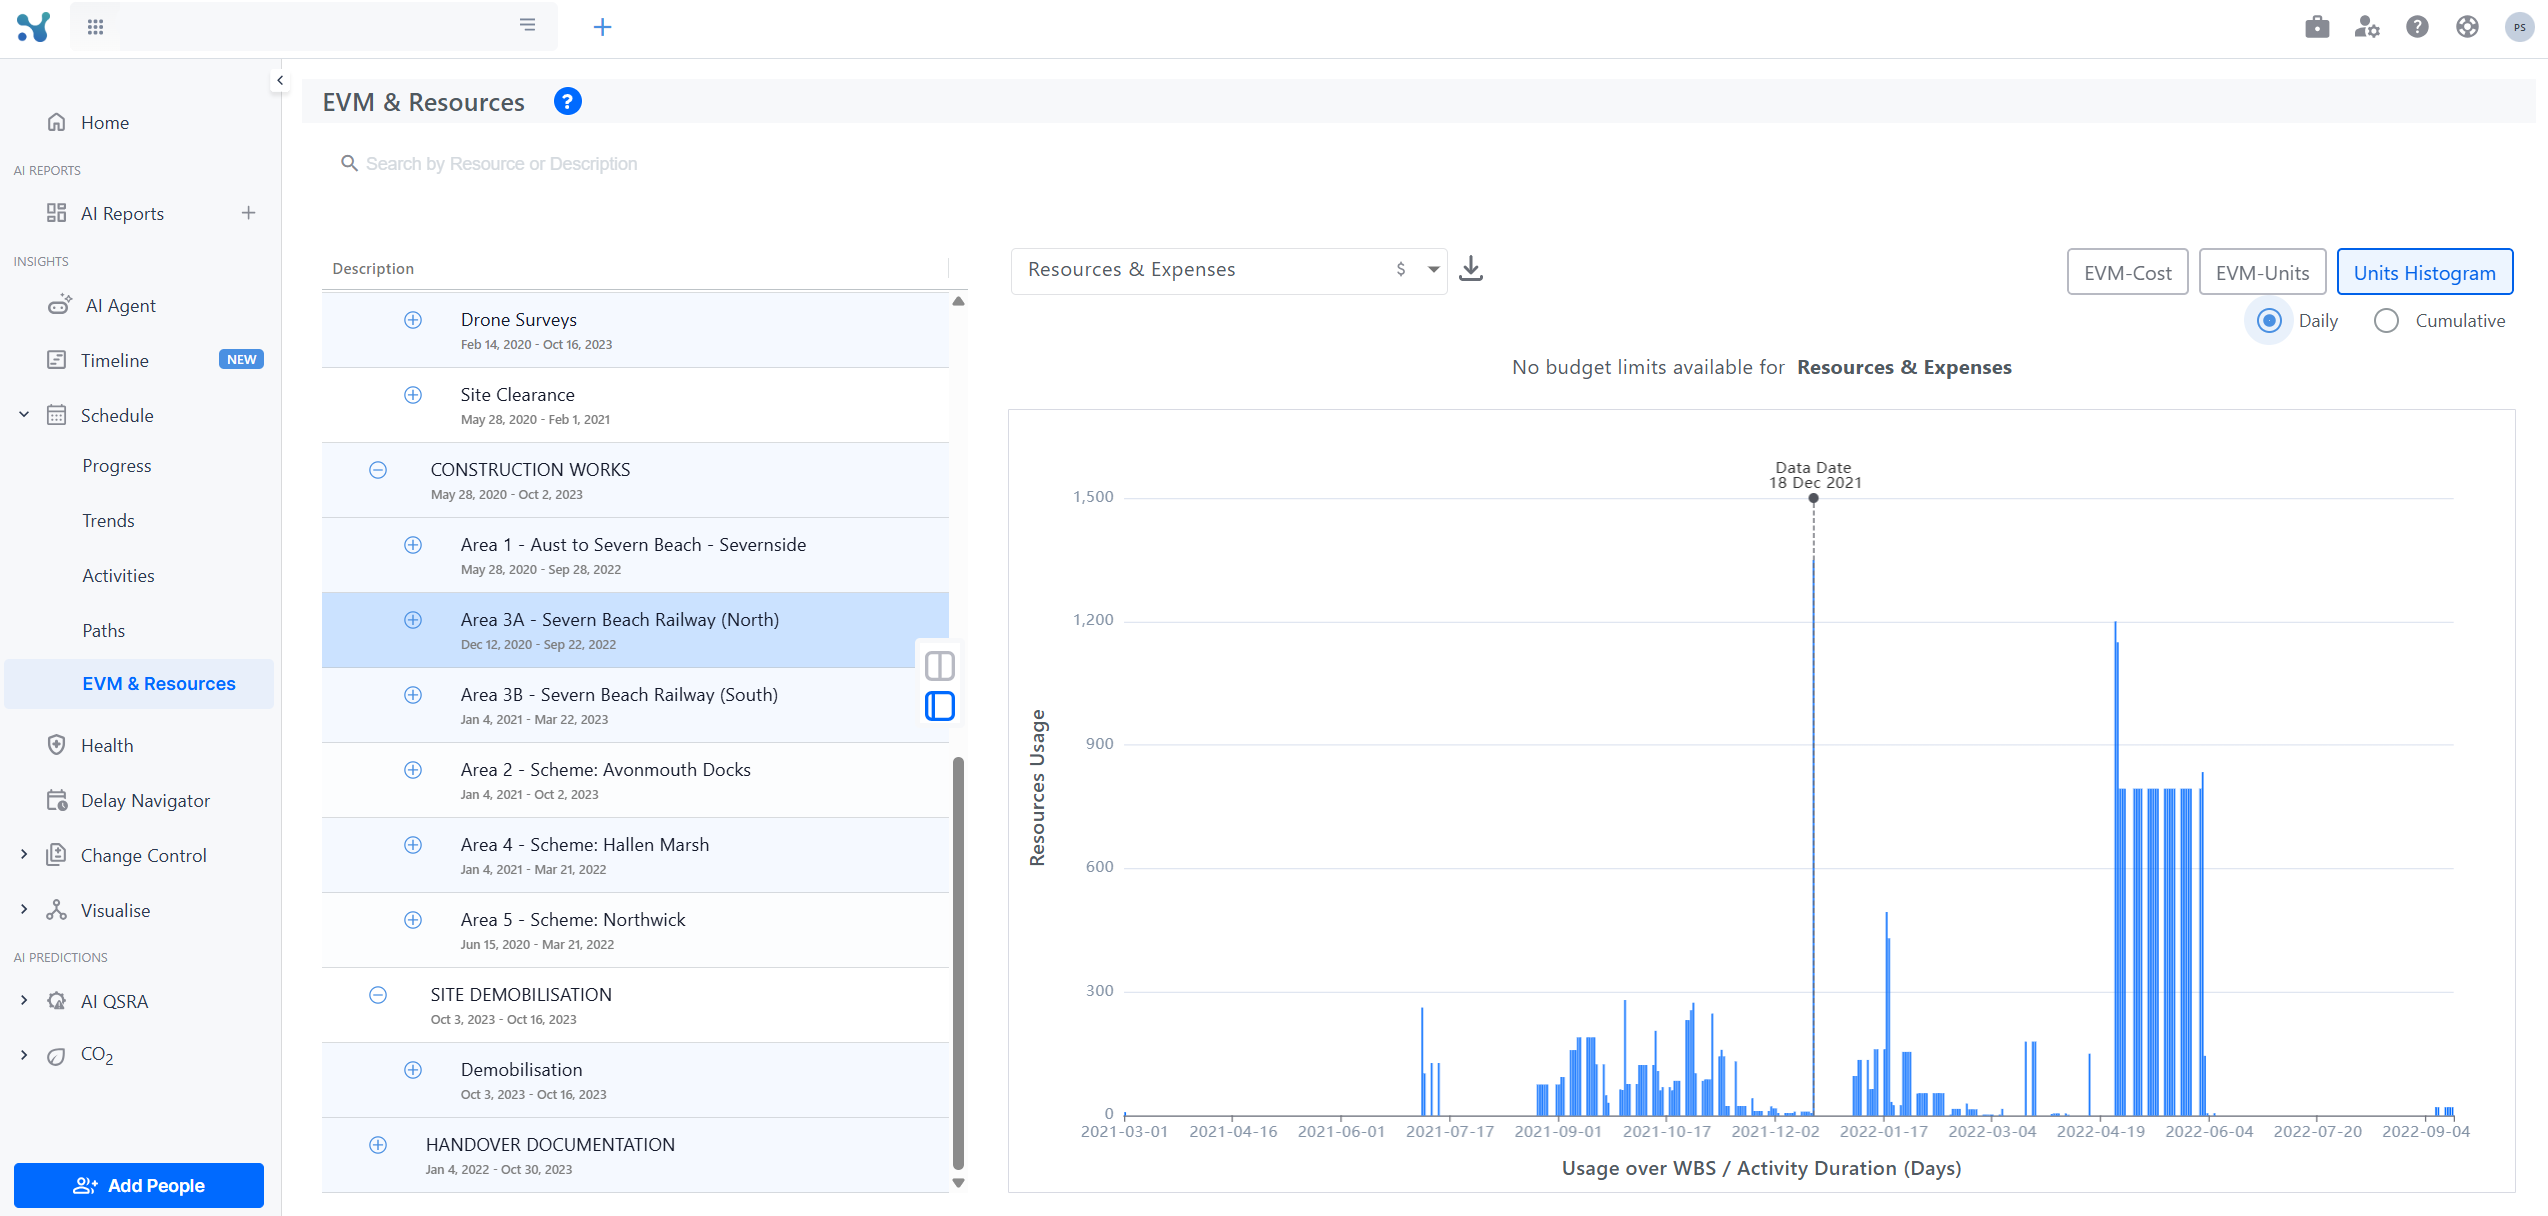
By switching into the Units mode and by enabling the daily view, one can see how many resources they are using daily and if they are over-budget. You can narrow down your research by selecting a single resource from the dropdown.
Each bar represents a day:
- The part of the bar which is blue reports resource utilisation within the budget for that day
- The grey part stands for unused budget for that resource/s.
- The red part the amount of utilisation which went over budget for that day
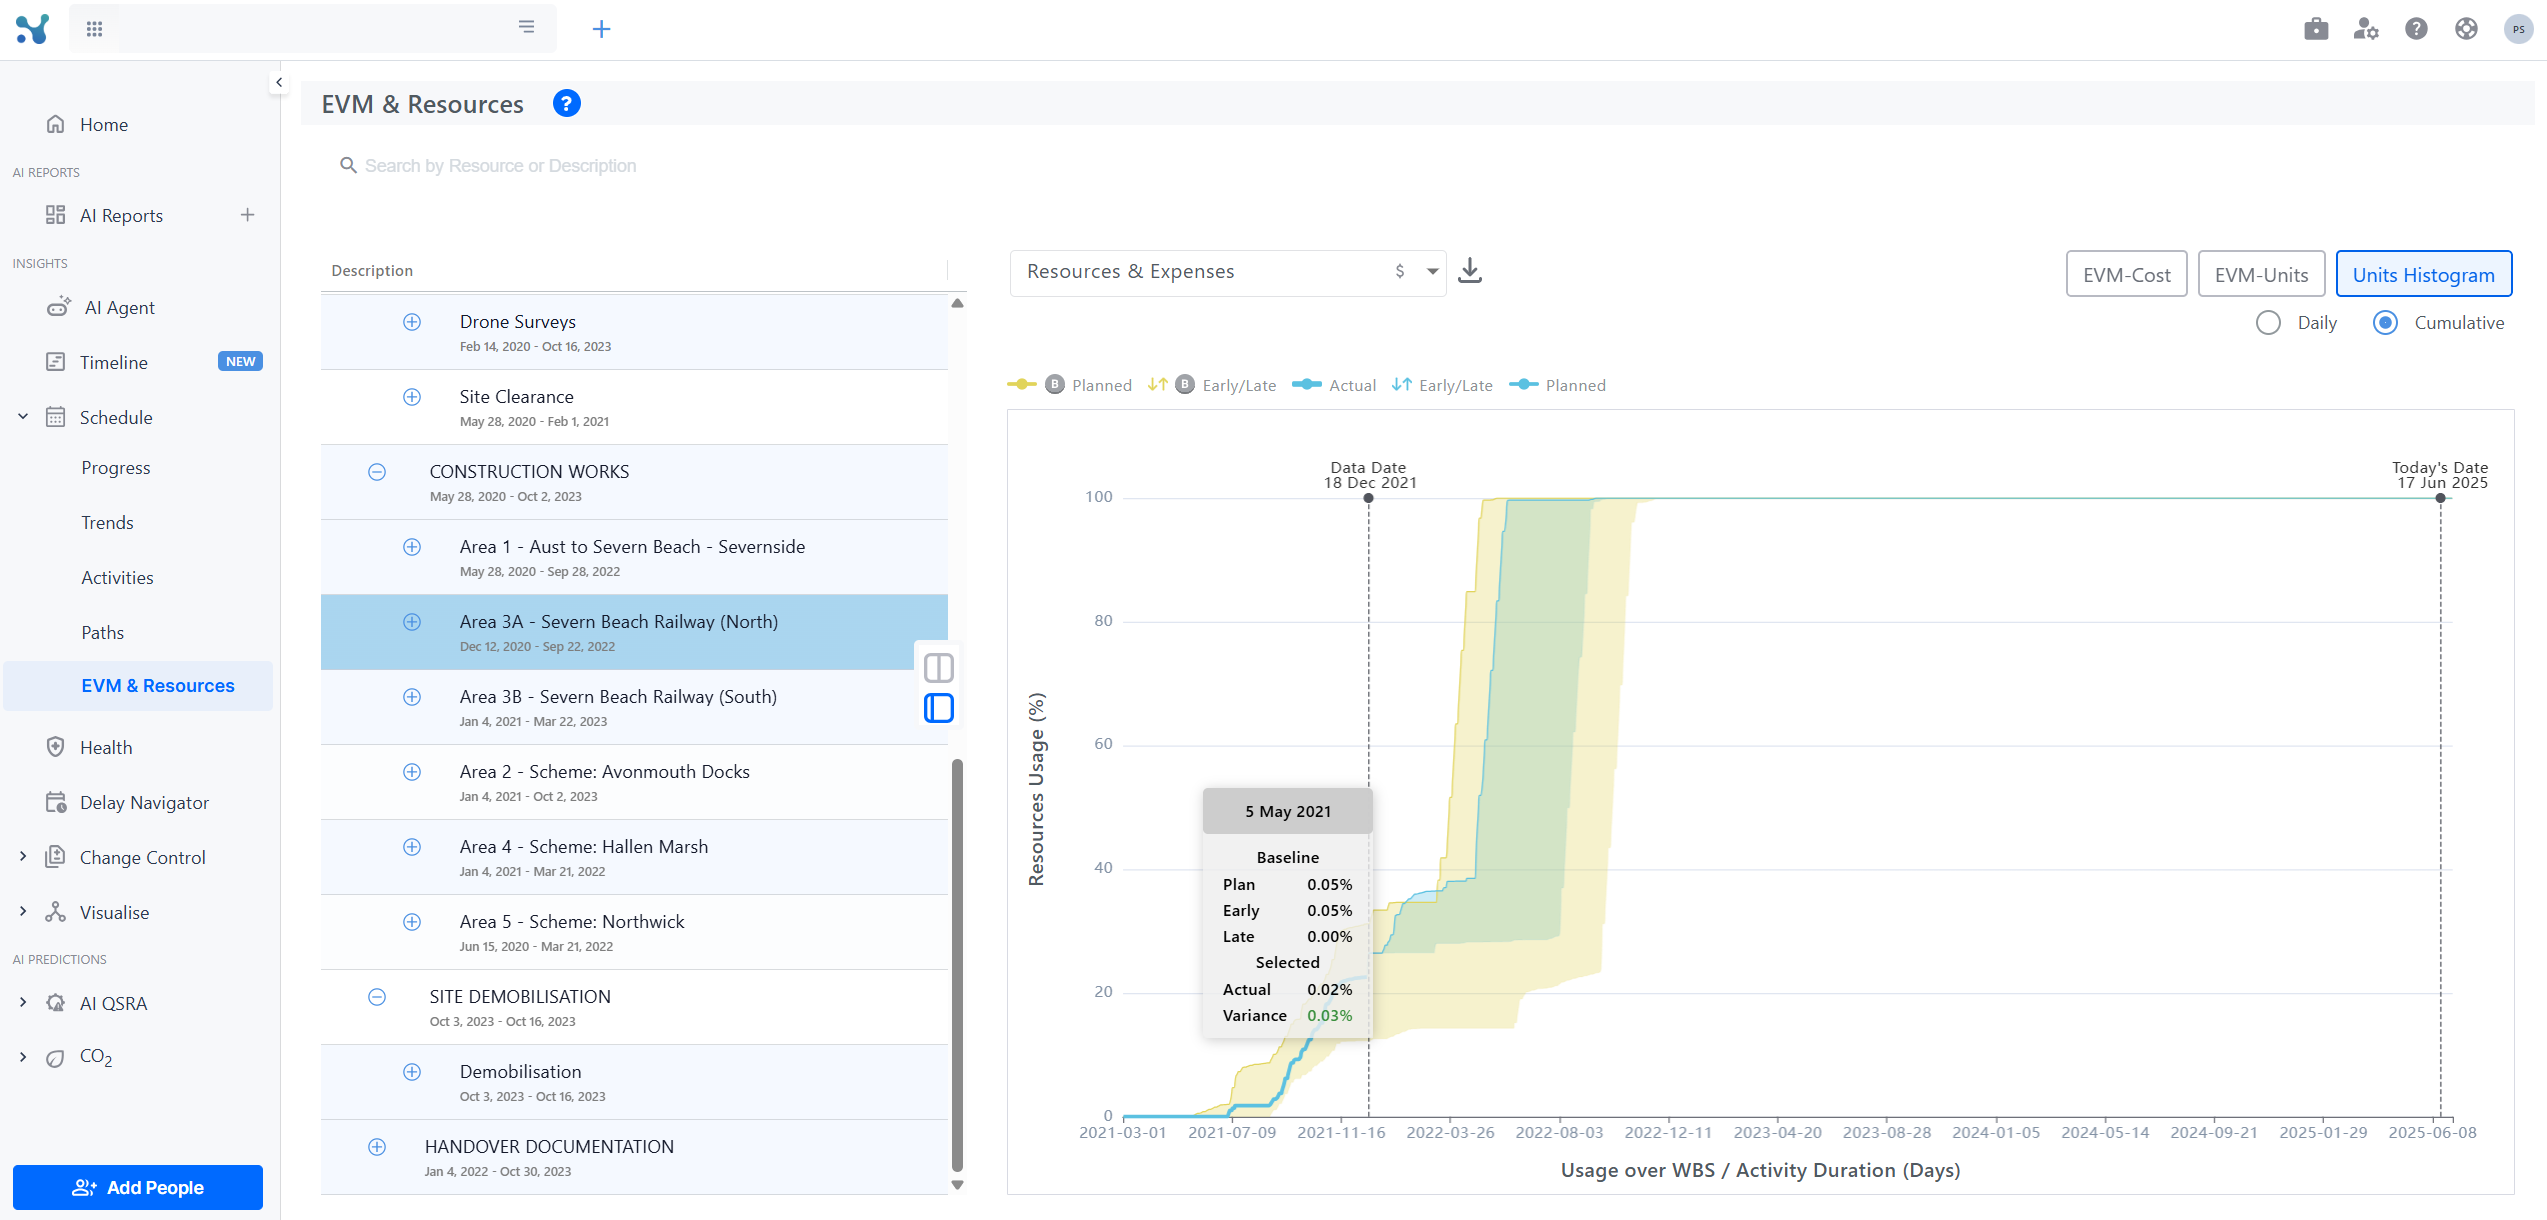
By clicking on Cumulative you see the S-Curve of both baseline's and the currently selected schedule's cumulative progress, units wise.
The WBS navigation tree (when expanded) is accompanied with a really informative table. Within this table you can see for each WBS and activity
- Units progress
- Physical progress
- SPI (at the data date)
- CPI (at the data date)
- Number of associated expenses entries
- Number of resources contained
- Whether any of its contained resources has gone over-budget at least for a single day.
Resource & Expense Filter Dropdown
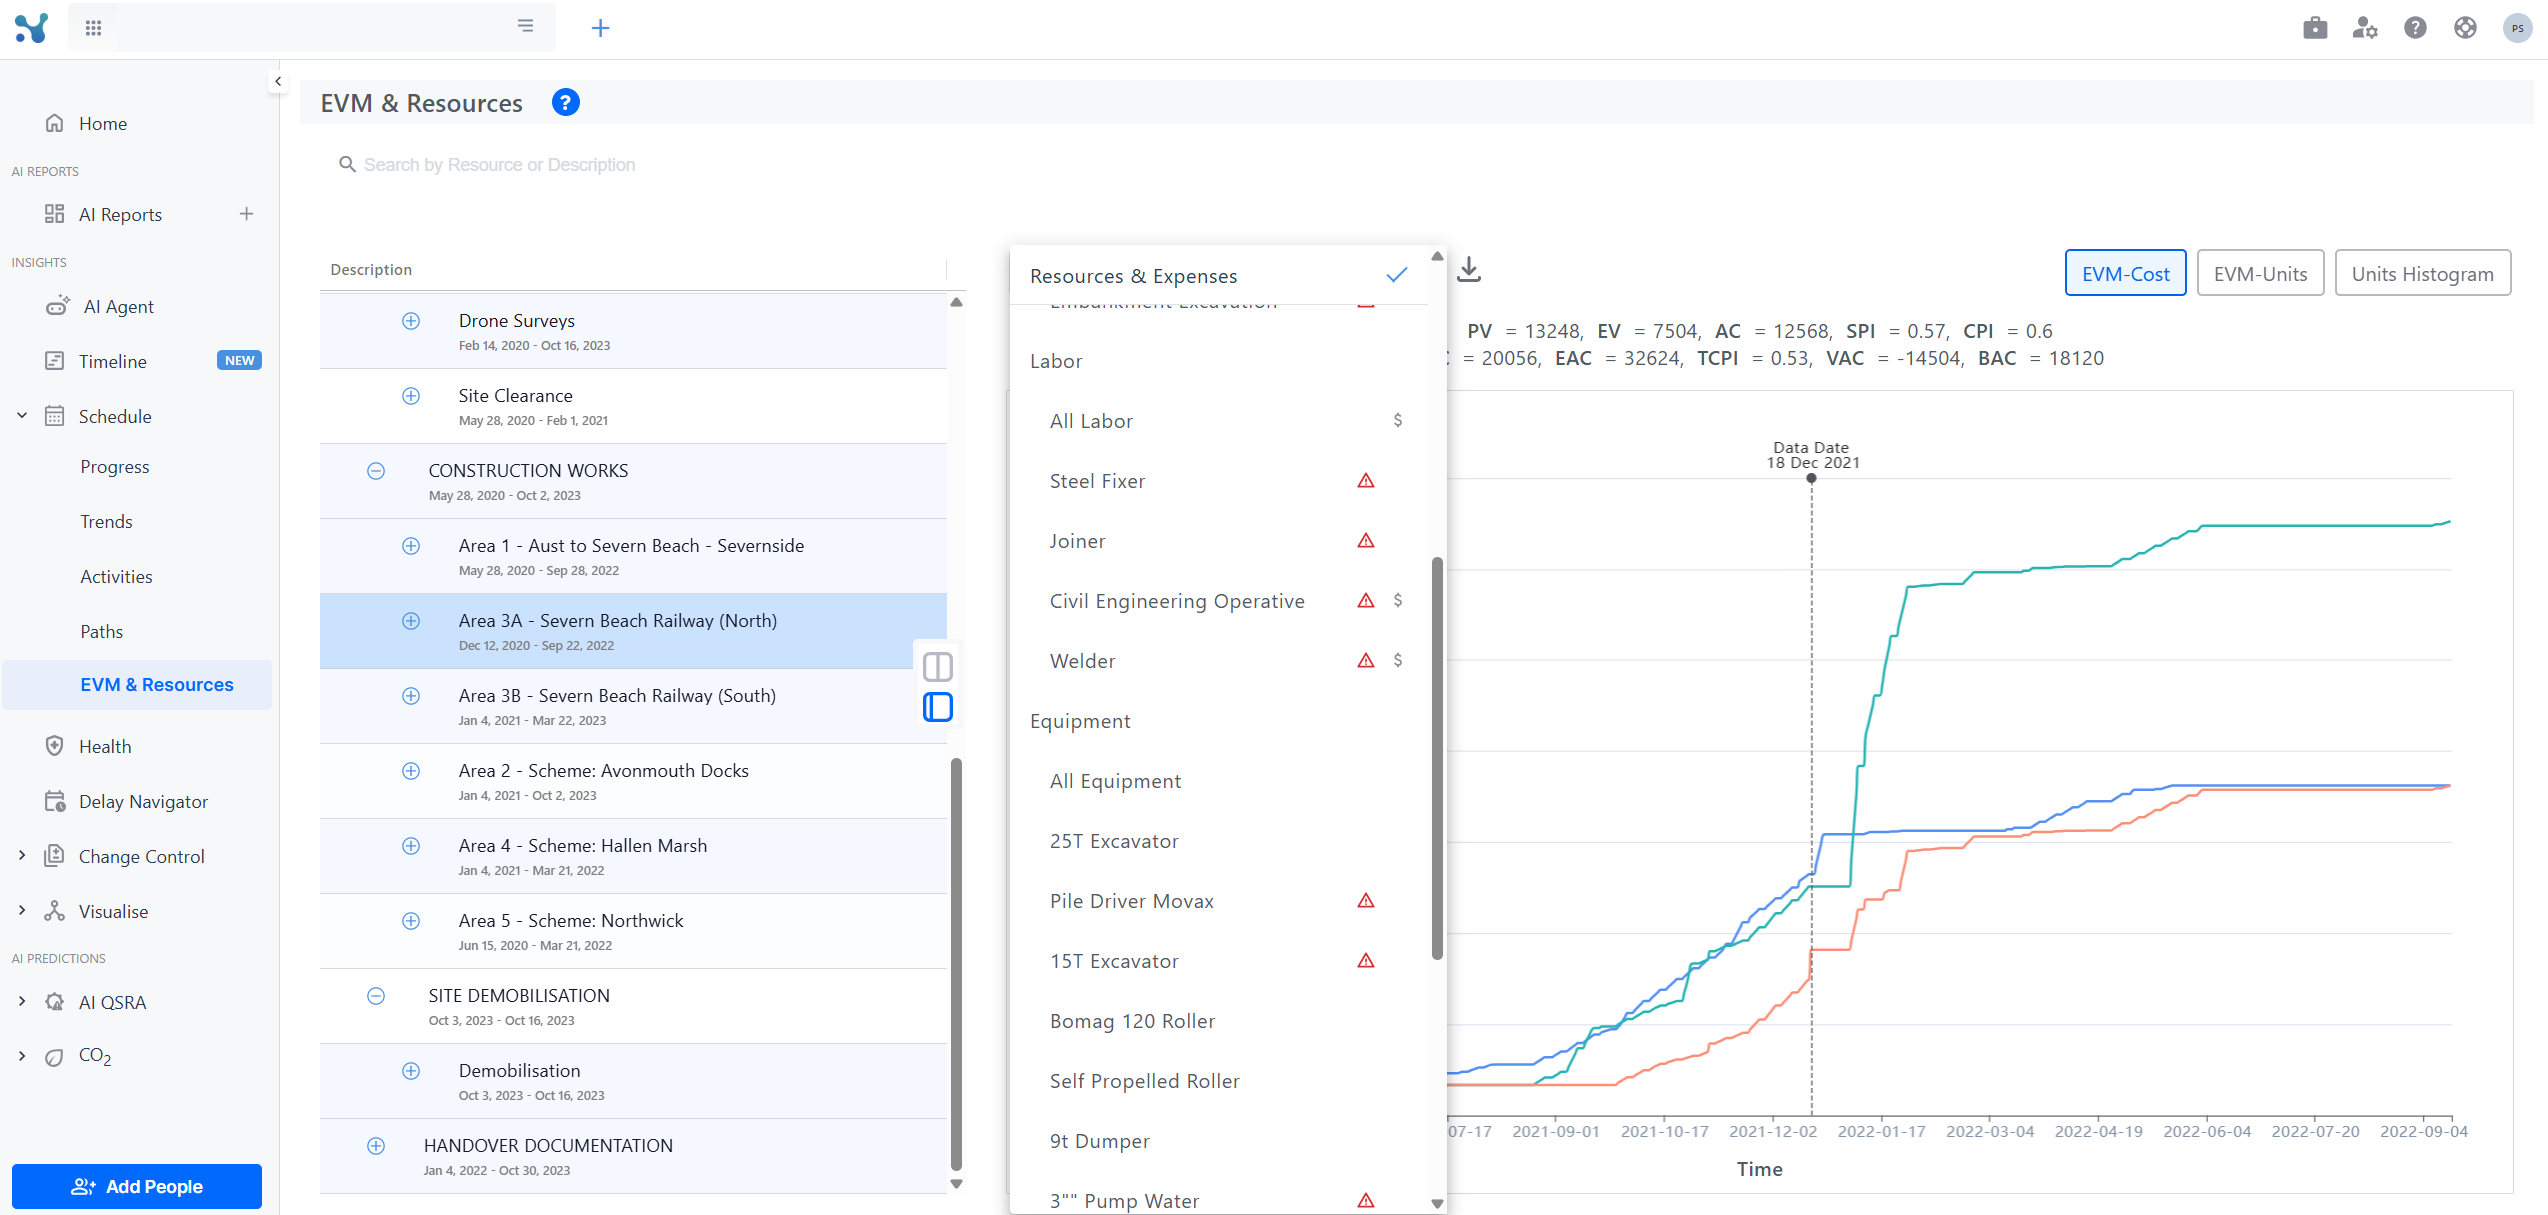
The dropdown filter at the top of the screen enables targeted analysis by allowing users to isolate specific categories of resources and expenses. Items are grouped into categories:
- Labor
- Equipment
- Materials
- Expenses
Each category in the dropdown begins with an "All" option ( such as All Labor, All Materials, All Expenses, All Equipment). These allow for bulk selection of all items within that category for simplified analysis
For the Labor and Equipment categories, an additional "Unassigned" option is available:
- Unassigned Labor
- Unassigned Equipment
Selecting a category or specific item in the dropdown filters all charts and tables on the screen accordingly. This allows users to investigate performance and usage trends for a specific subset of the workforce, equipment pool, material inventory, or expense category.
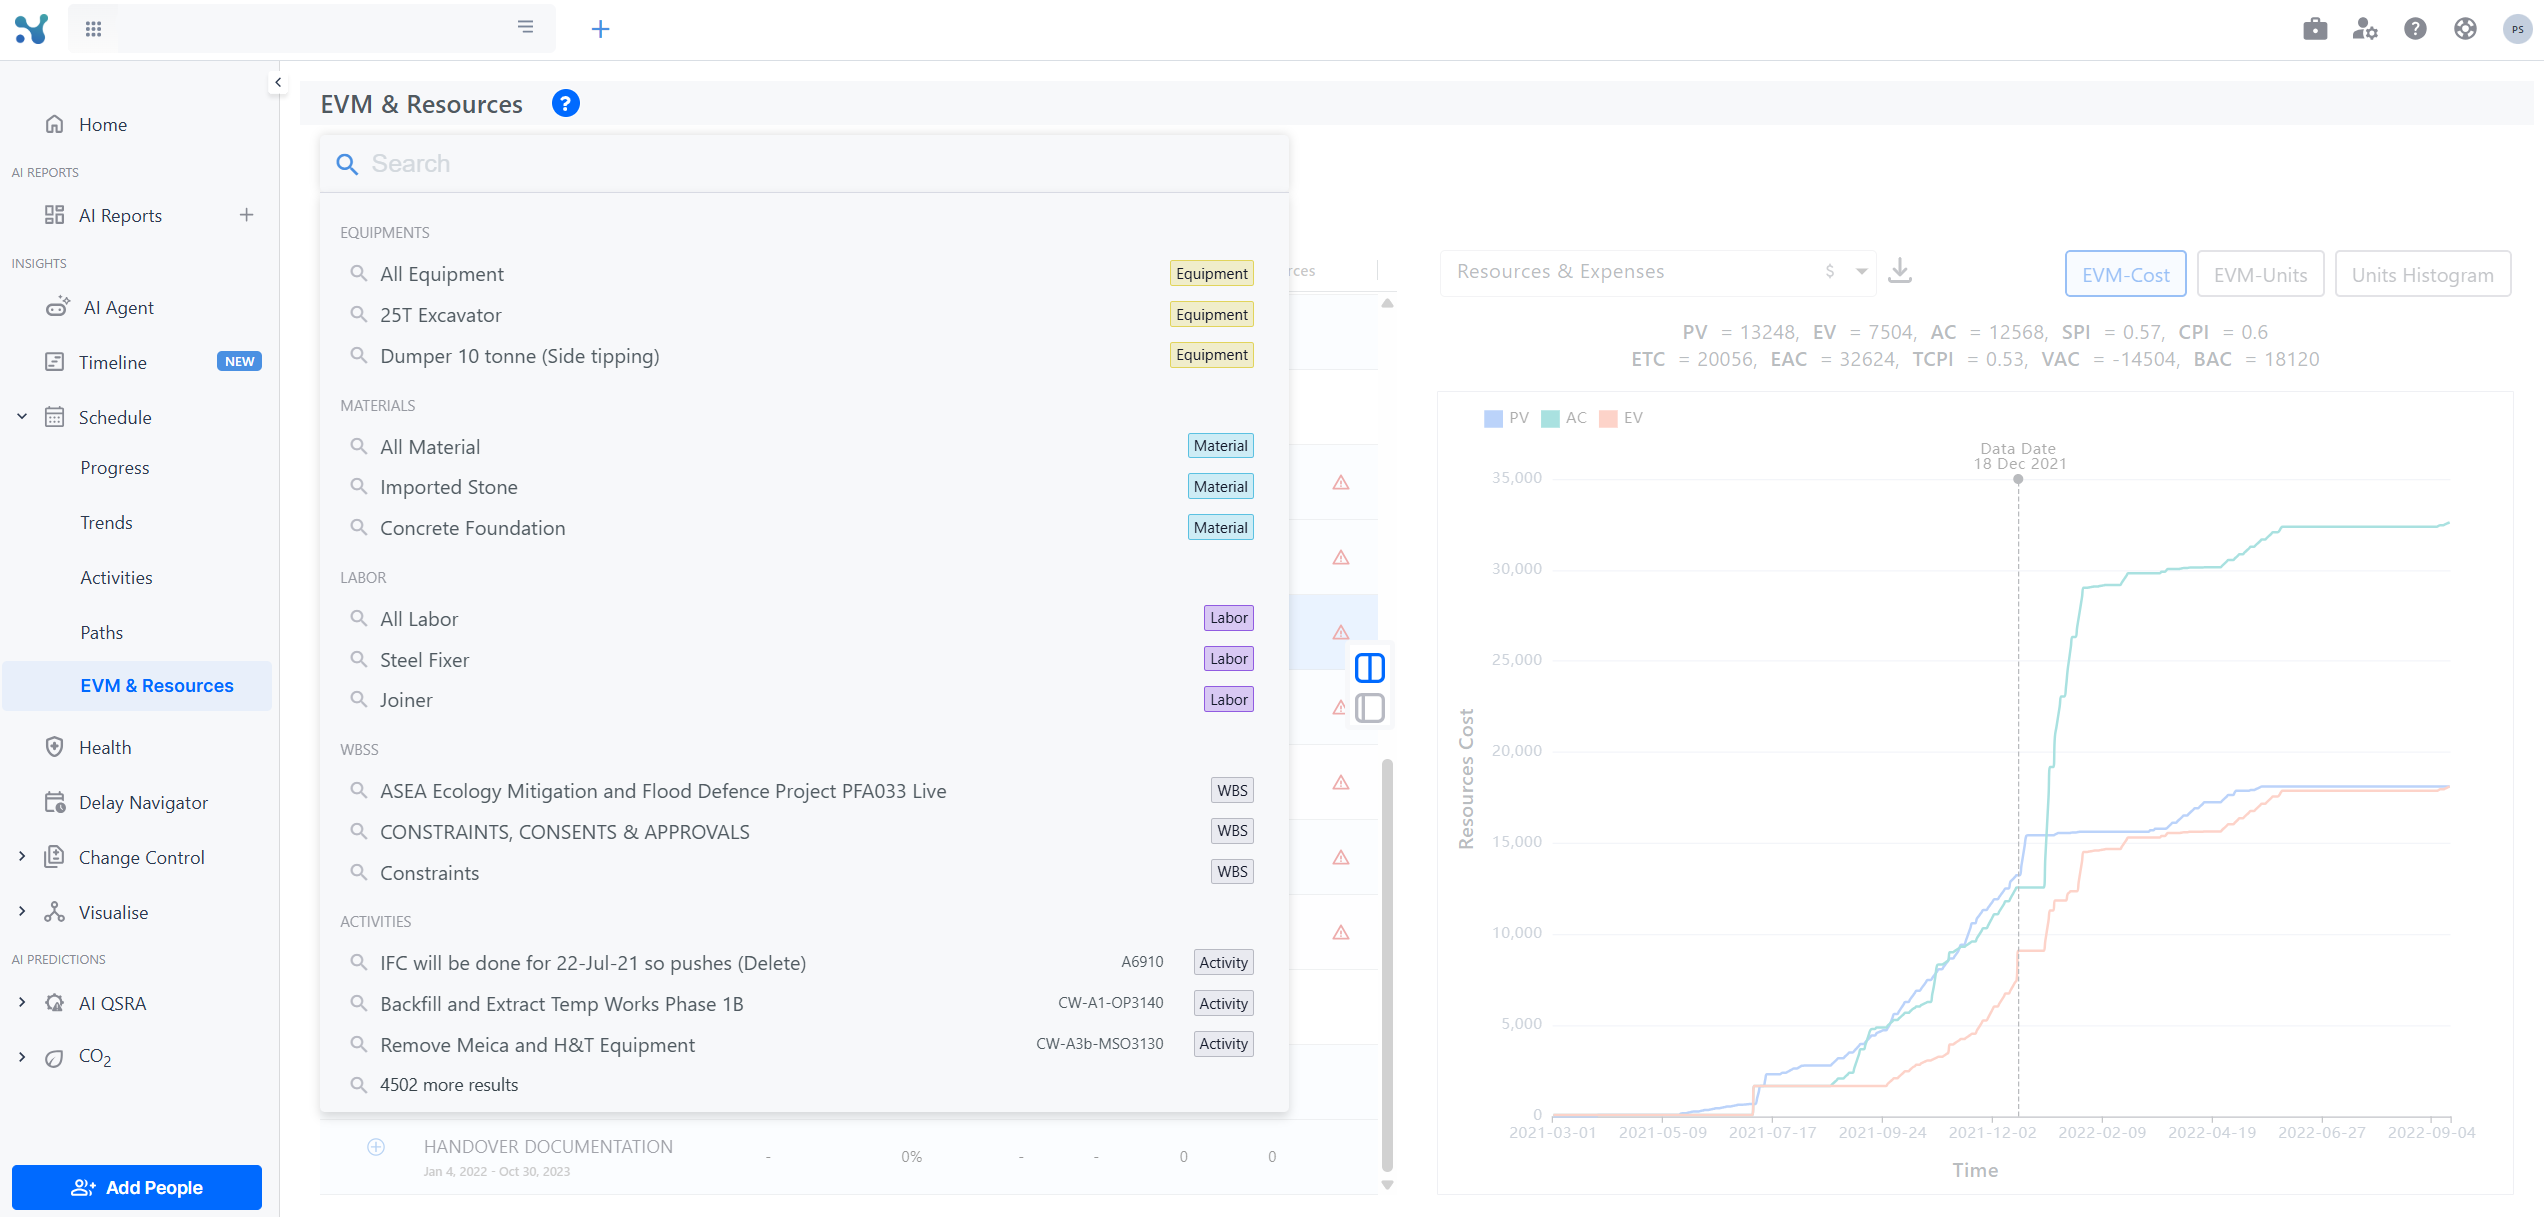
Seach Bar
By utilising the search bar at the top of the page one can narrow down the WBS tree to containing entries related only to a specific search element of choice. That can be:
- A WBS
- An activity
- A material
- Equipment
- Labor
