📈 Progress
This screen enables you to:
- Focus on the WBS is are impacted the most
- Access key progress KPIs
- Drill to the activity level
Focus on the WBS that is impacted the most
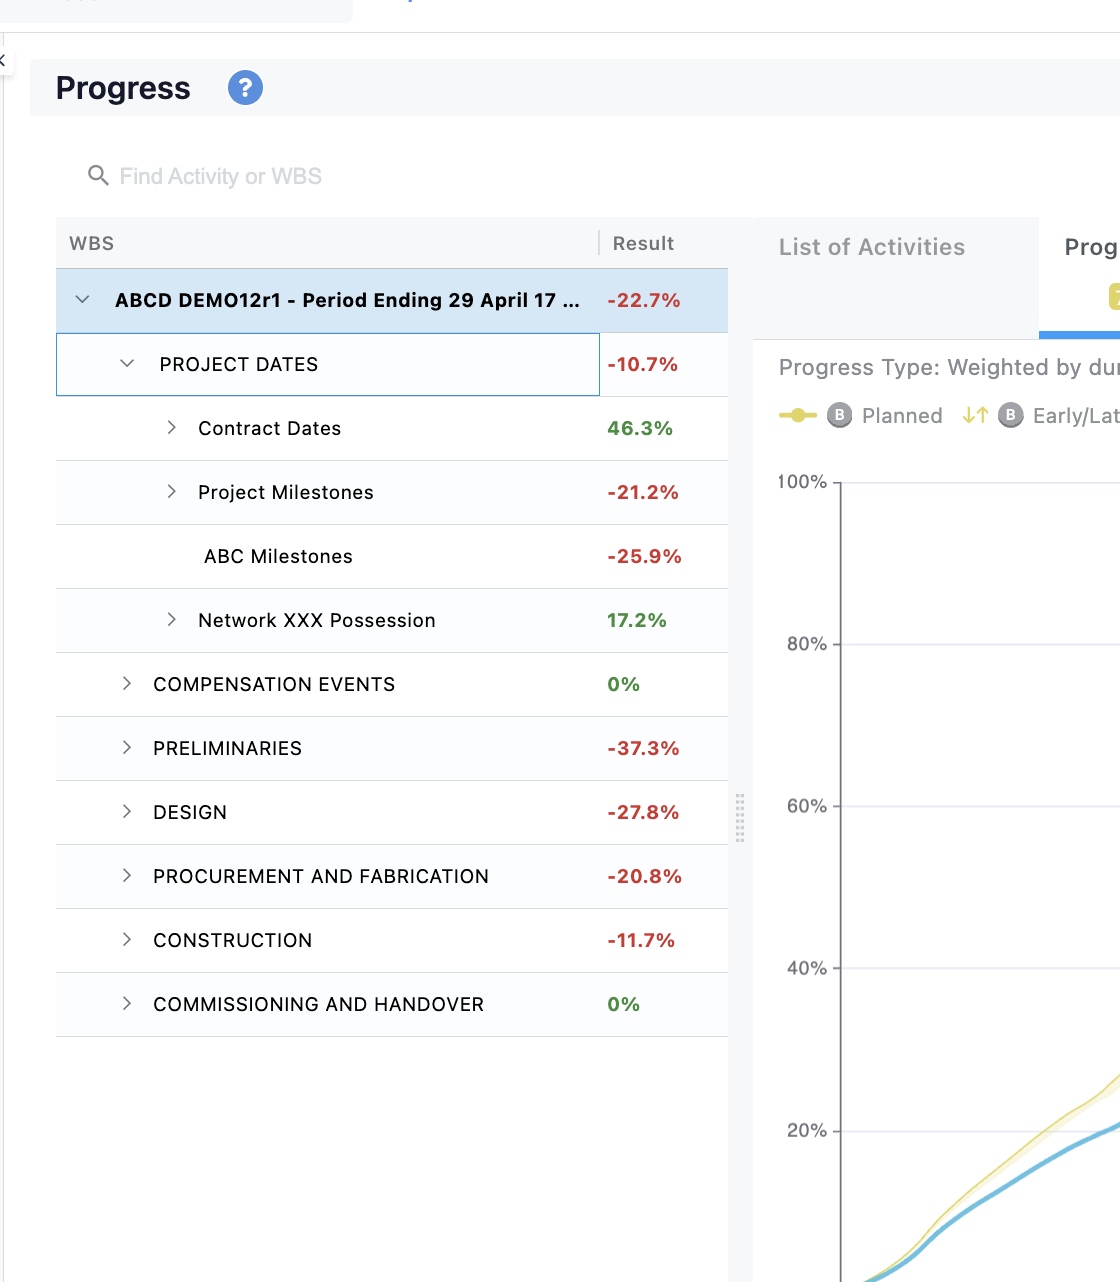
You can track the Progress performance of your project and WBS/Activity Codes by the left hand side. The number shows the difference between baseline and current progres.
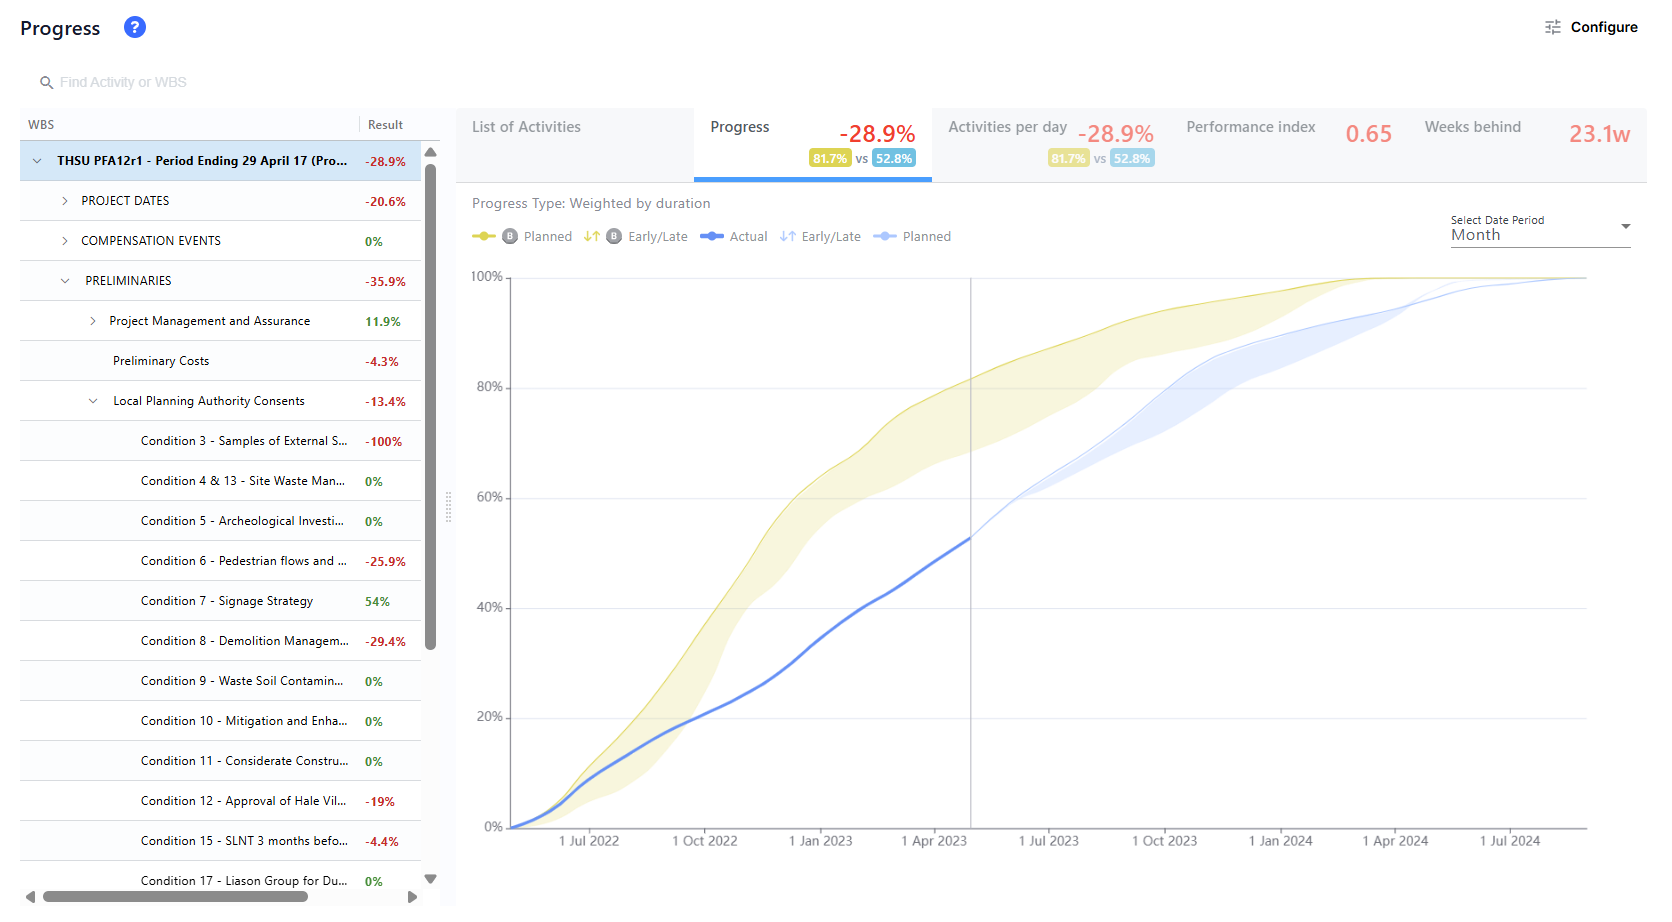
You can expand and navigate to additional levels within a WBS (or Activity code) by using the slider or the expansion arrows!
Configuring the screen
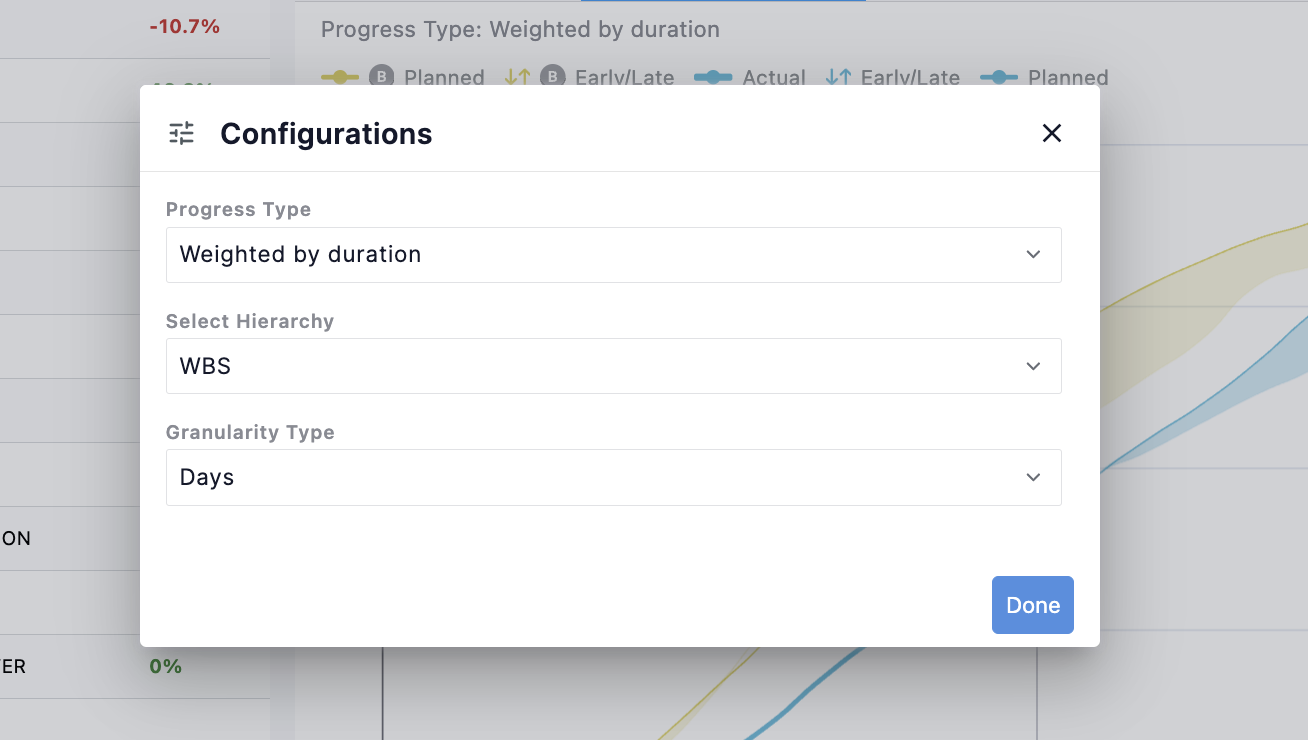
By clicking on the configuration button you can change:
- Progress Type: Choose to measure the duration in days or number of activities completed.
- Hierarchy: You can choose between WBS or any Activity Codes hierarcyh you may have
- Granularity Type: Whether the results will be in days or in days,hours and minutes.
Access key progress KPSs
For every selected WBS (or Activity Codes) there are 5 Progress KPIs available, each of which is briefly explained in the interactive visual. For each of those KPIs, you can also see how that KPI of your current schedule compares with your baseline. These are:
Progress S curve
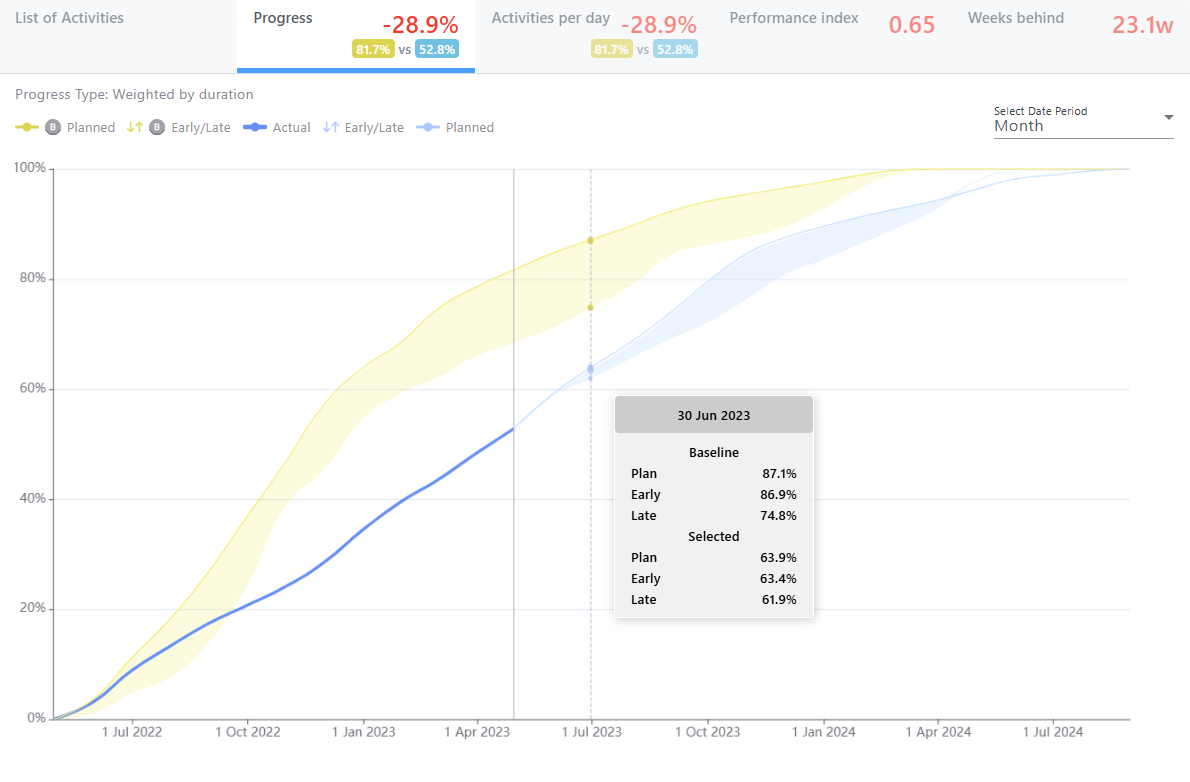
Represents the completion of the project over time. Yellow color is the baseline, blue is the current schedule. Everything here is compared to the baseline. If the yellow line is above the blue line. it means that your current schedule is delayed compared to the baseline. For example, you can see that according to the baseline the project was supposed to be 74.9% while the current schedule is 52.3% which means that we are 22.7% delayed.
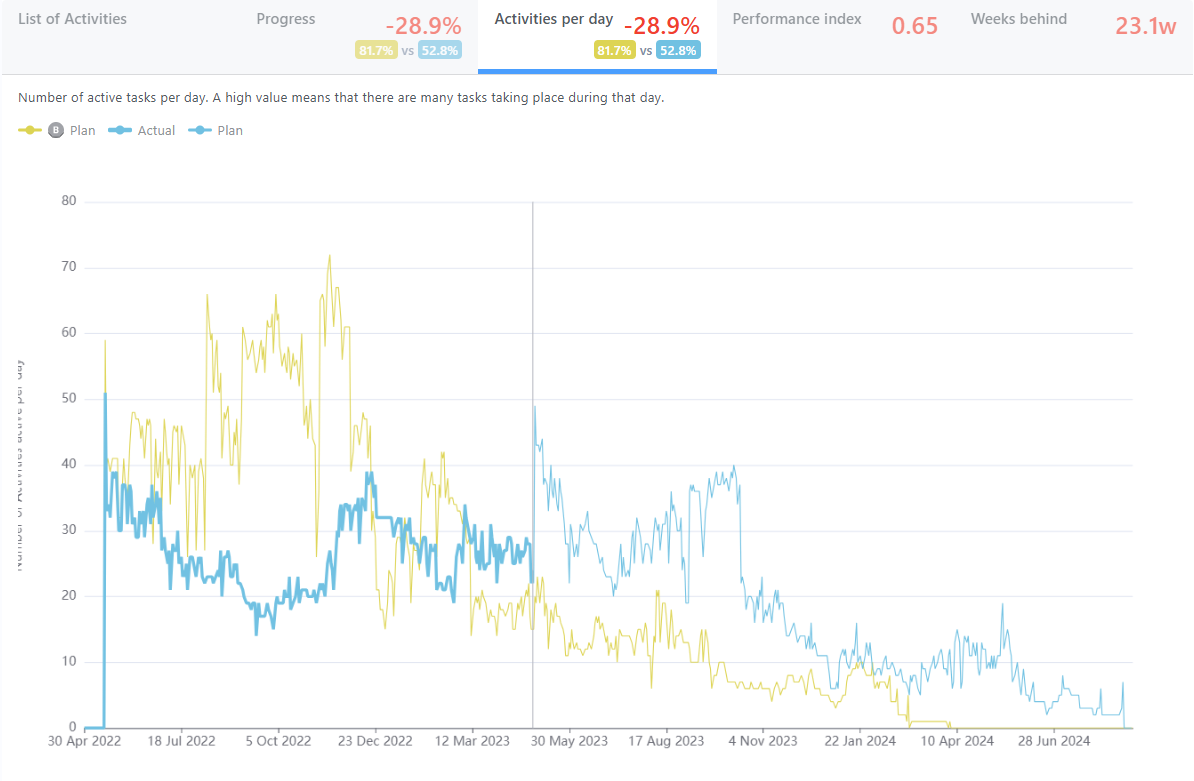
Activities per day
How many activities are being completed per day. Yellow color is the baseline and blue is the selected schedule. By hovering over one can see how many activities were supposed to be completed according to the baseline and according to the selected schedule. For example in this case we see that this is a project falling behind in relationship with the baseline and they try to make up for it in the future.
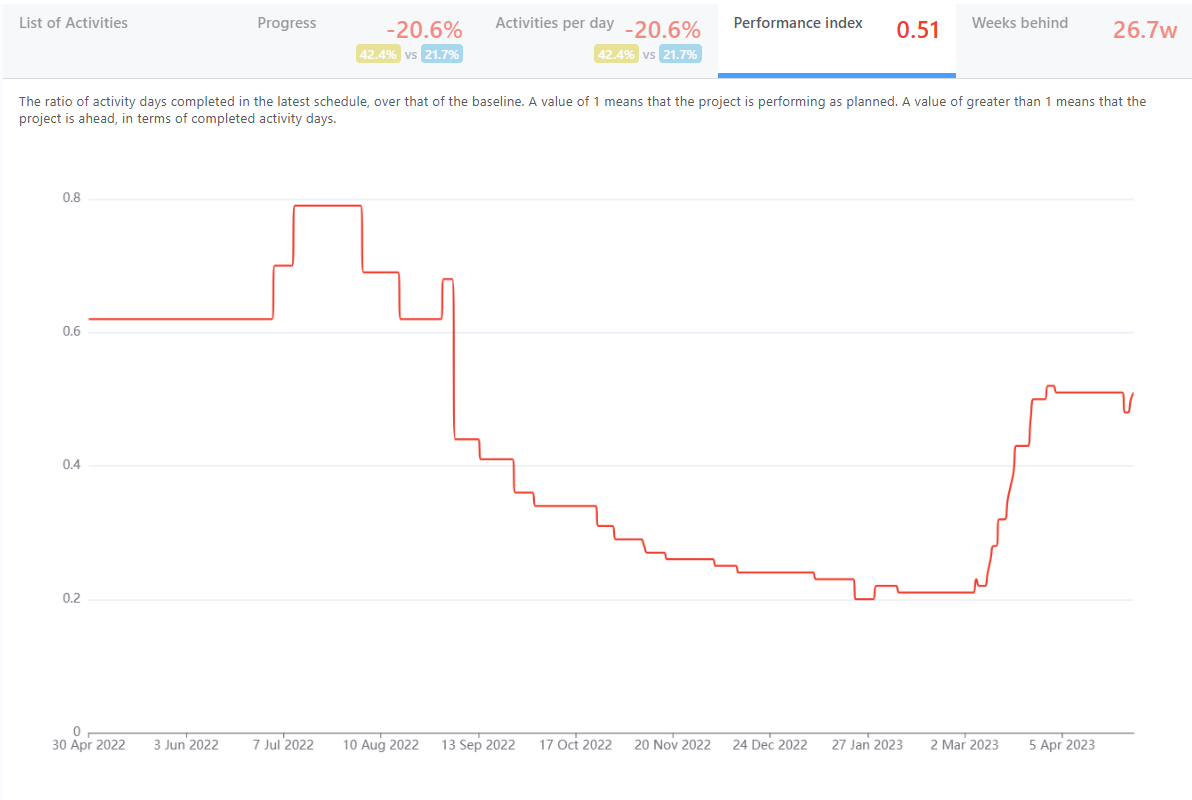
Schedule Performance Index
Schedule Performance Index (SPI) of the schedule. Value above 1 means the schedule is ahead, smaller than 1 means the schedule is behind.
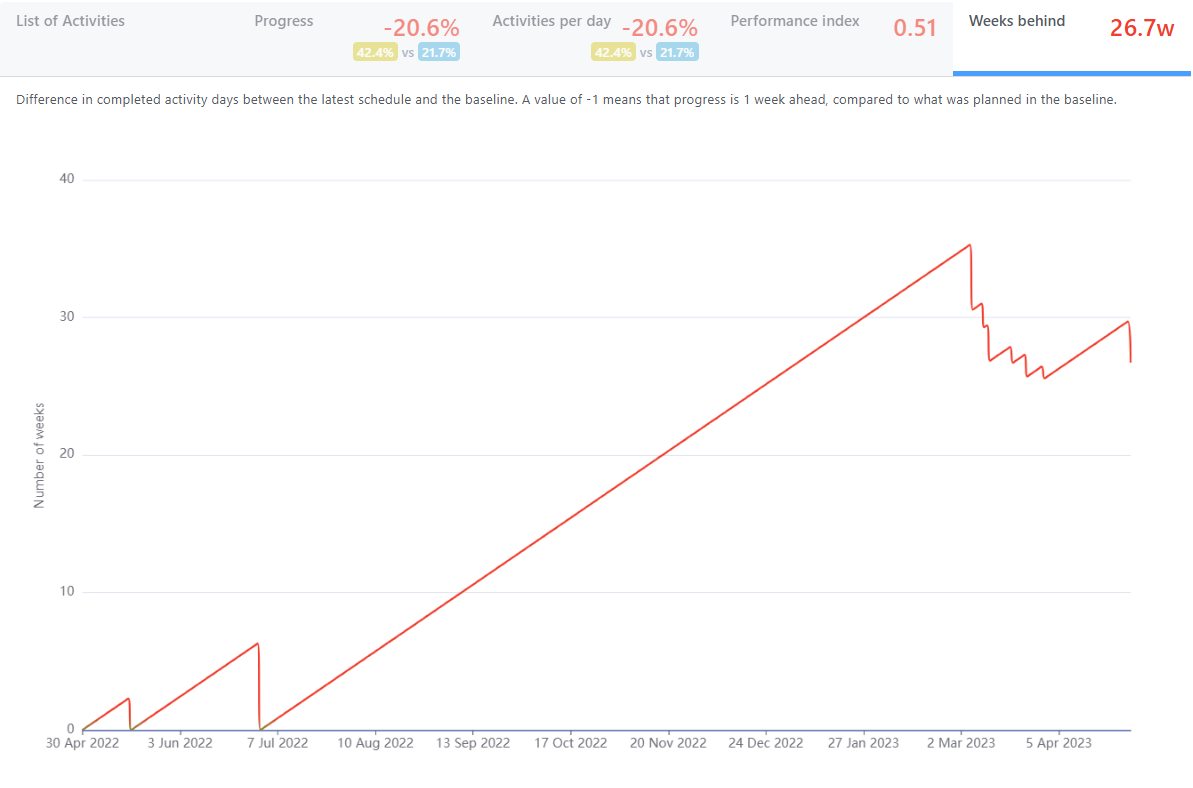
Weeks behind
How many weeks the project is behing compared to the baseline
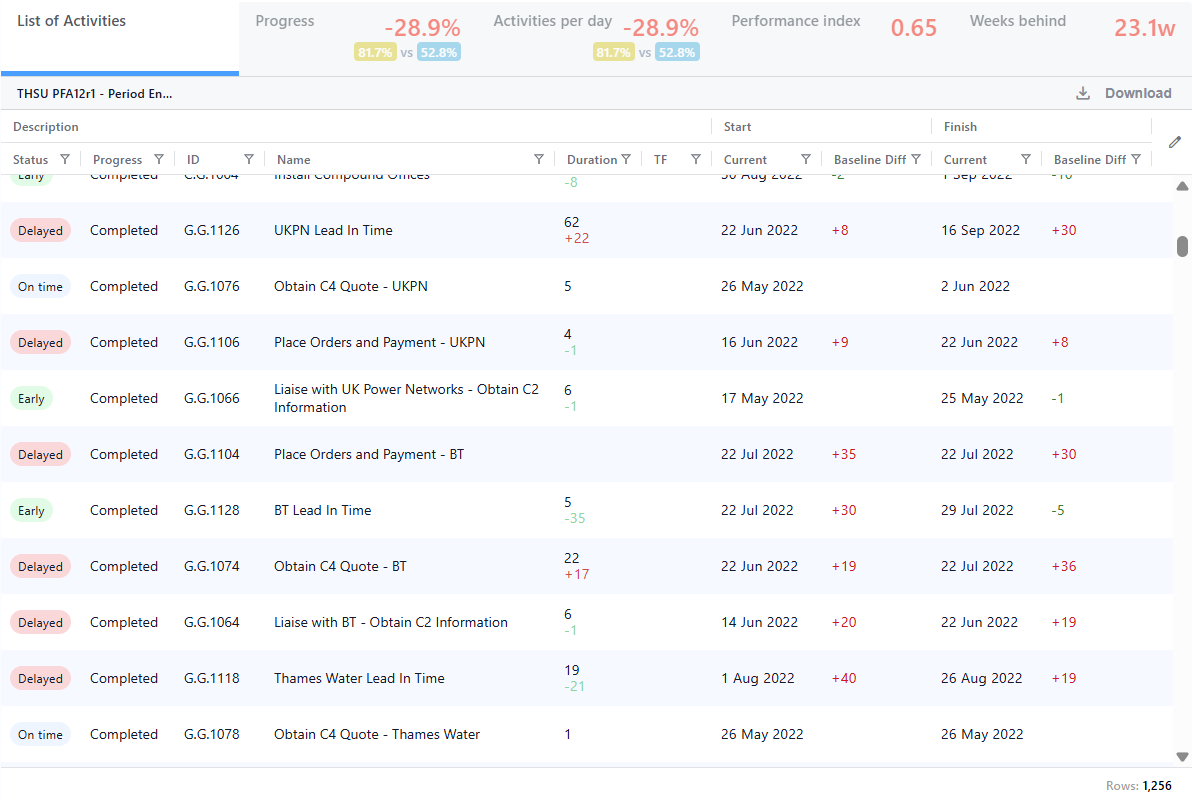
Drill down to the activity level
Once you select a WBS level (or Activity Code) you can see at the List of Activities tab, all the activities in that WBS. You can filter each column as you see fit, customize the columns and download that list in an excel.
How can progress of a past point in time can be decreased by future alterations to the schedule?
Example 1: Duration-Based Progress
- What the schedule progress looked like 10 months ago:
- Total duration at that time: 100 days
- Work completed by that point in time: 40 days
- Reported progress at the time = 40 / 100 = 40%
- What the schedule progress looks like today:
- Total duration has increased to 200 days
- Same work completed by that same past point: 40 days
- New progress shown for that point = 40 / 200 = 20%
Why it dropped: When you add more duration later, the scope gets bigger. Even though the completed work hasn't changed, it now counts for less compared to the bigger total. So past progress % adjusts.
Example 2: Activity Count-Based Progress
- What the schedule looked like 10 months ago:
- Total number of activities at that time: 10
- Activities completed by that point in time: 5
- Reported progress at the time = 5 / 10 = 50%
- What the schedule looks like today:
- Total activities increased to 20
- Same 5 activities were completed by that same past point
- New progress shown for that point = 5 / 20 = 25%
Why it dropped: The number of activities grew. So the same completed ones from before now form a smaller part of the full list. The past point didn’t change — the total did.

