📉Trend
How does the chart work?
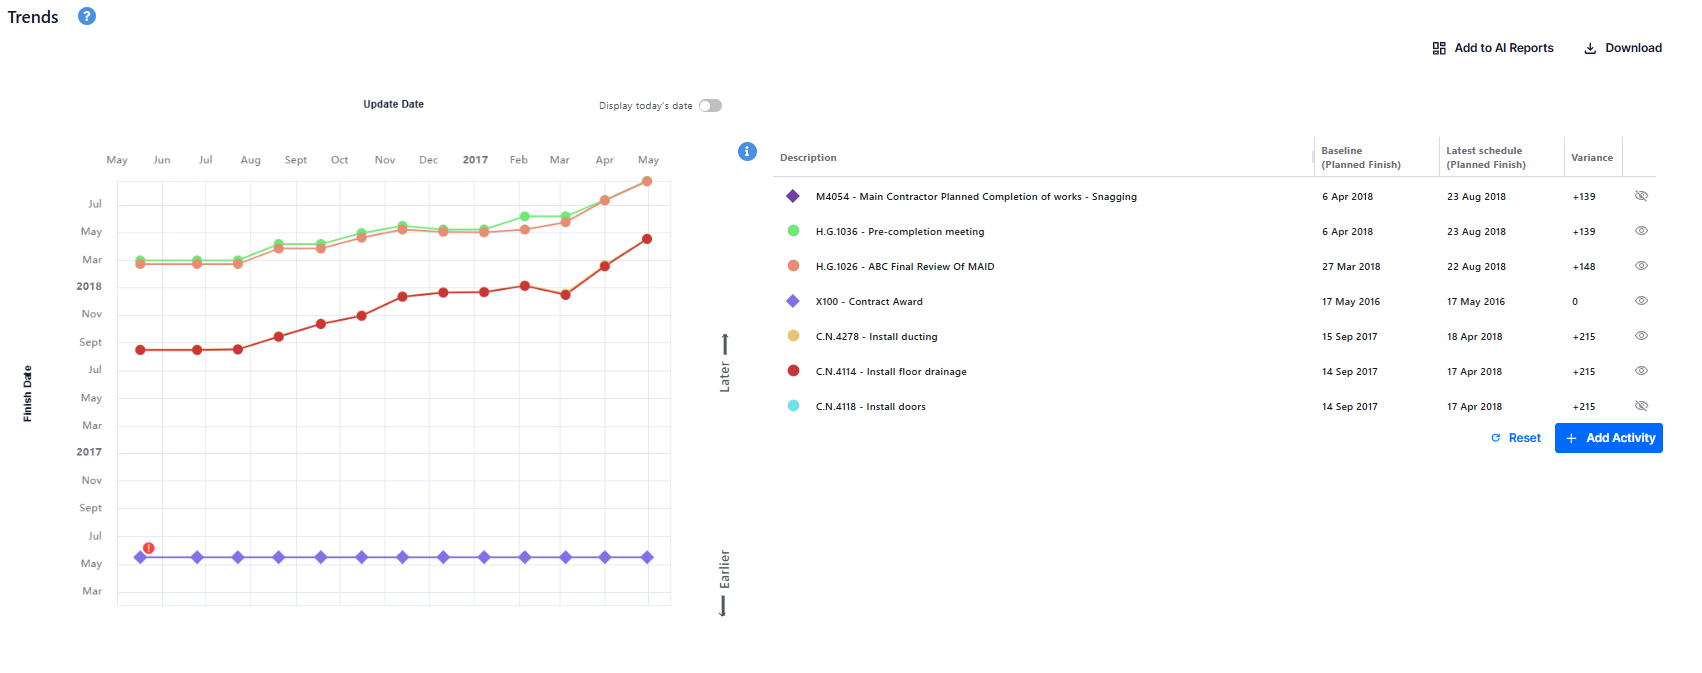
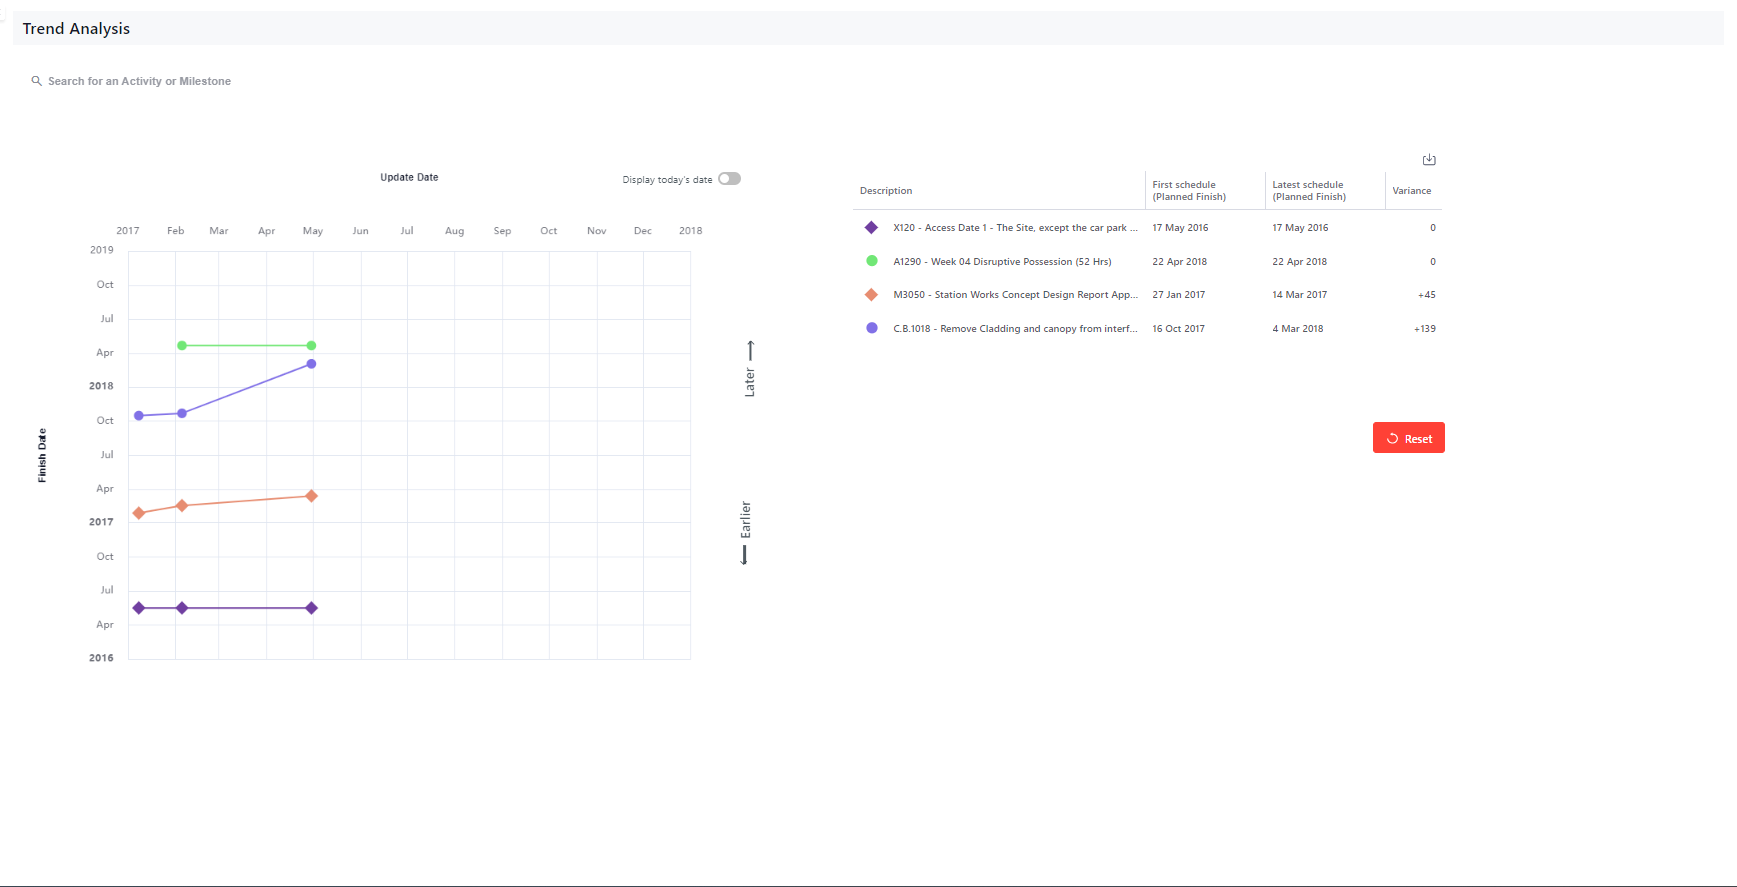
Easily track the finish dates of multiple activities across updates. Simply search for the activities you’re interested in, and instantly access an interactive visual that shows how finish dates are trending across various schedule updates.
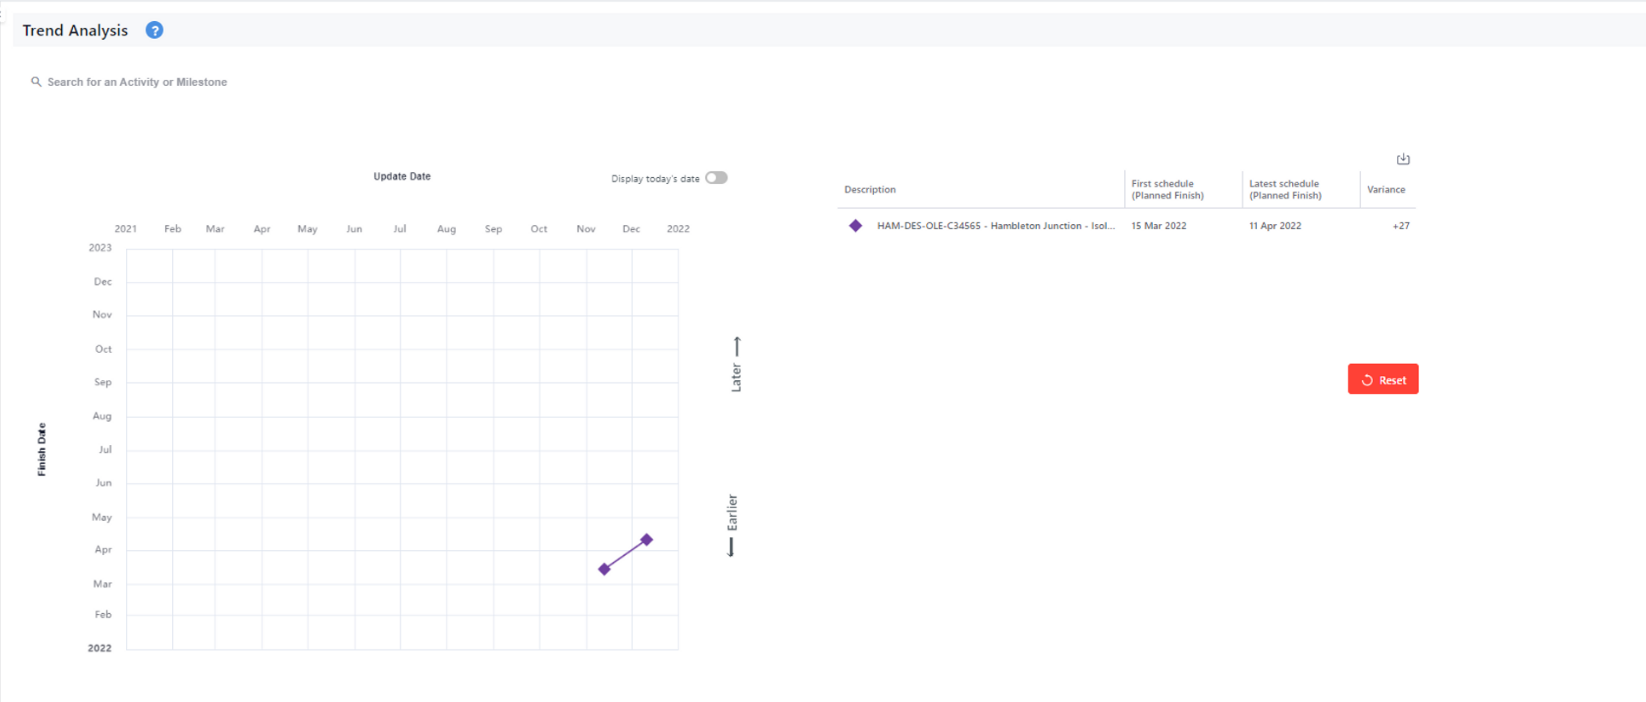
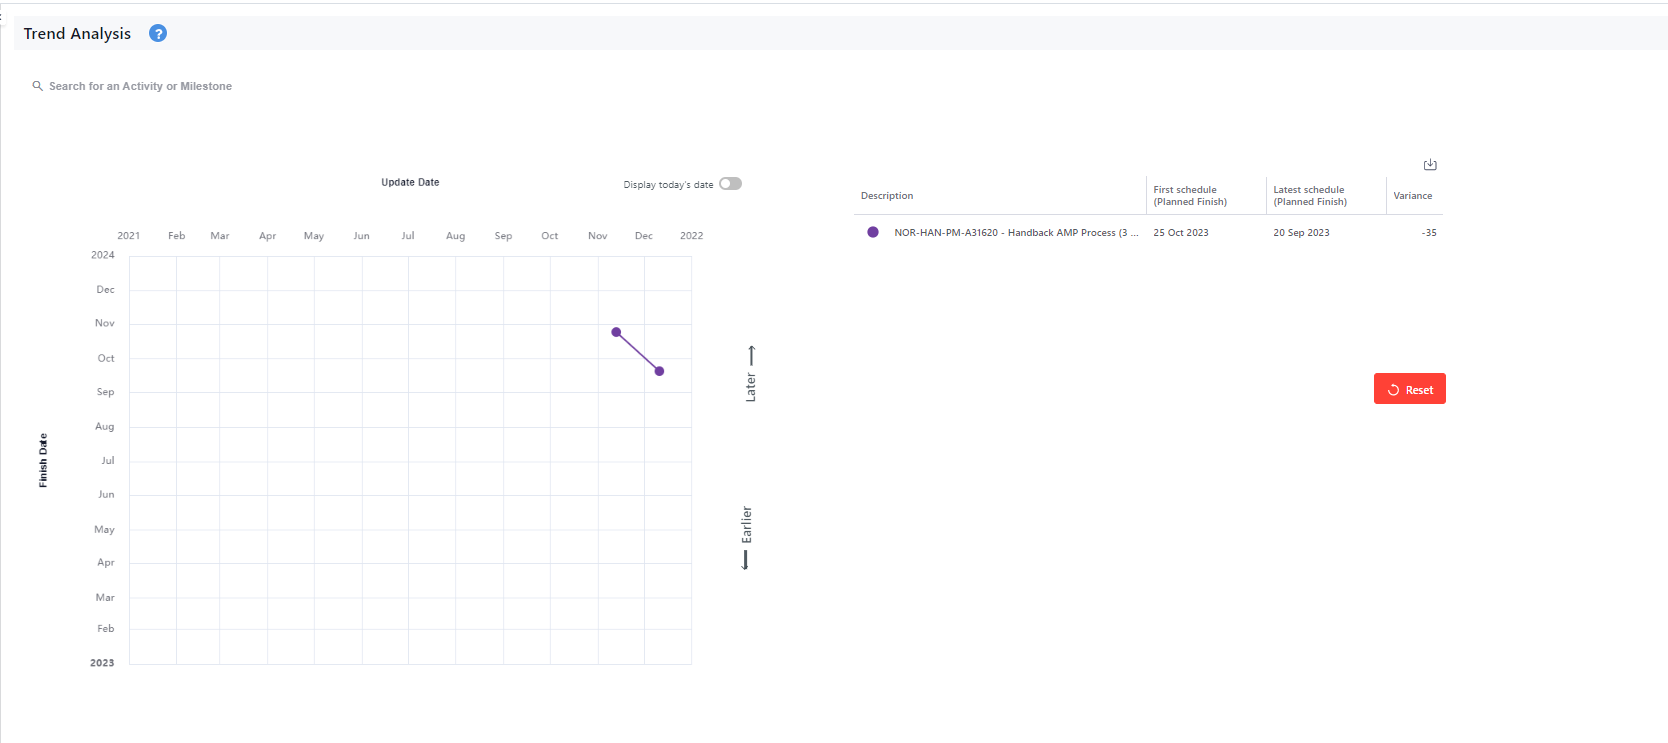
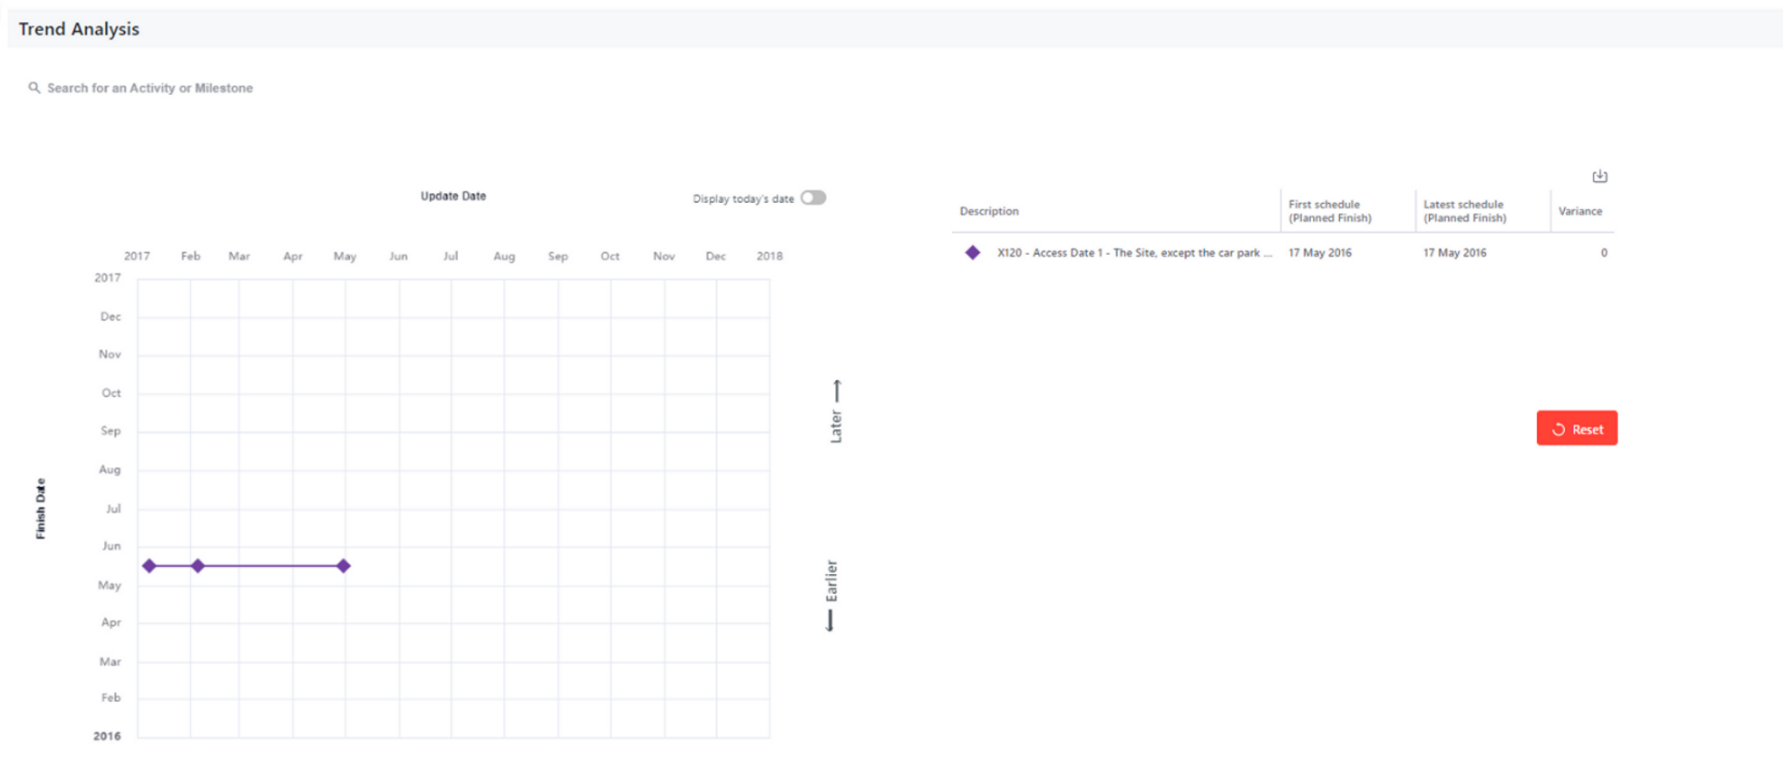
The x-axis represents your update date, while the y-axis is the finish date of your activity. On the right side of the screen, you will see a detailed table with all your selected activities and their finish dates on the first and last updates as well as the variance.
- Example of a delayed activity: If the line is trending upwards, it means that the activity is experiencing delays.
- Example of activity ahead of schedule: If the line is trending downward, it means that the activity is ahead of schedule.
- Example of activity on time: If the line is horizontal, it means that the activity is on track.
Export
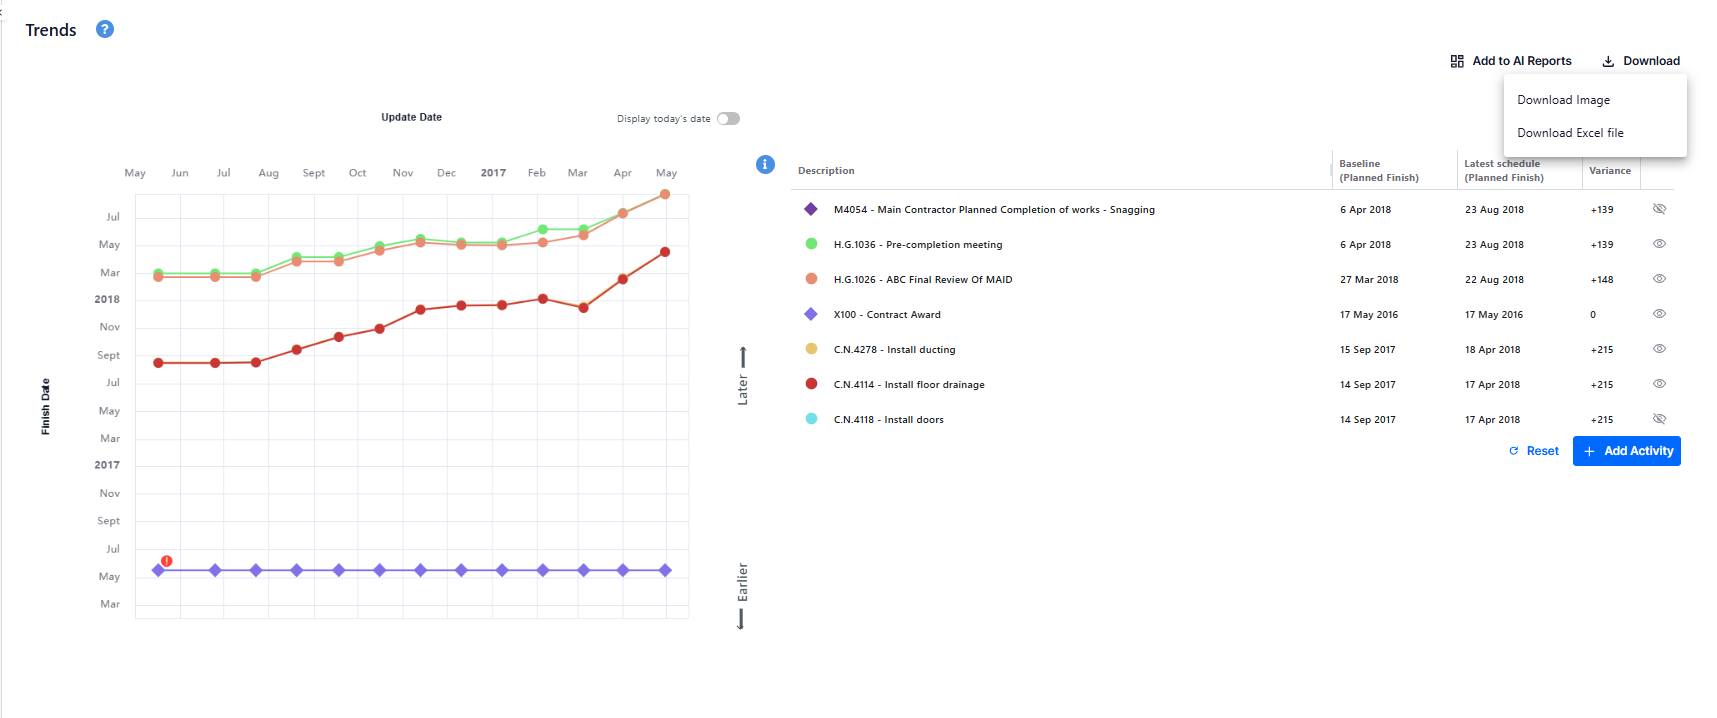
Easily export and share your charts by clicking the “Export” button at the top of the table. Choose to export either an image or an Excel file containing all the chart data.
Compare to Today’s Date
Understand quickly how your delivery dates are performing compared to today’s date. Simply click on the toggle button on top of the chart and a line representing today’s date will appear.
Add your chart to AI Reports
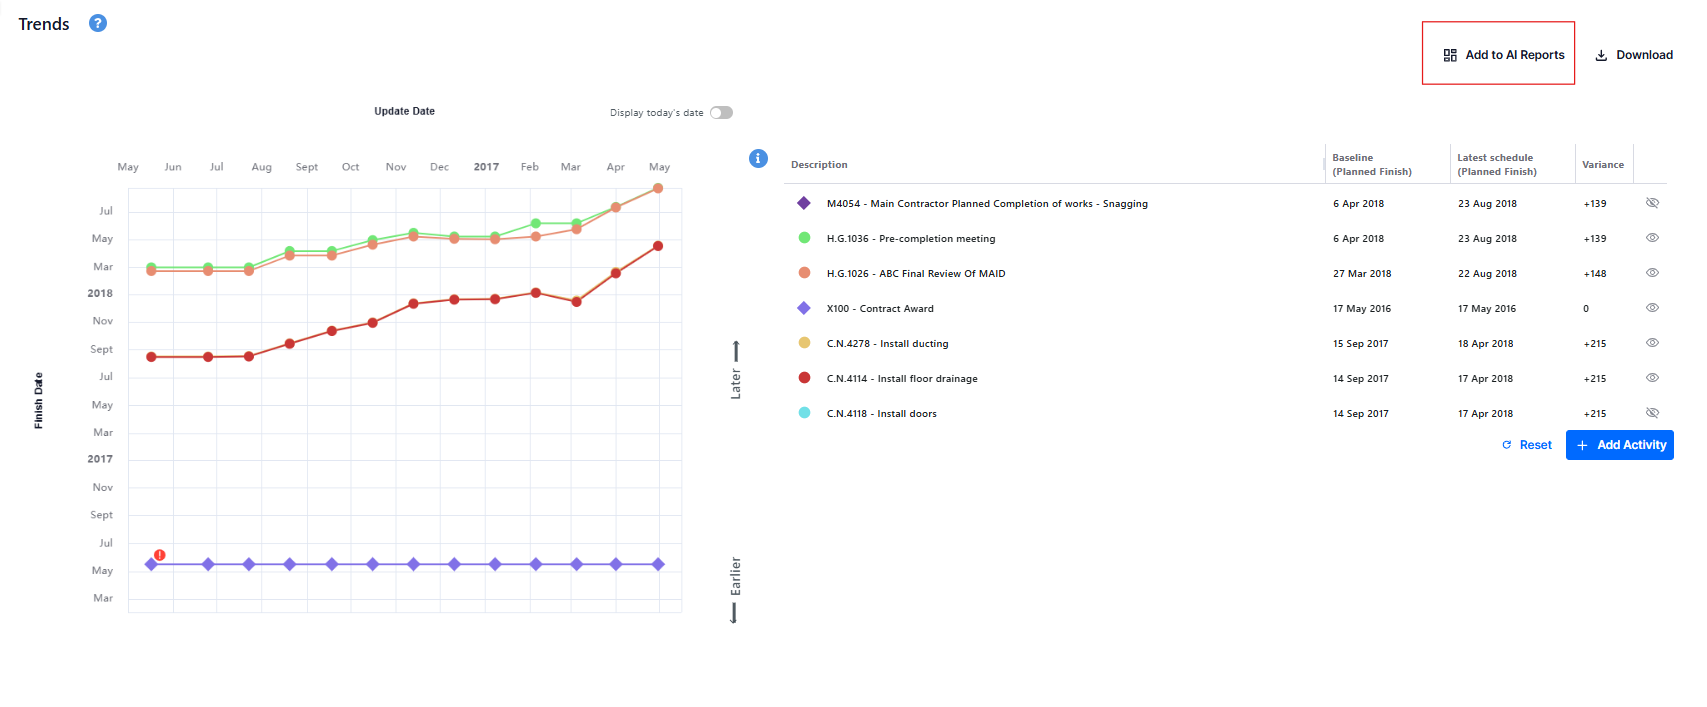
After configuring your Trend chart, you have the option to add it to an AI report by clicking the "Add to AI Reports" button and selecting the report you’d like to include it in.
Technical notes:
- You can select up to 10 activities
- If you want to delete one activity, hover over it and click on the X button
- If you want to hide an activity from the visual simply click on the eye icon
- You can also reset the chart by clicking on the Reset button
- The Variance formula=
Finish date on the latest Schedule - Finish date on the Baseline

