🎯 Risk Drivers
This screen enables you to:
- Identify what’s driving the risk profile of a specific activity
- Compare your Risk drivers across updates
Identify what’s driving the risk profile of a specific activity
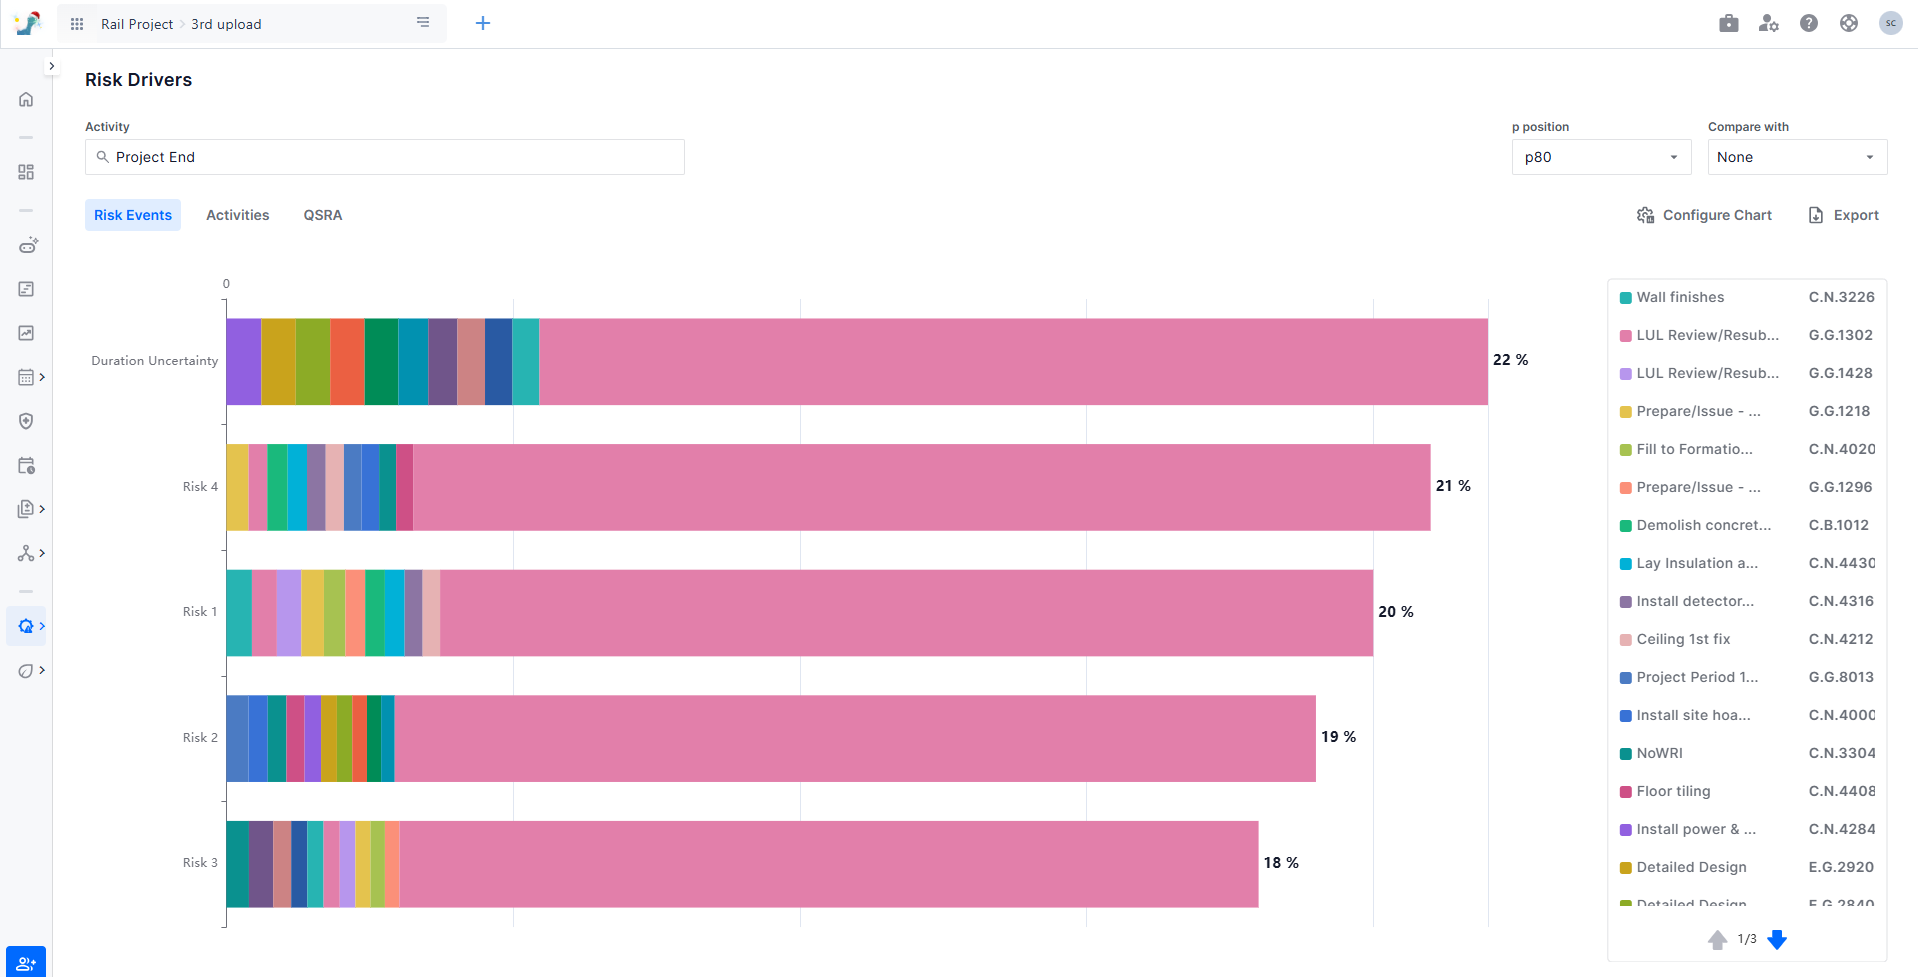
You can quickly understand what drives the risk profile of a specific activity. From the Risk Drivers tab under AI QSRA, select the activity, and the p-position you care about. You will immediately gain access to an interactive visualization that shows all the risk events that drive the p-position with a clear breakdown that shows the activities each risk event is impacting. This allows you to understand how individual risk events are affecting different activities.
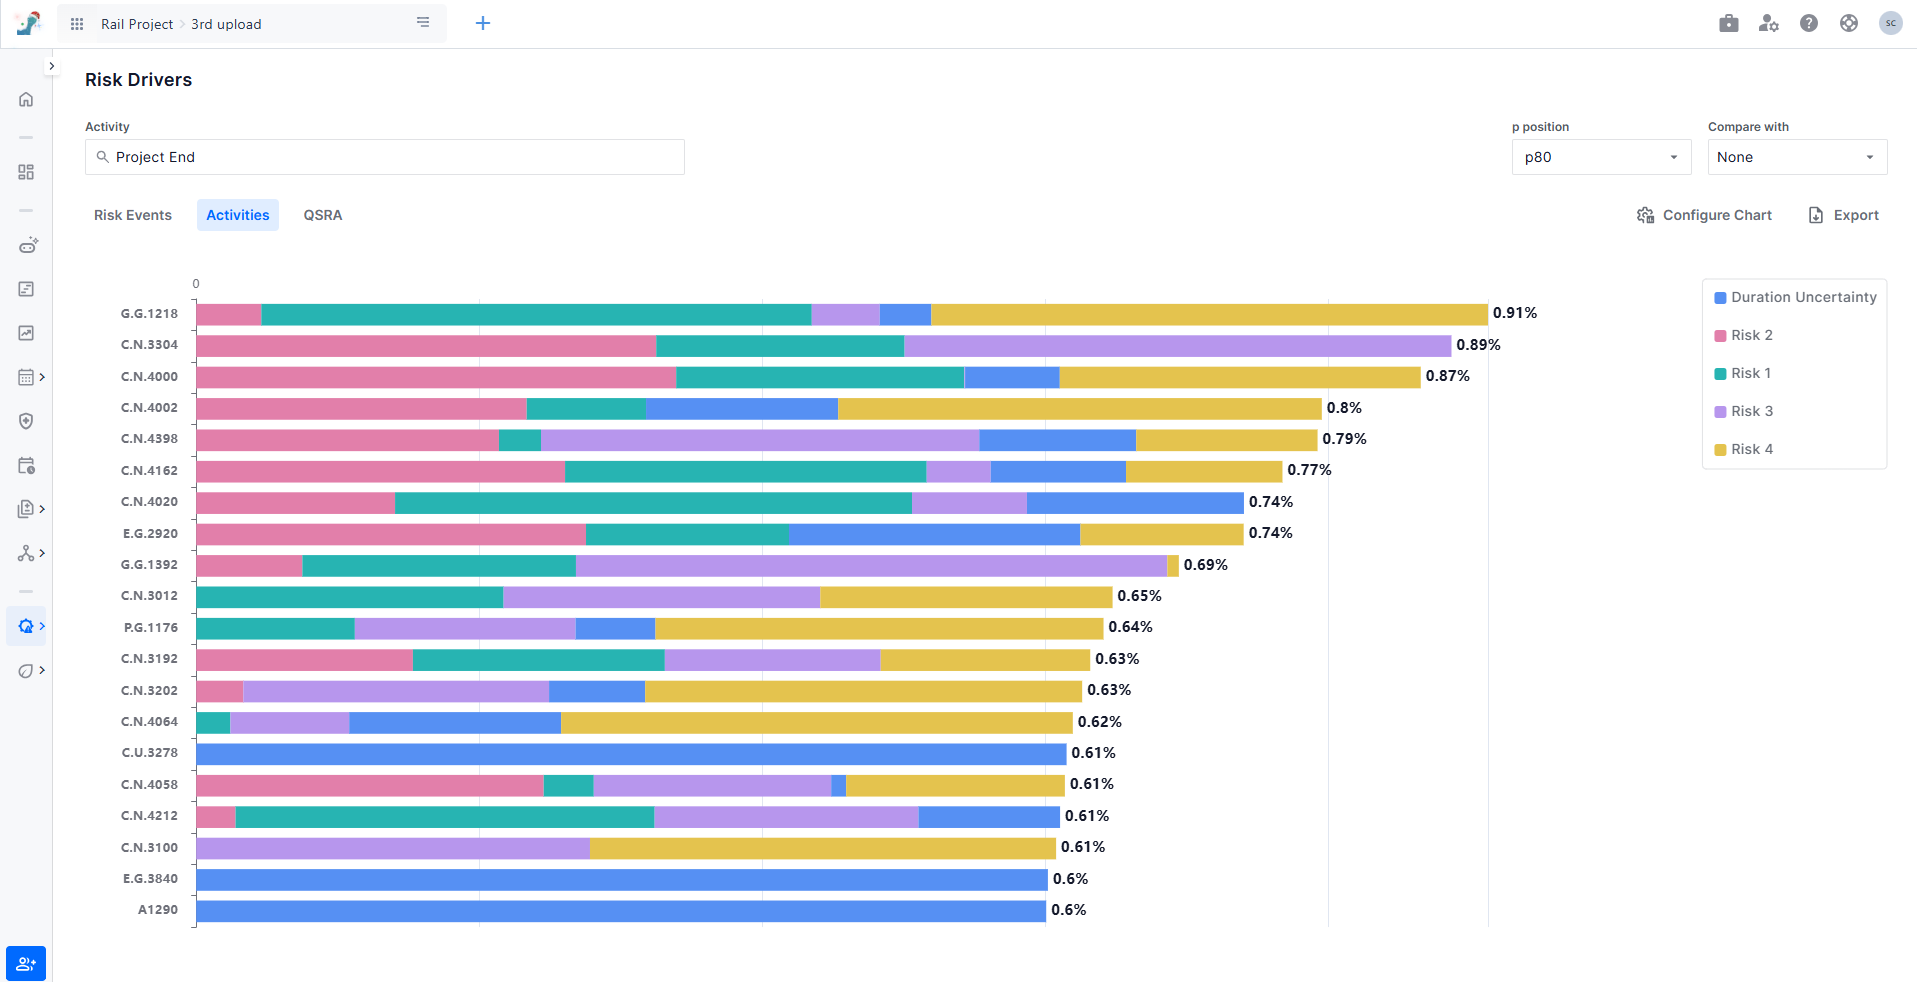
You can also switch to activities driving the risk profile. You will immediately gain access to an interactive visualization that shows all the activities that drive the p-position with a clear breakdown of risk events and duration uncertainty for each activity.
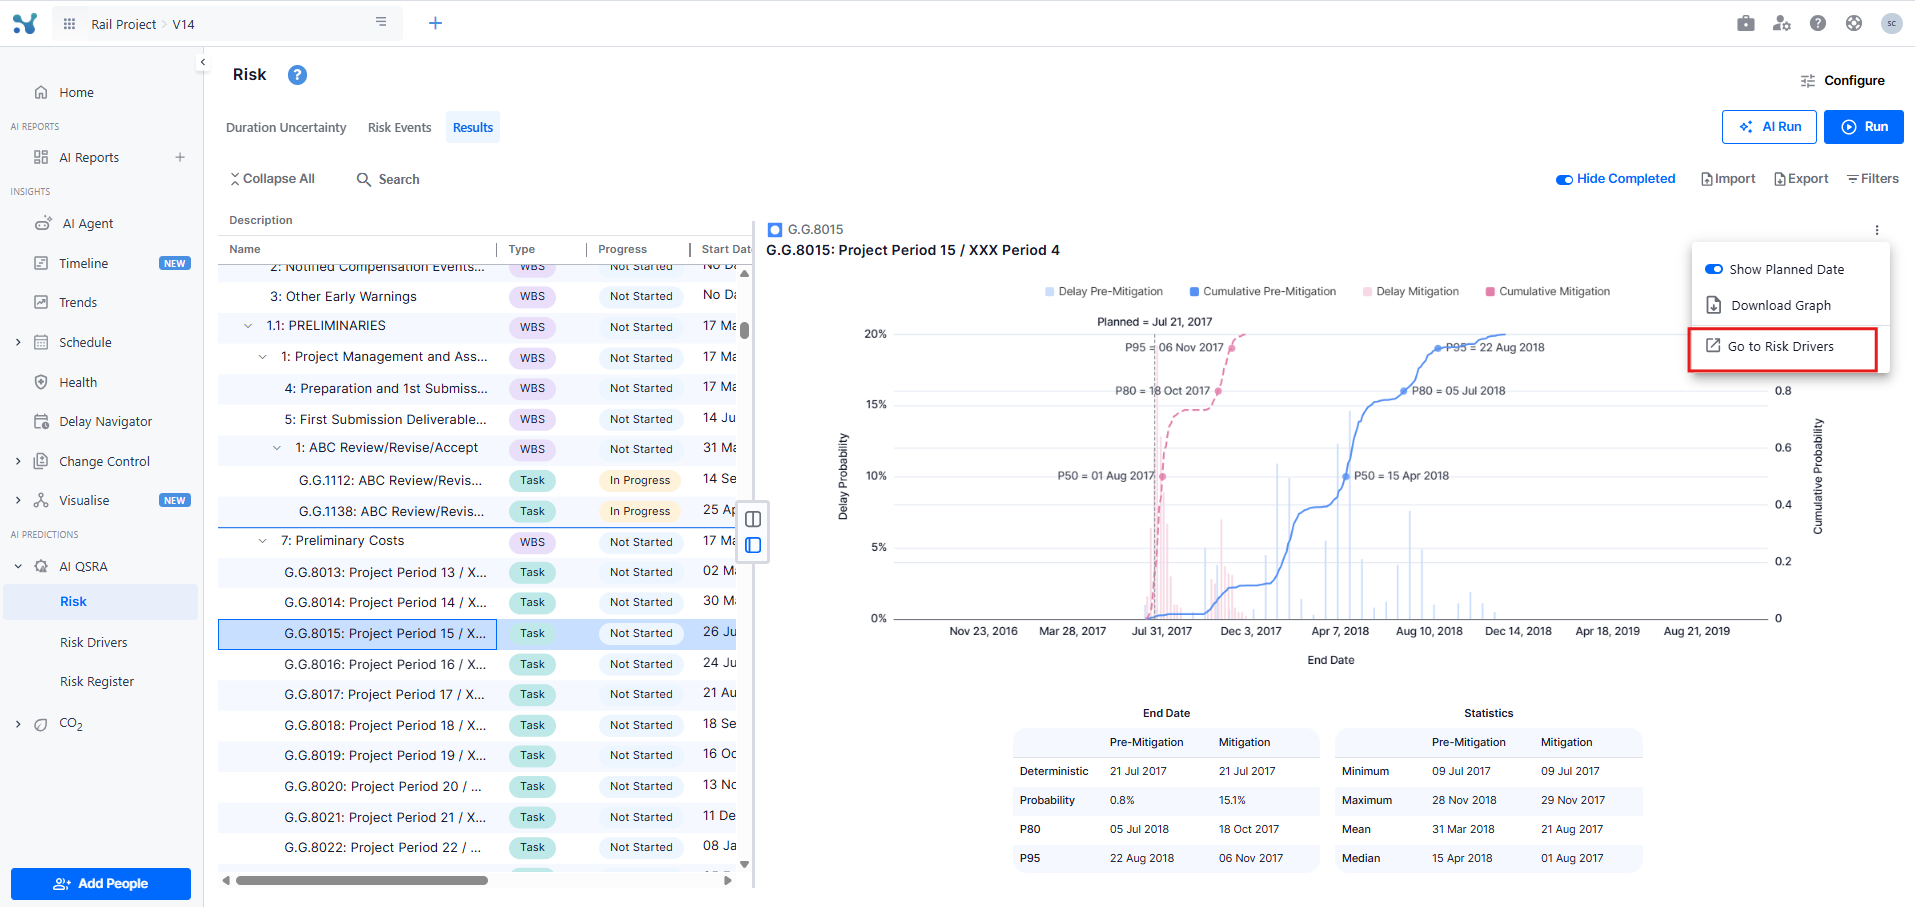
You can also explore what is driving the P80 (or any other p-position) of a specific activity from the Risk screen. Simply select the activity you are interested in and click “Go to Risk Drivers” from the three-dot menu at the top of the results chart. You will then be redirected to the Risk Drivers screen, where a visual representation of all the drivers affecting your selected P80 is displayed.
Compare your Risk drivers across updates
You can quickly compare how your risk drivers are trending compared to your previous update. From the risk drivers screen, simply enable the option ‘Compare with previous update’.

Compare your Risk Drivers to the Mitigation Scenario
You can see how your mitigation measures impact each risk driver. In the Risk Drivers screen, enable the “Compare with mitigation” option to visualize the effect of your mitigation scenario on all risk drivers. This helps quickly identify which risks are being effectively managed and which may need further attention. To access this comparison, you must have first run an analysis with a mitigation scenario. For more information on setting up a mitigation scenario, see here.

Search for project-wide risk drivers
We added the option to search for project-wide risk drivers. It's not always the last activity! Just click on search and search for "Project Wide" drivers.

Remove the additional drivers and the breakdown
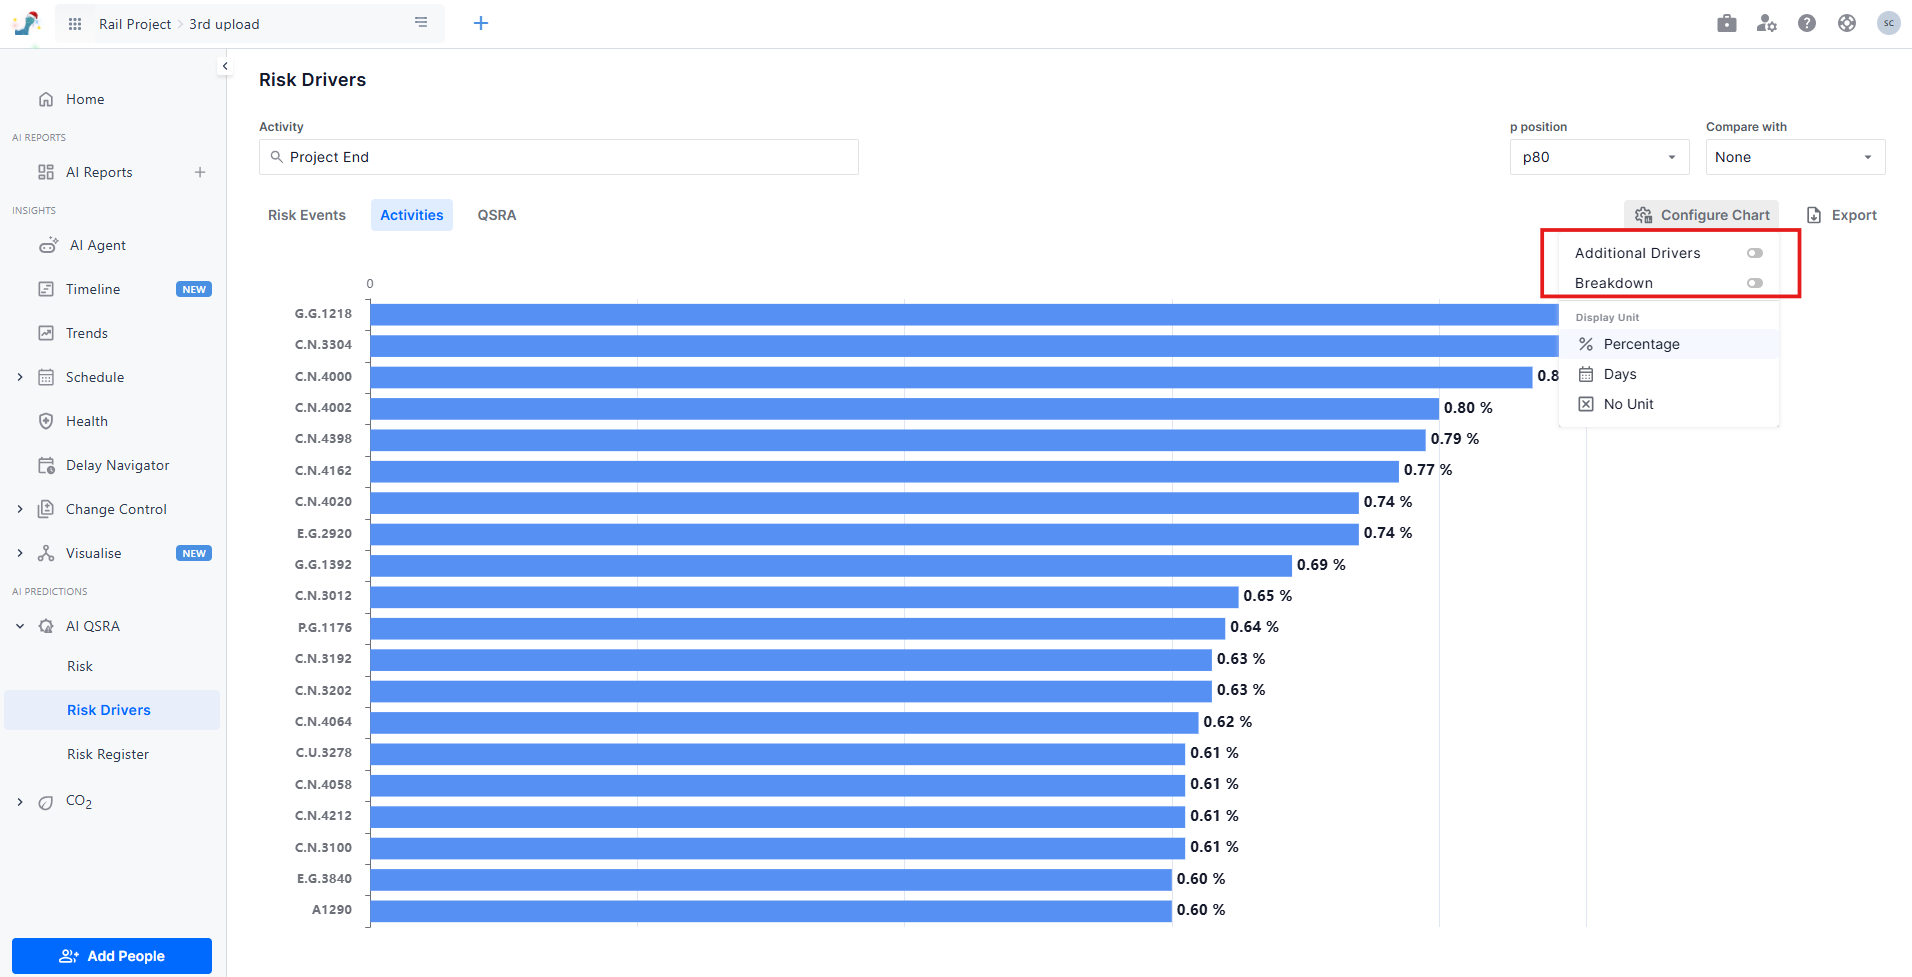
You may want to simplify your reports and remove the "additional drivers" and the "Breakdown" options to simplify your reports. These options can be turned off from the configuration drop-down.
Understand the Percentage Values on the Driver’s Screen
The percentages displayed on the driver’s screen represent normalized values derived from the correlation of risk drivers within N&L models. Although the initial correlation values are used to compute risk drivers, these outputs are adjusted to ensure that their total sums up to 100%.
For example, if three risk drivers have correlation values of 0.75, 0.5, and 0.75, they would be normalized to 37.5%, 25%, and 37.5%, respectively.
Understand the Day Values for Risk Drivers
N&L risk drivers models use correlation methods to calculate the values for each risk driver. These correlation values are first normalized to sum up to 100%. The normalized percentages are then converted to days using the P80 delay of the target activity.
For example, consider a target activity with a P80 delay of 200 days and three risk drivers with correlation values of 0.75, 0.5, and 0.75. After normalizing these correlation values, they become 37.5%, 25%, and 37.5%, respectively. These normalized percentages are then multiplied by the P80 delay of the target activity, resulting in 75, 50, and 75 days for each risk driver.
Export your Risk Drivers Results
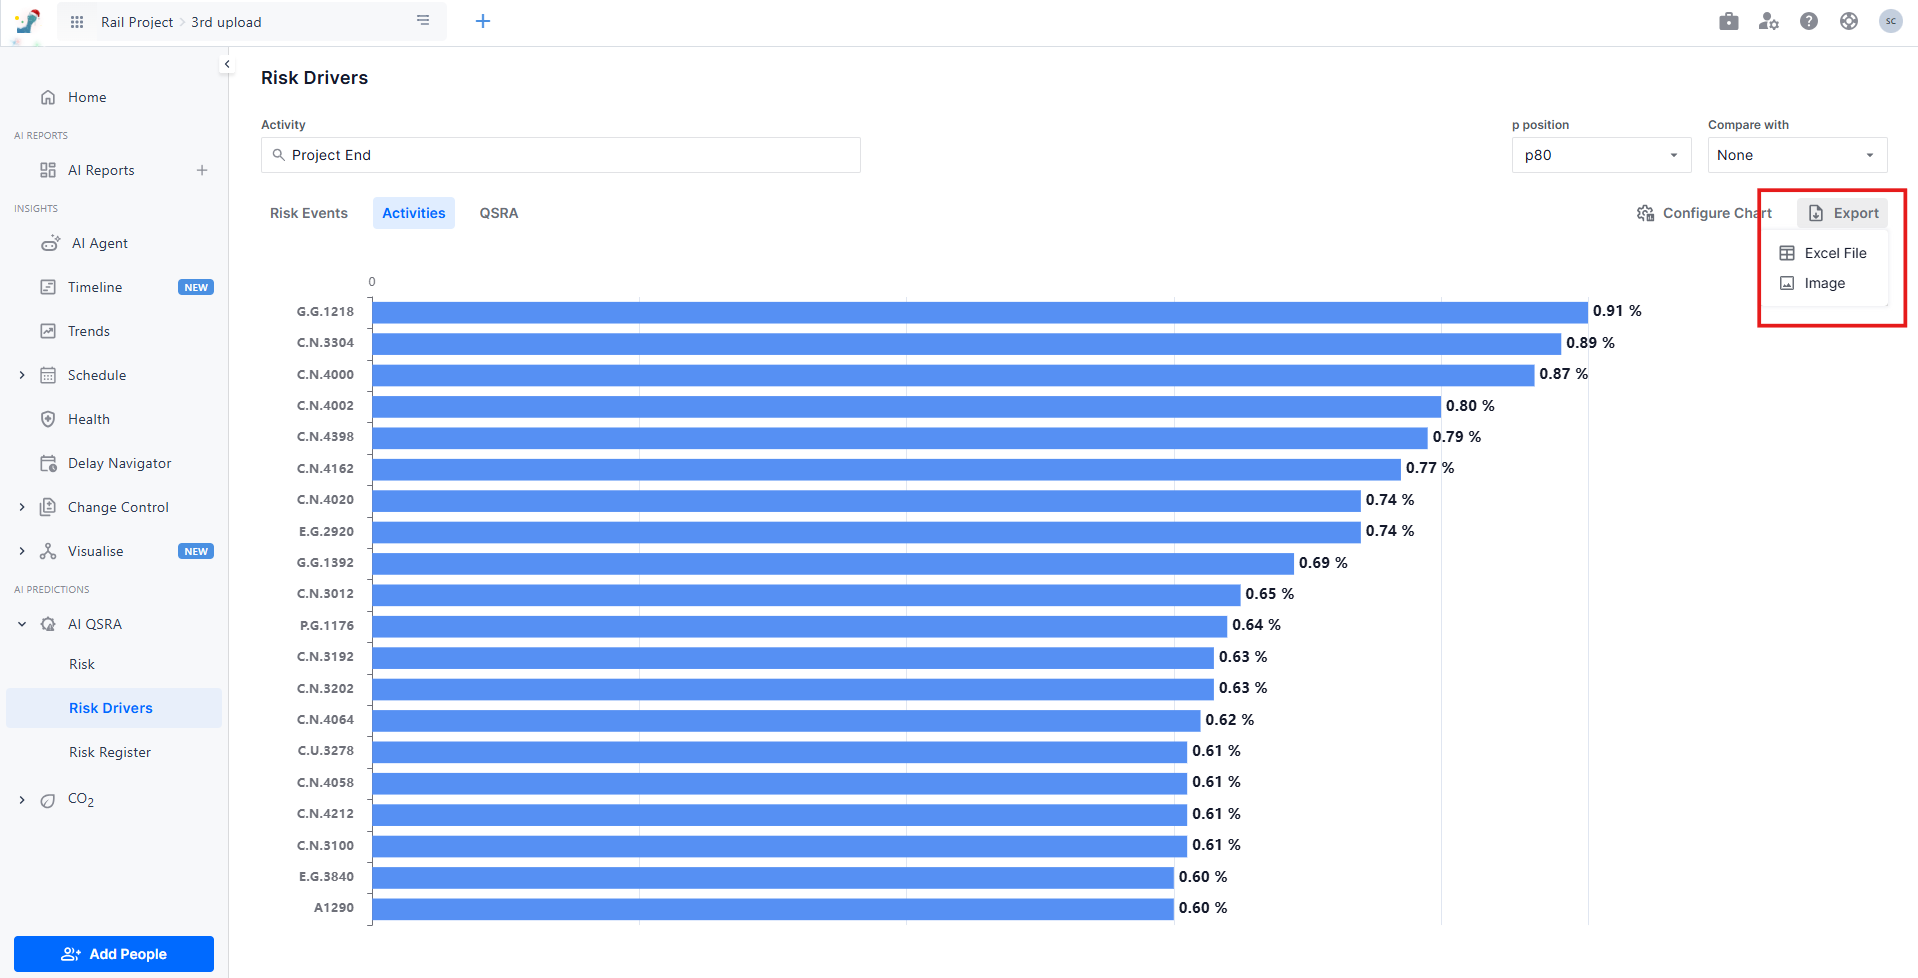
You can export your risk driver analysis for further use in reports or presentations. Simply, click on the export button and choose between:
- Image Export: Download an image of the tornado chart.
- Excel Export: Download a detailed Excel sheet containing the full risk drivers breakdown, including both activities and risk events views.
