🏥 Health
In this piece, you’ll learn how to quickly
- Check the quality of your schedule
- Download the list of activities failing a specific test
- Set your own success and failure criteria
Overall health score
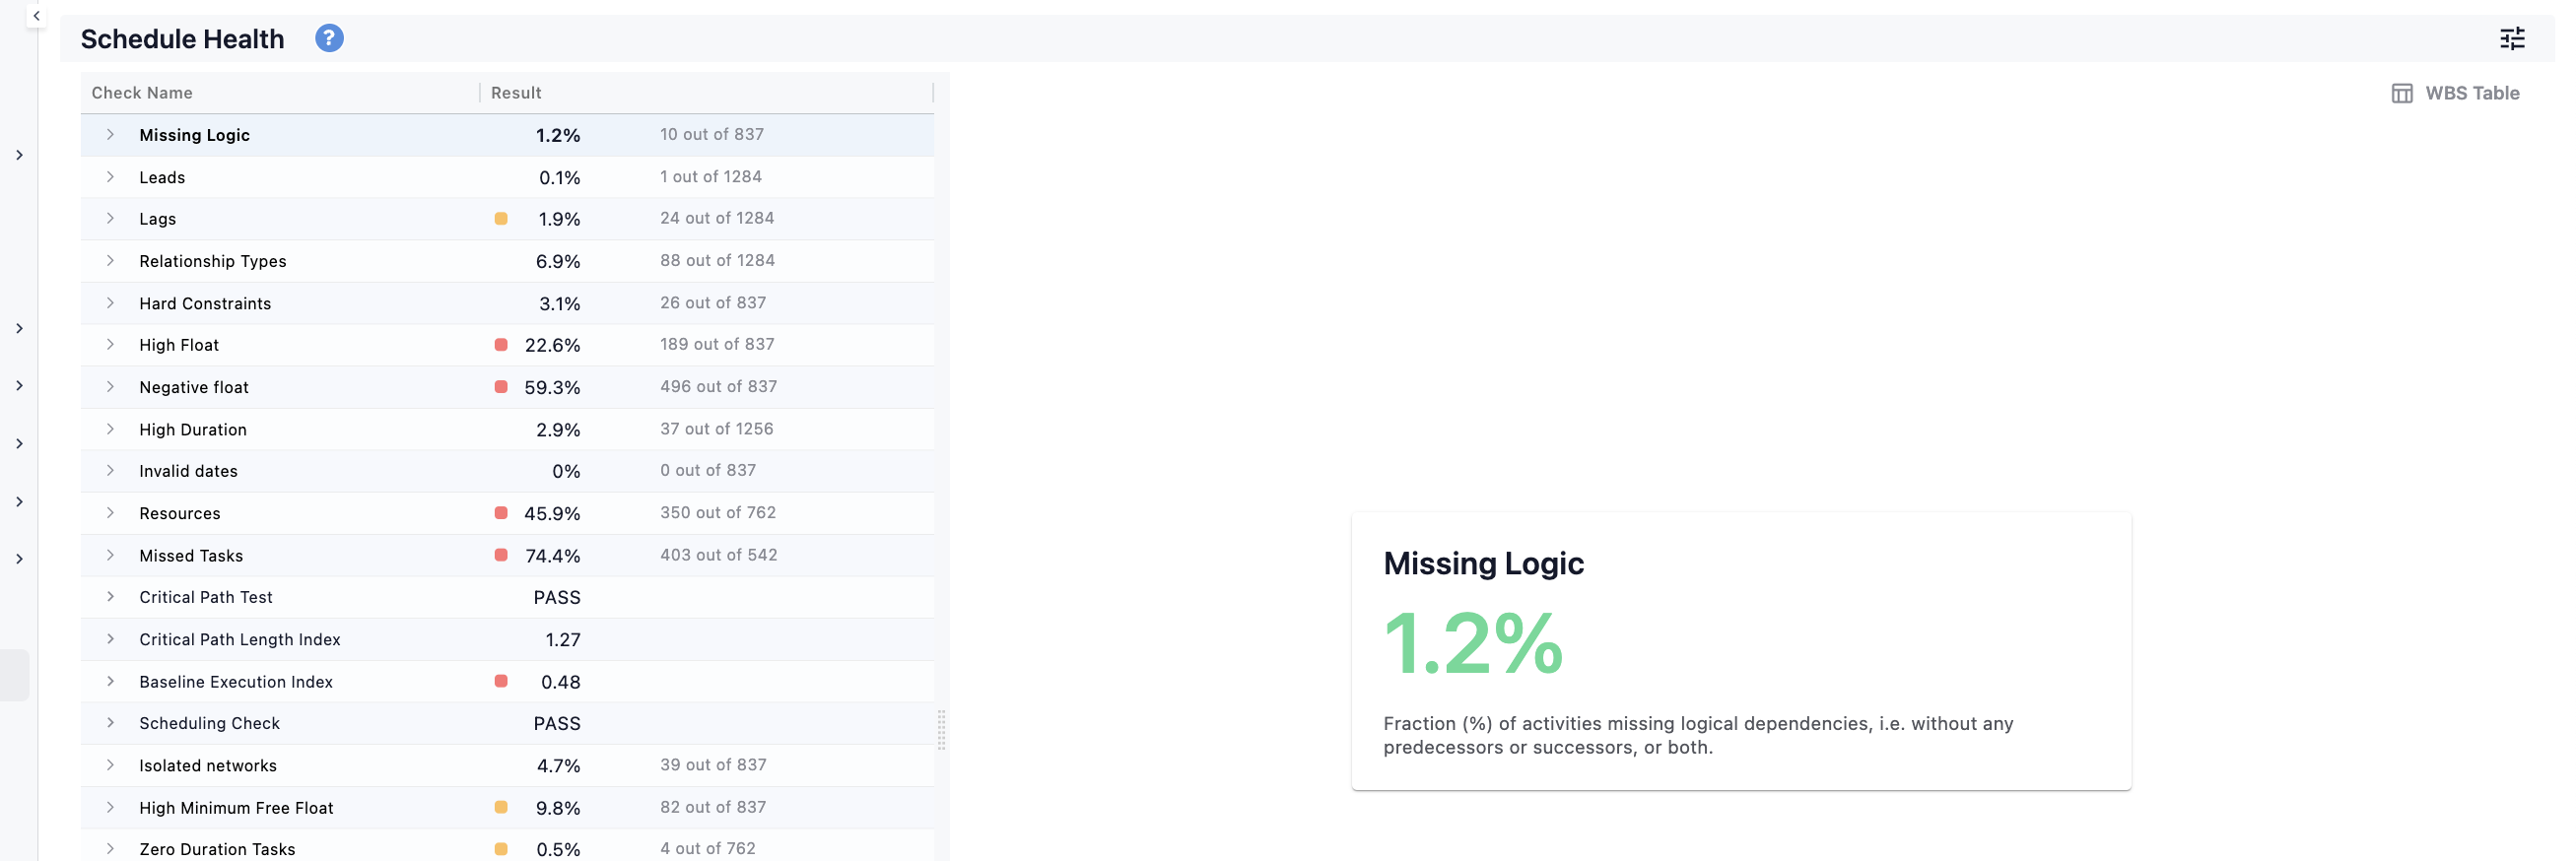
When you are entering the screen you will see an overall health score of your projects. There are two modes for this score, which you can select in the settings.
- Cut off: Show you how many health checks are passing
- Average: Shows you an average score of all the health checks ( passing and failing)
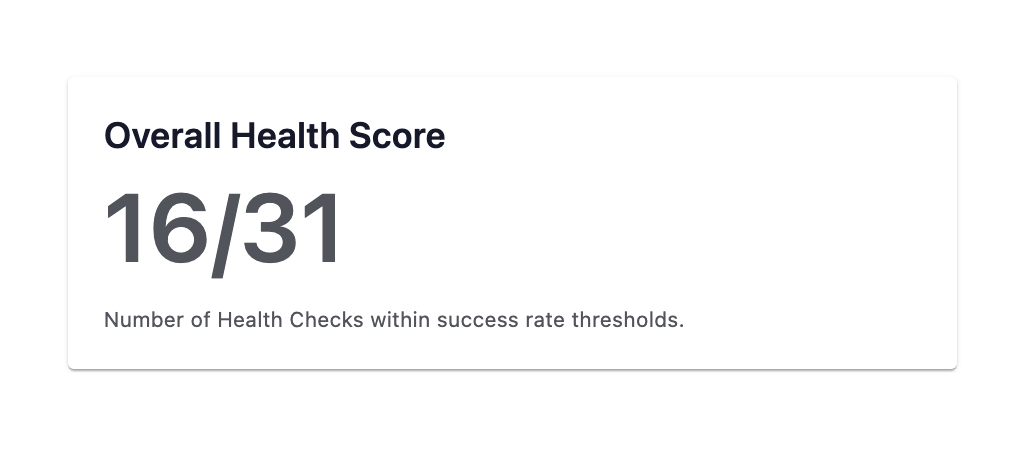
You can make a health check not count towards the Overall Health score by clicking on the “Visibility” switch for each check.
Switch between high level overview and table view
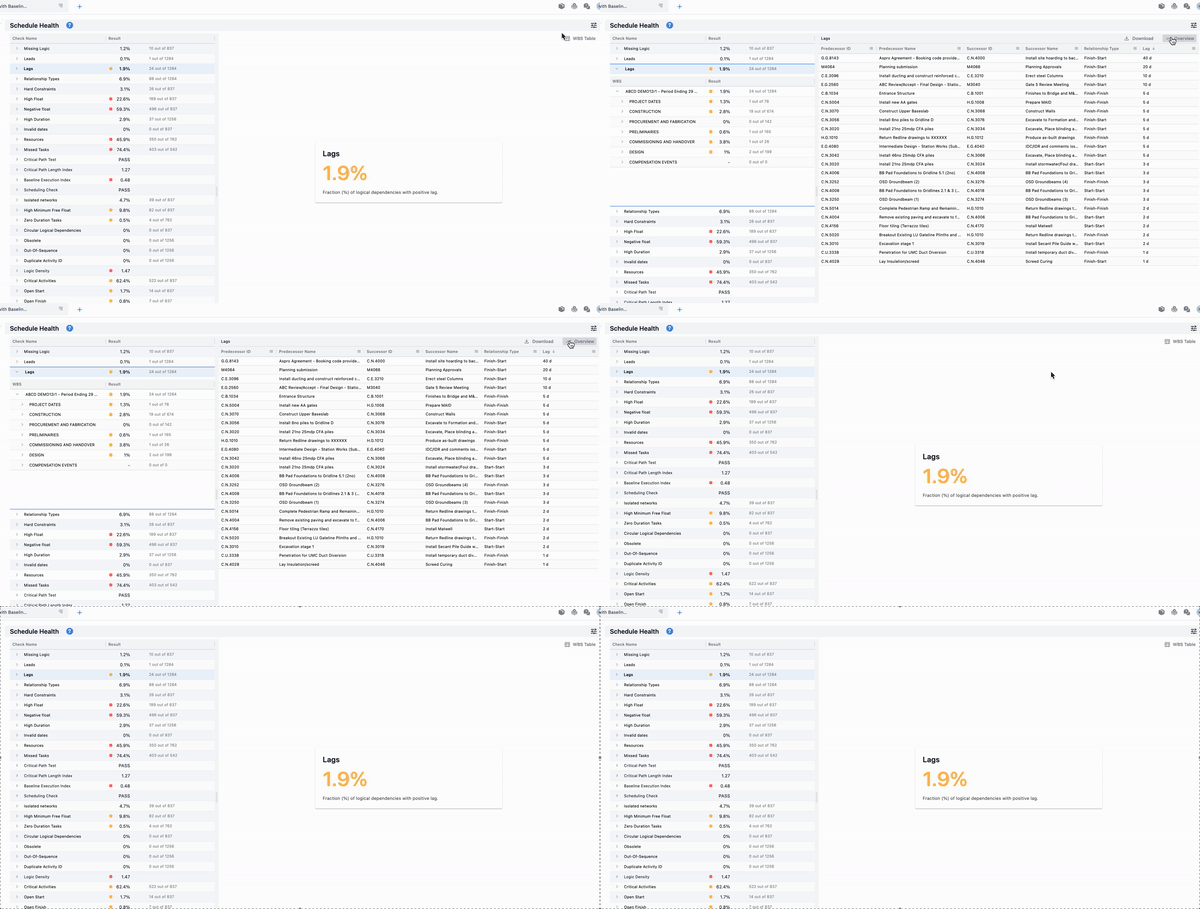
By clicking the "WBS table" at the top right you can see all the activities that are failing a test. You can go back to the overview mode where you see just the score by clicking the "overview" button.
Check the quality of your schedule
Using a simple color code (Green, Yellow, and Red), this screen allows you to assess your schedule quality on different WBS levels.
Using the color codes, you can prioritise the checks that fail the most, and for each check, you spot the WBS that performs best (and worst).
Go from a bird's eye view to individual activities fast. Just select the check and WBS that you care about, and a table will appear on the right-hand side, which includes all the activities that fail that particular check.
Technical note: You can find details for each check by clicking on the button ‘Check information’, including changing the threshold
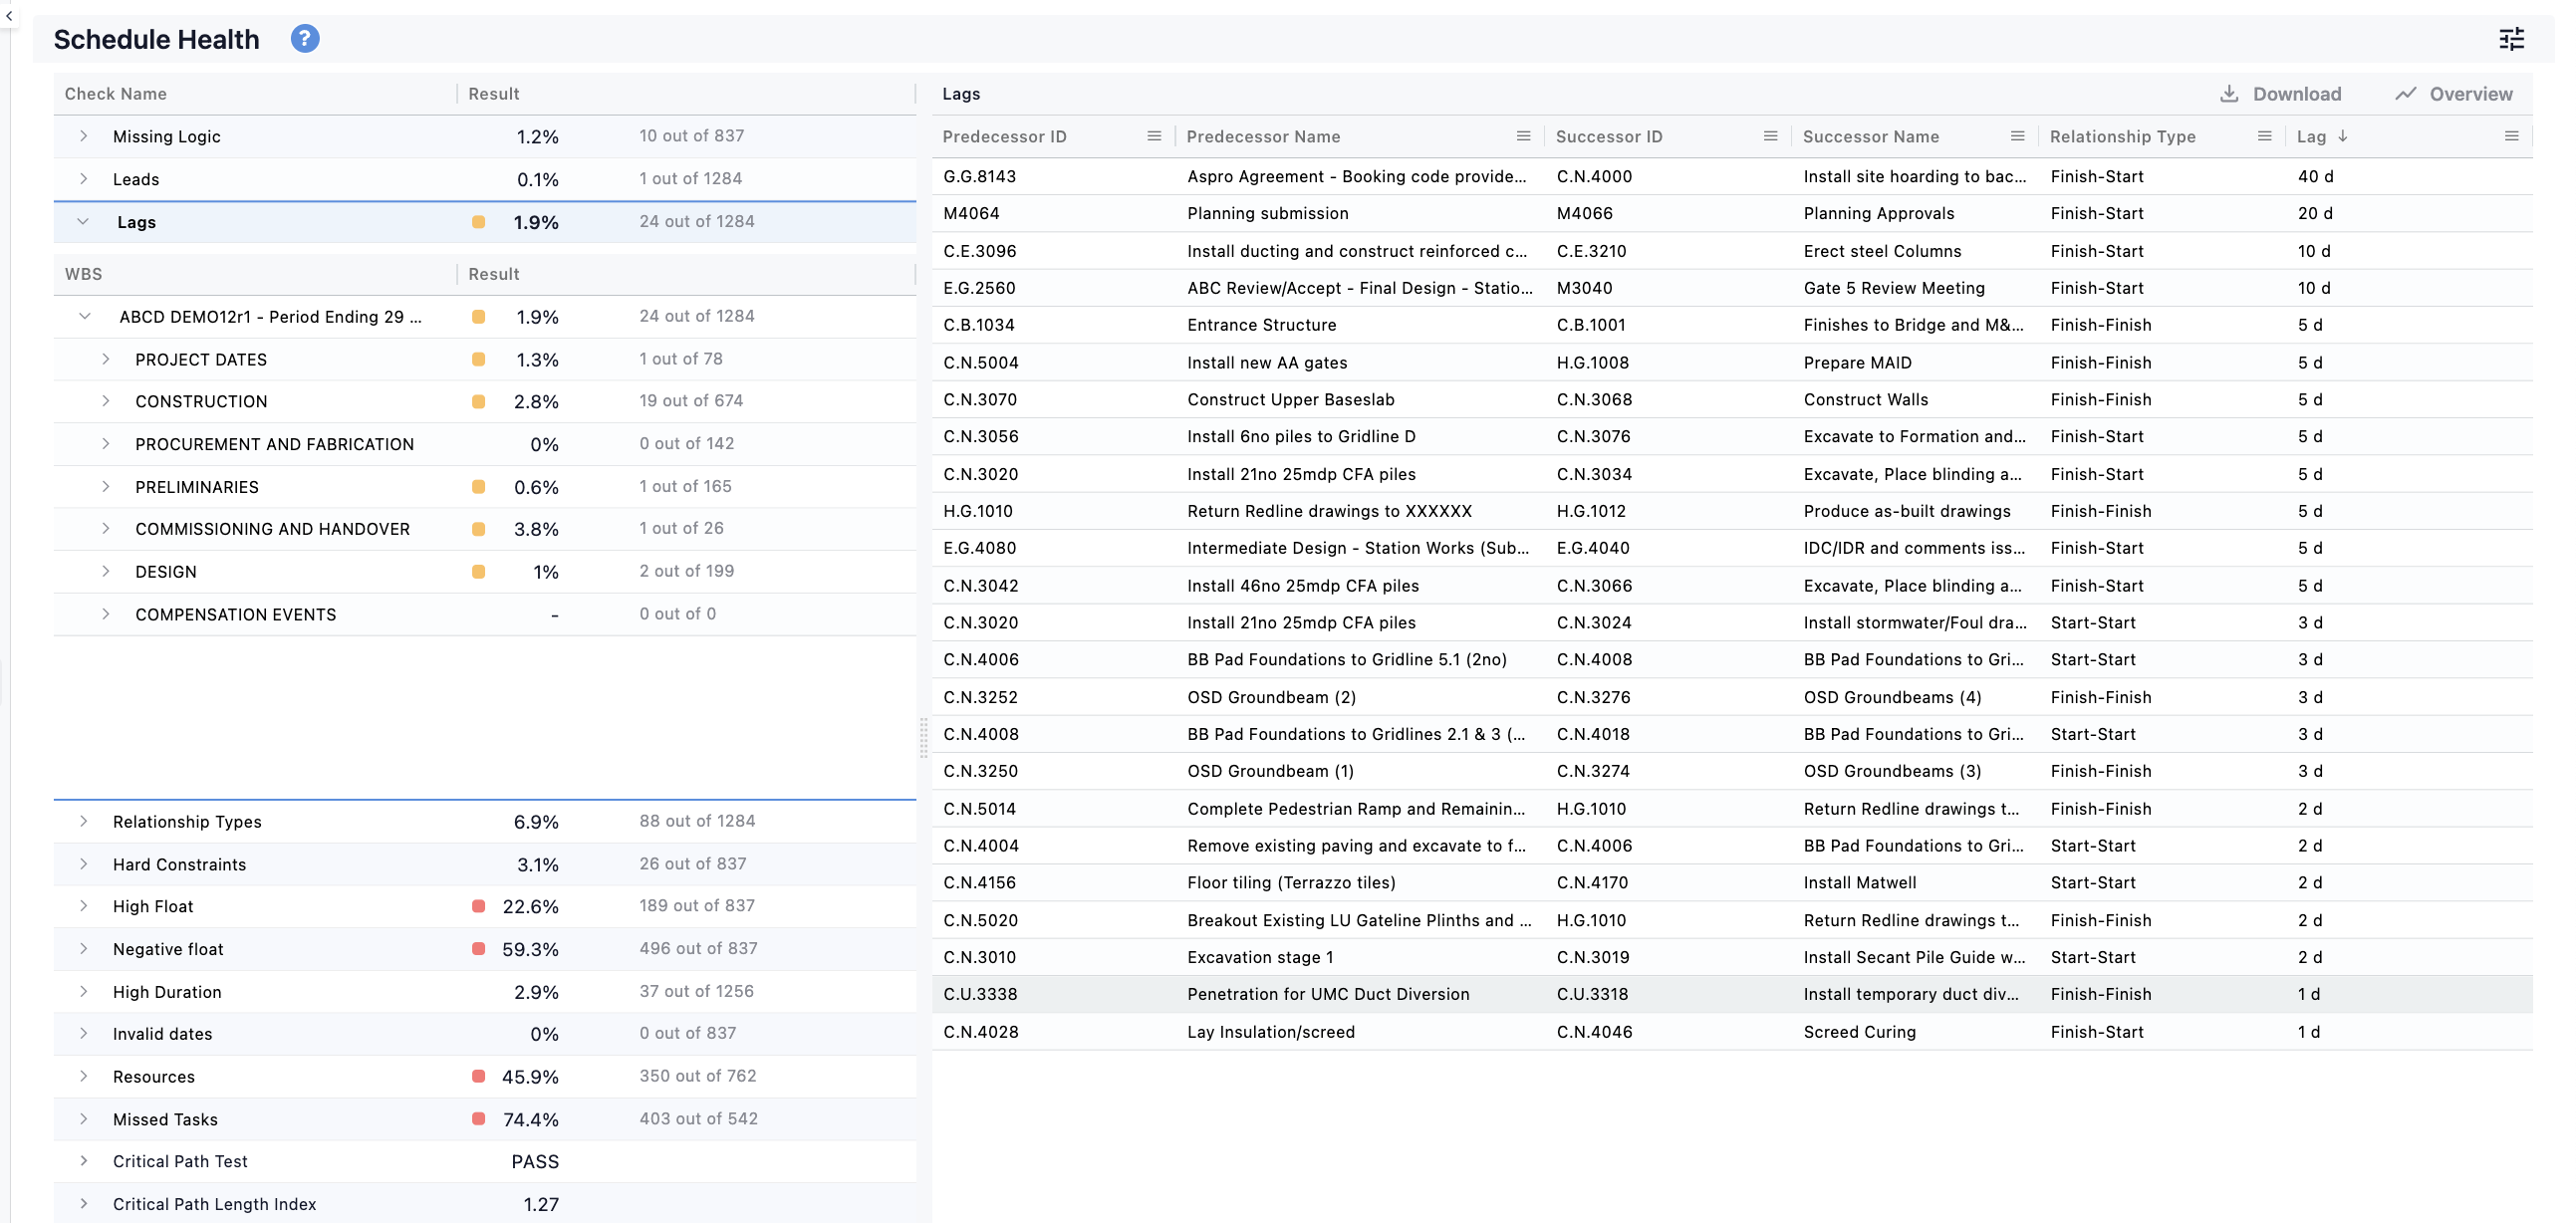
Download the list of activities failing a specific test
You can easily download the list of activities that fail a specific test- just click on the check (and WBS) that you care about and then click on the download icon. That’s it - simple!
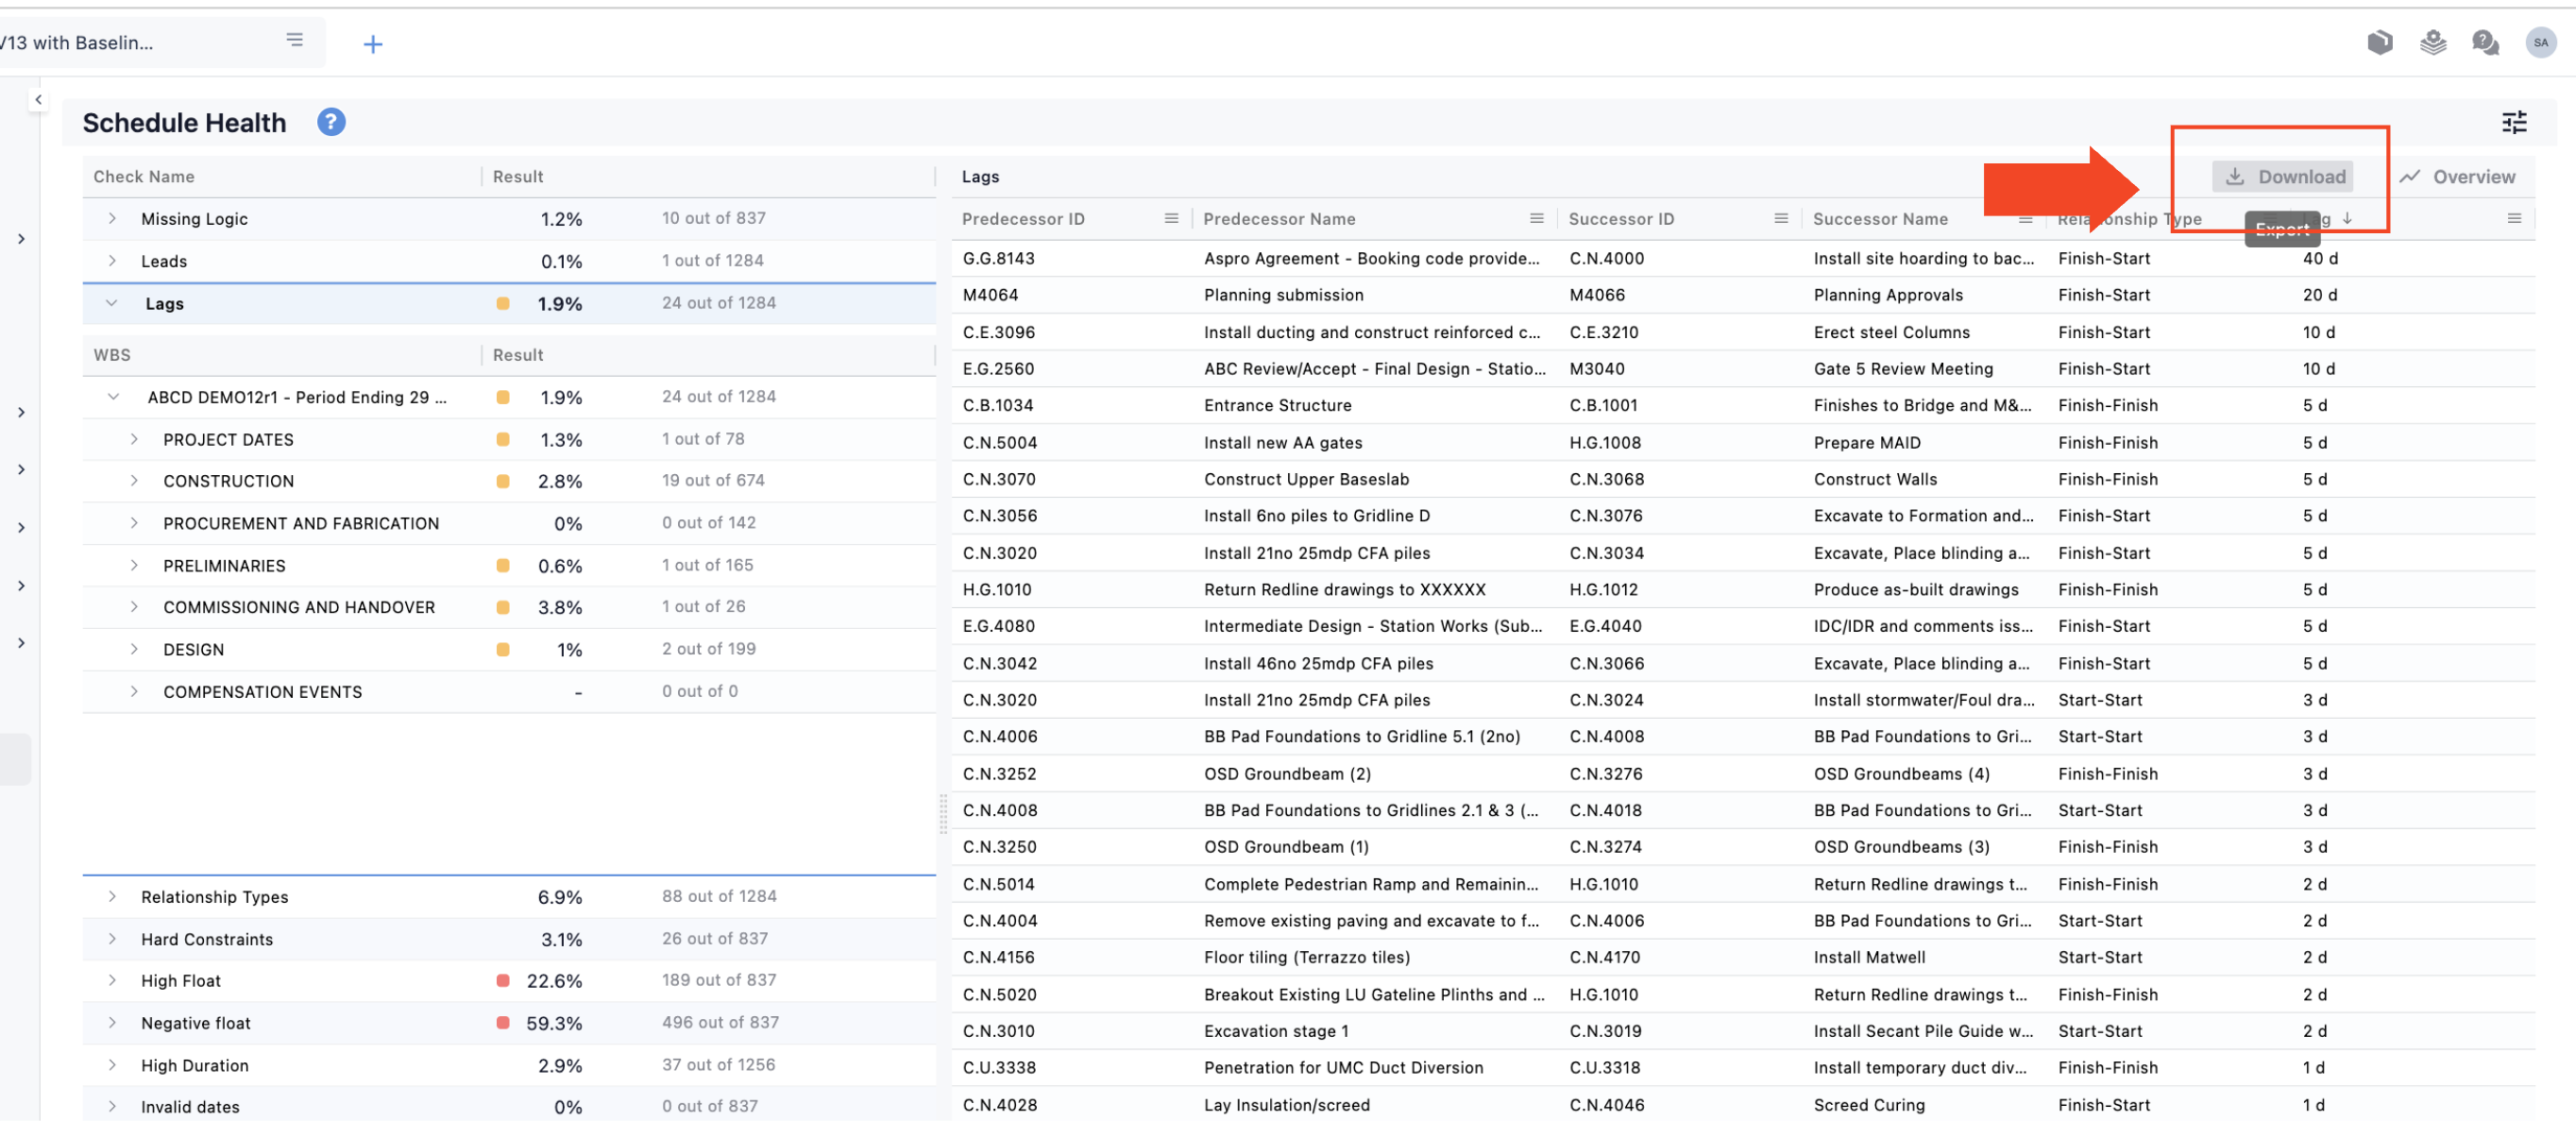
Set your own success and failure criteria
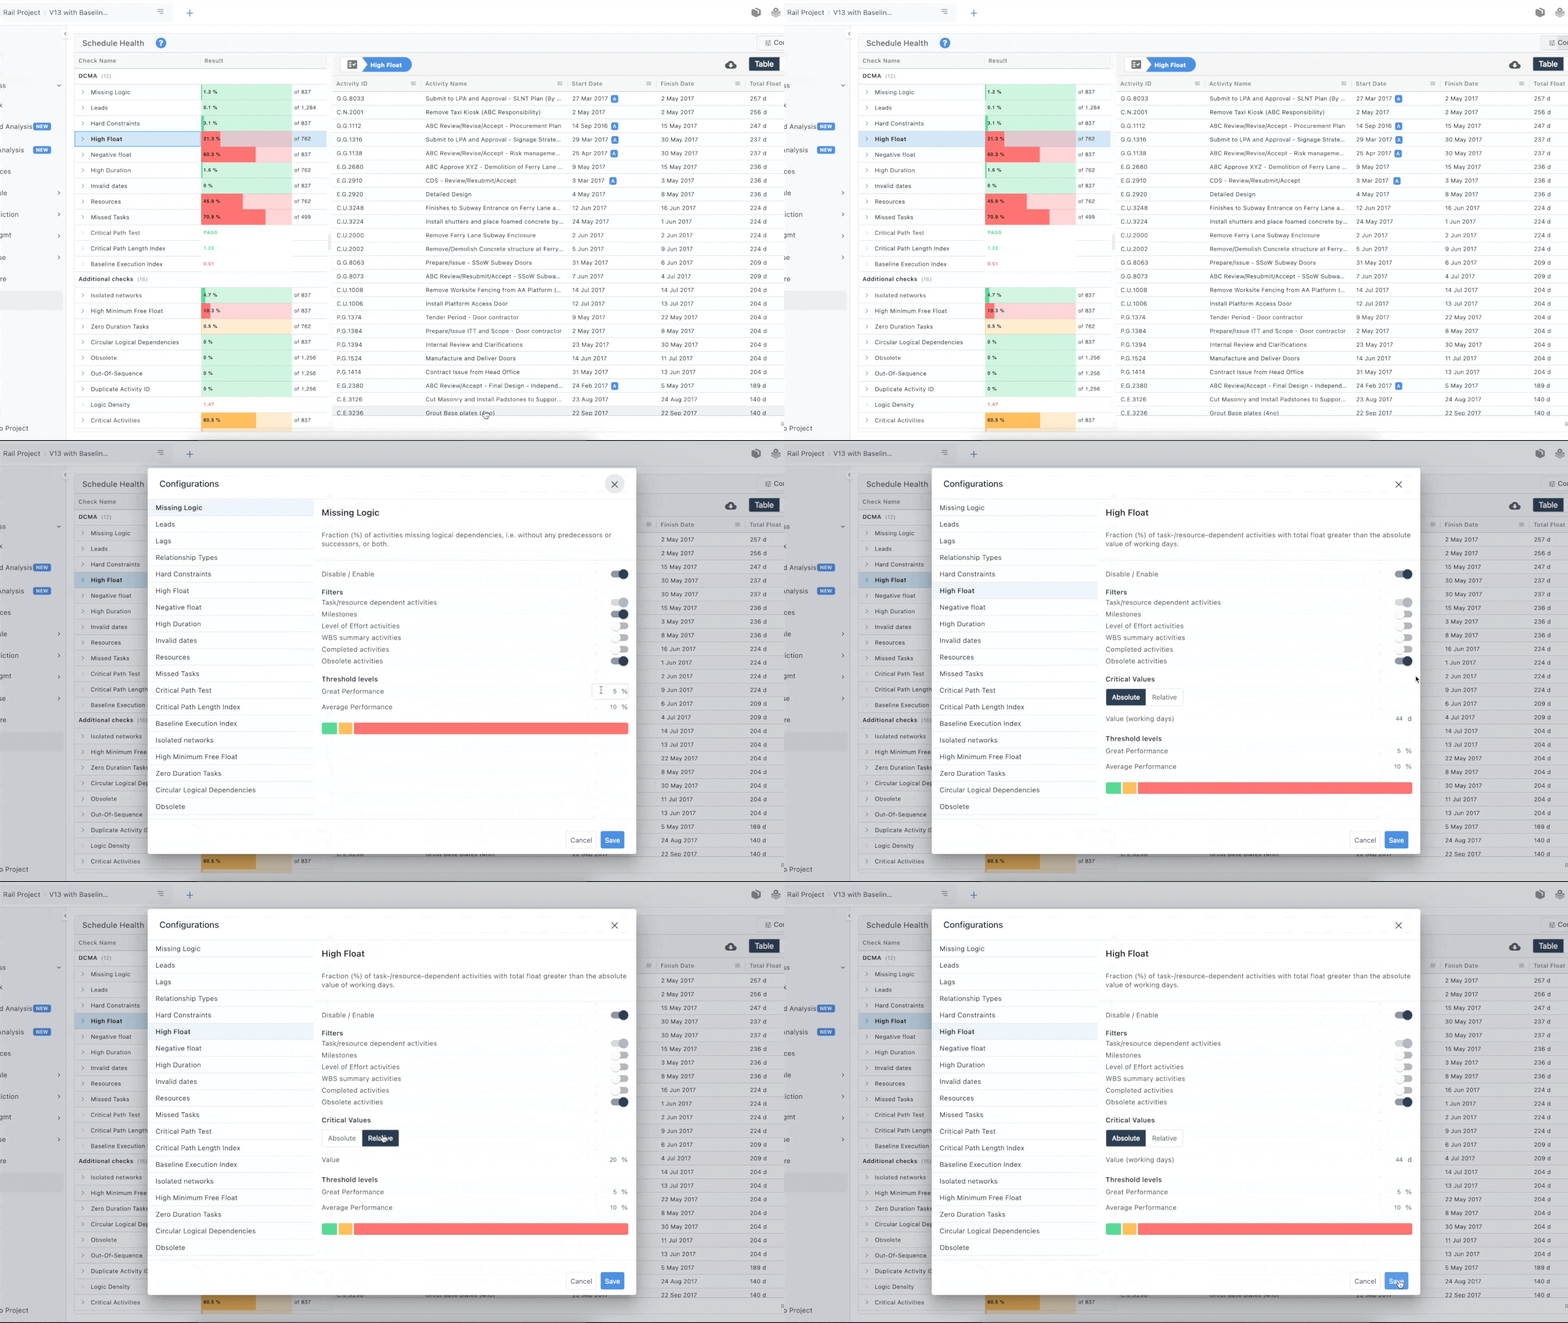
You can easily set your own threshold levels (what is considered as bad, average and great performance) for all the tests, turn checks on/off and configure which type of activities are taken under consideration for each check. Finally, you can edit check specific configurations (ie number of days in the High Float test)
