Release 125 – Gantt is here!
What’s New in Release 125?
1. Gantt Charts in Nodes & Links

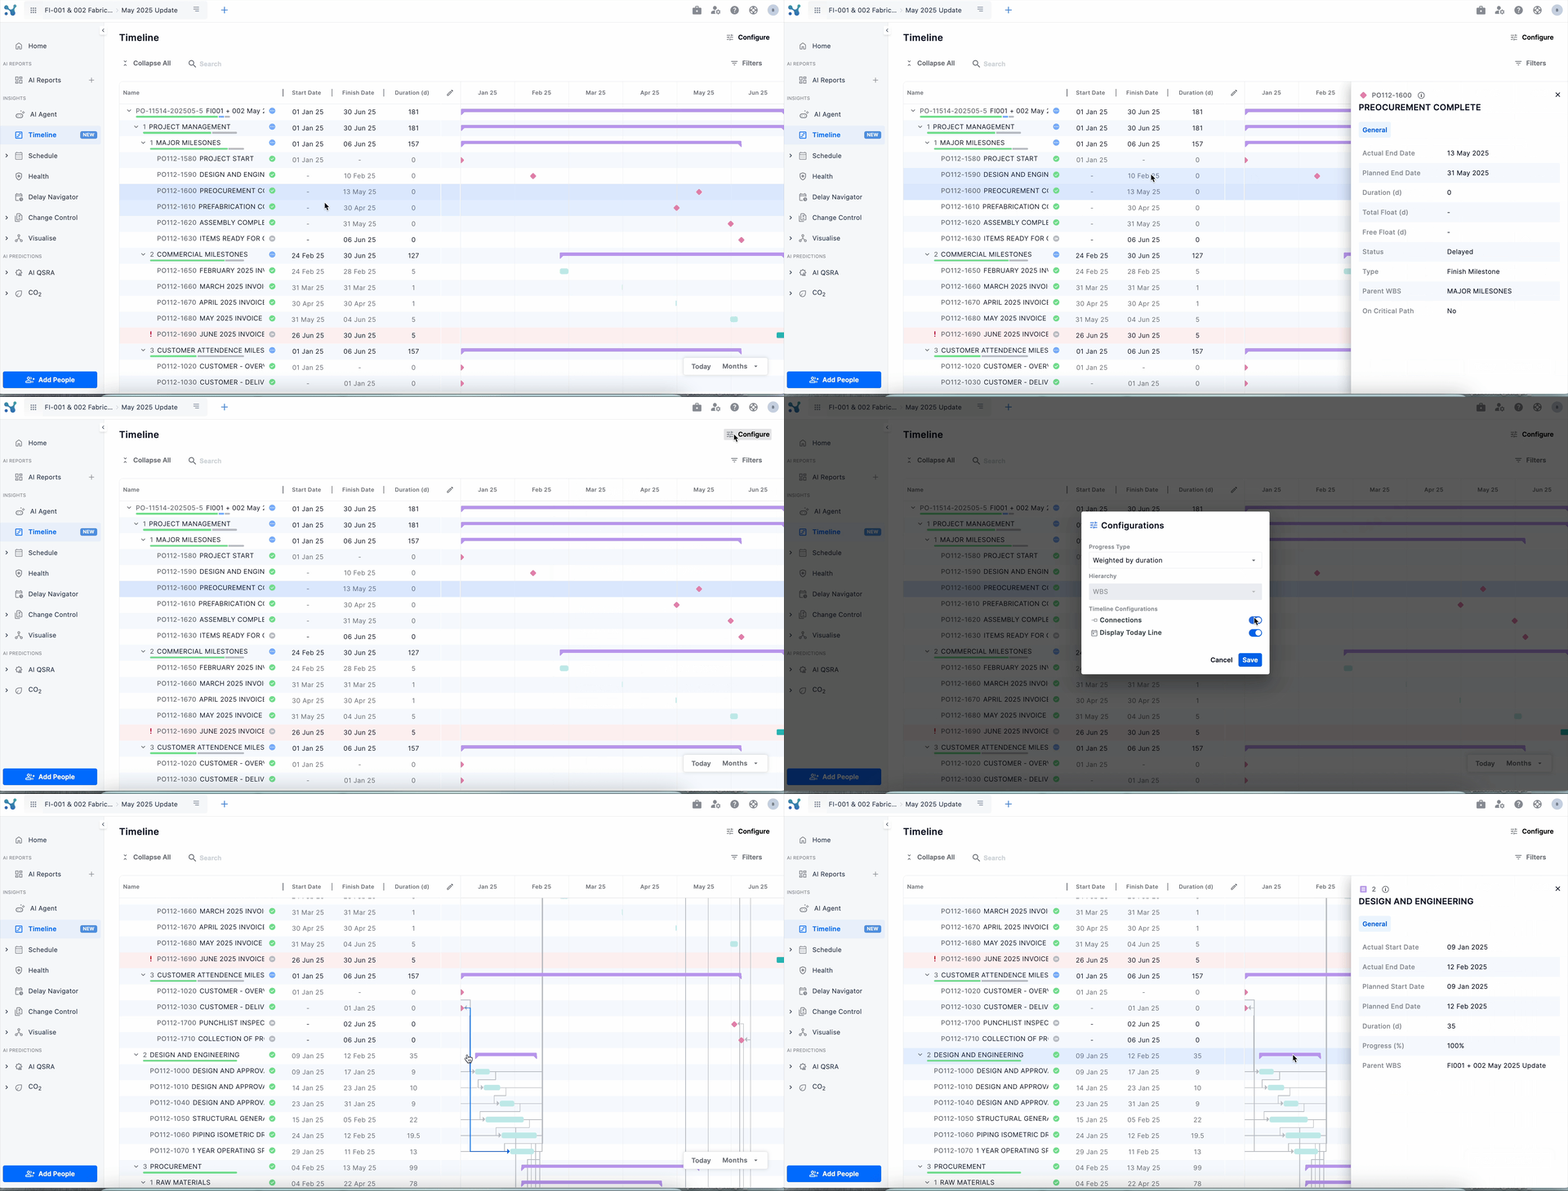
You can now view your project’s Gantt chart using the new Timeline screen. This is designed for users who need visibility into the schedule without needing to edit schedules in P6.
Key features include:
- Viewing activity details in one click
- Applying filters easily
- Configuring hierarchies and toggling view settings
- Seeing WBS progress at a glance by hovering
- Identifying critical activities quickly with clear visual cues
These functions cover the most important use cases for viewing schedules, without the complexity of P6.
2. New & Improved Change Control
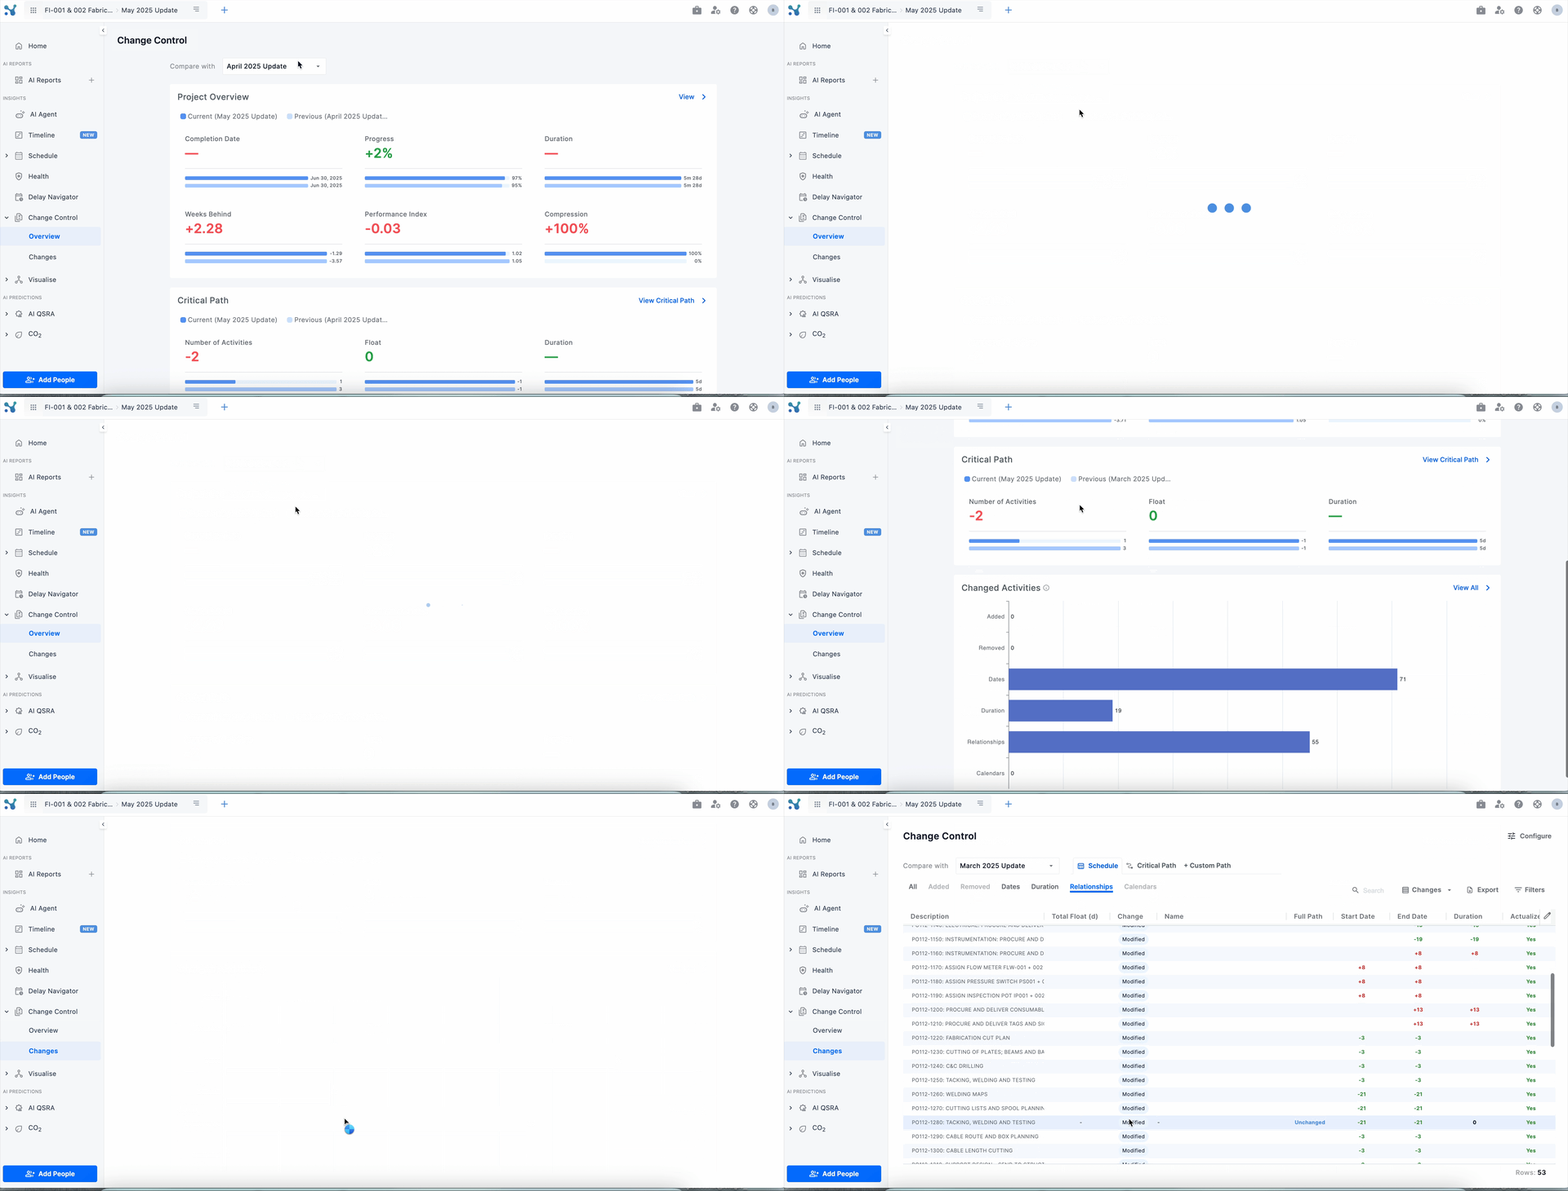
We’ve given the Change Control screen a complete revamp. It now includes two modes:
- Overview: Quickly spot key changes at a glance
- Details: Explore all changes across the full schedule
New functionality includes:
- Viewing all changes for an activity in a pop-up
- Seeing changes grouped into categories to reduce clutter
- Sorting by any column and customizing what is displayed
For example, you can now ask "Which activity had the largest duration change?" and get the answer instantly.
3. EVM Improvements
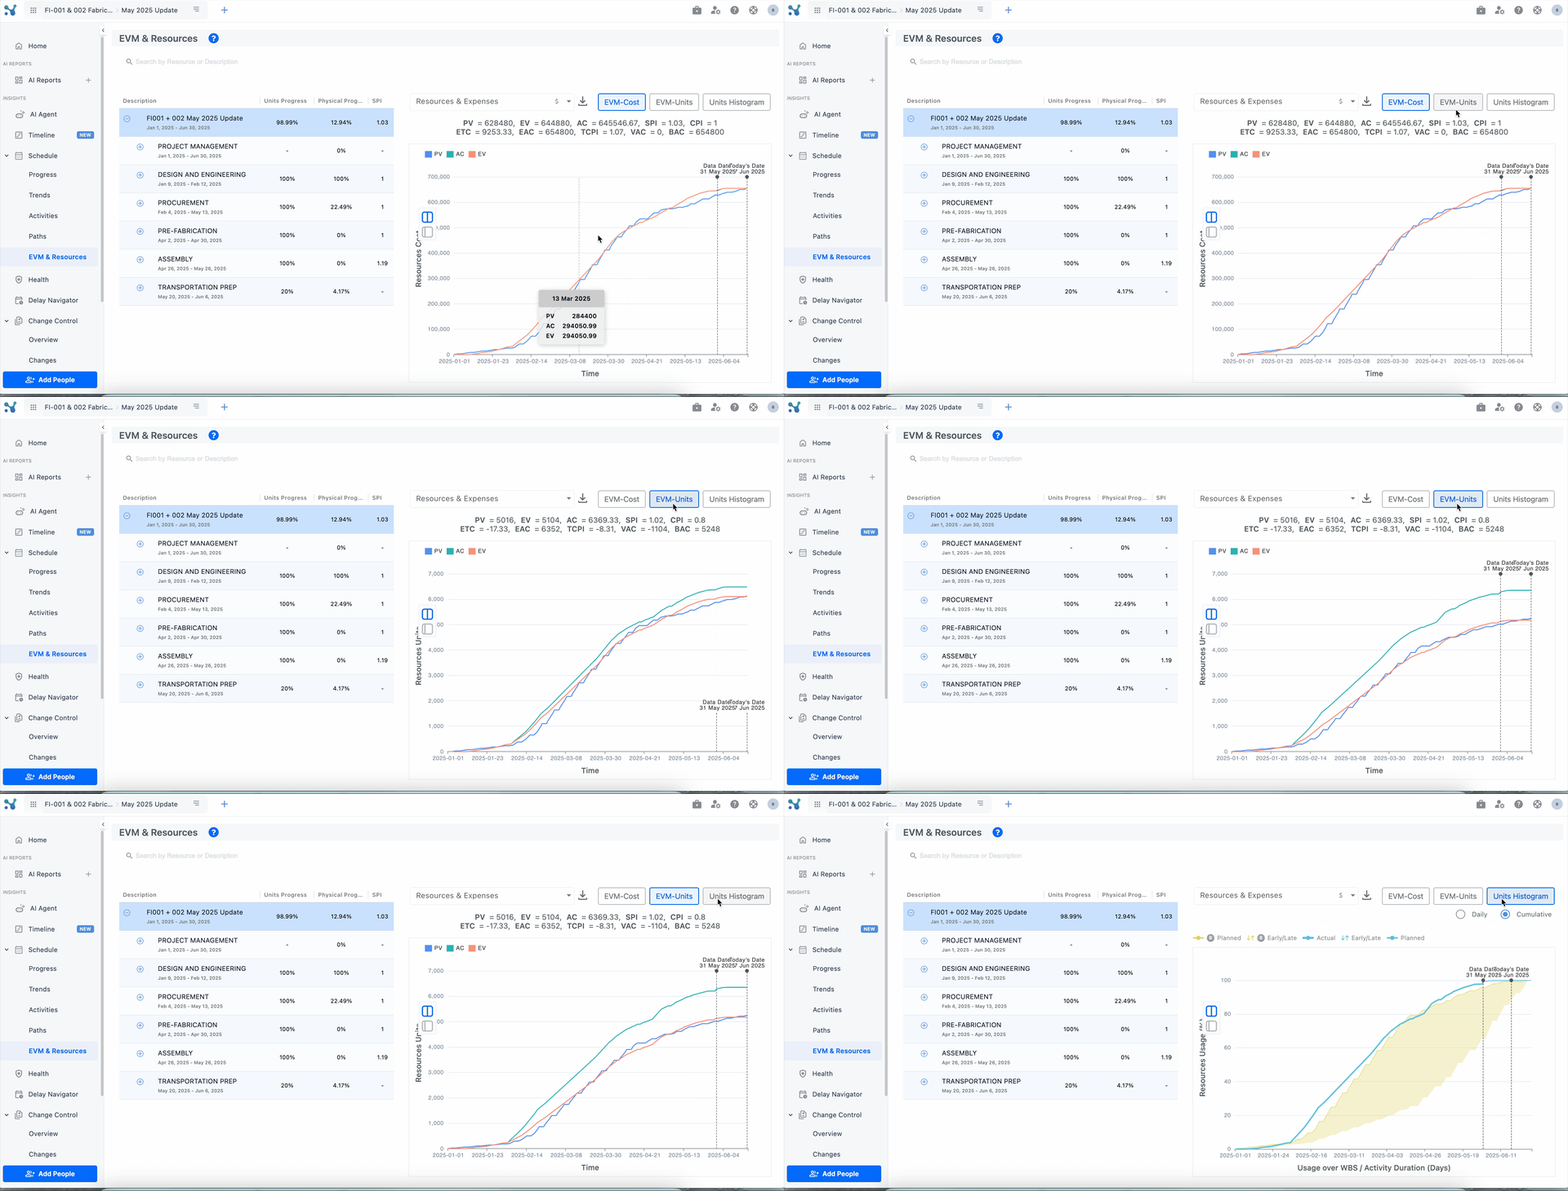
 We’ve added support for budgeted expenses in EVM. This removes a major blocker for teams who use this setup in P6.
Additionally, you can now view S-curves using units. This lets you track progress using the measurement that fits your project best.
- Expenses and units now supported in EVM
- S-curves available in both time and unit formats
Why These Changes Matter
- View Gantt charts without P6
- Apply filters and explore timelines without a steep learning curve
- Spot schedule changes faster and more clearly
- Track earned value using expenses and units
- Report with visuals that make sense to stakeholders
These updates give you more control, better visibility, and less hassle when managing your projects.
Stay tuned for our next release! 🚀

