Portfolio Trends
Overview
The Portfolio feature provides a consolidated view of all your projects within a higher-level portfolio structure. The Trends page is one of four key views in the Portfolio tool, offering performance tracking and trend analysis across your projects, programs, portfolios, and entire account.
This article will guide you through:
- Understanding the Trends page
- How to dive into specific trends and create reports based on them
- How to utilize the available information to quickly discern which projects needs your focus and dive into them
Key Functionalities
Modes
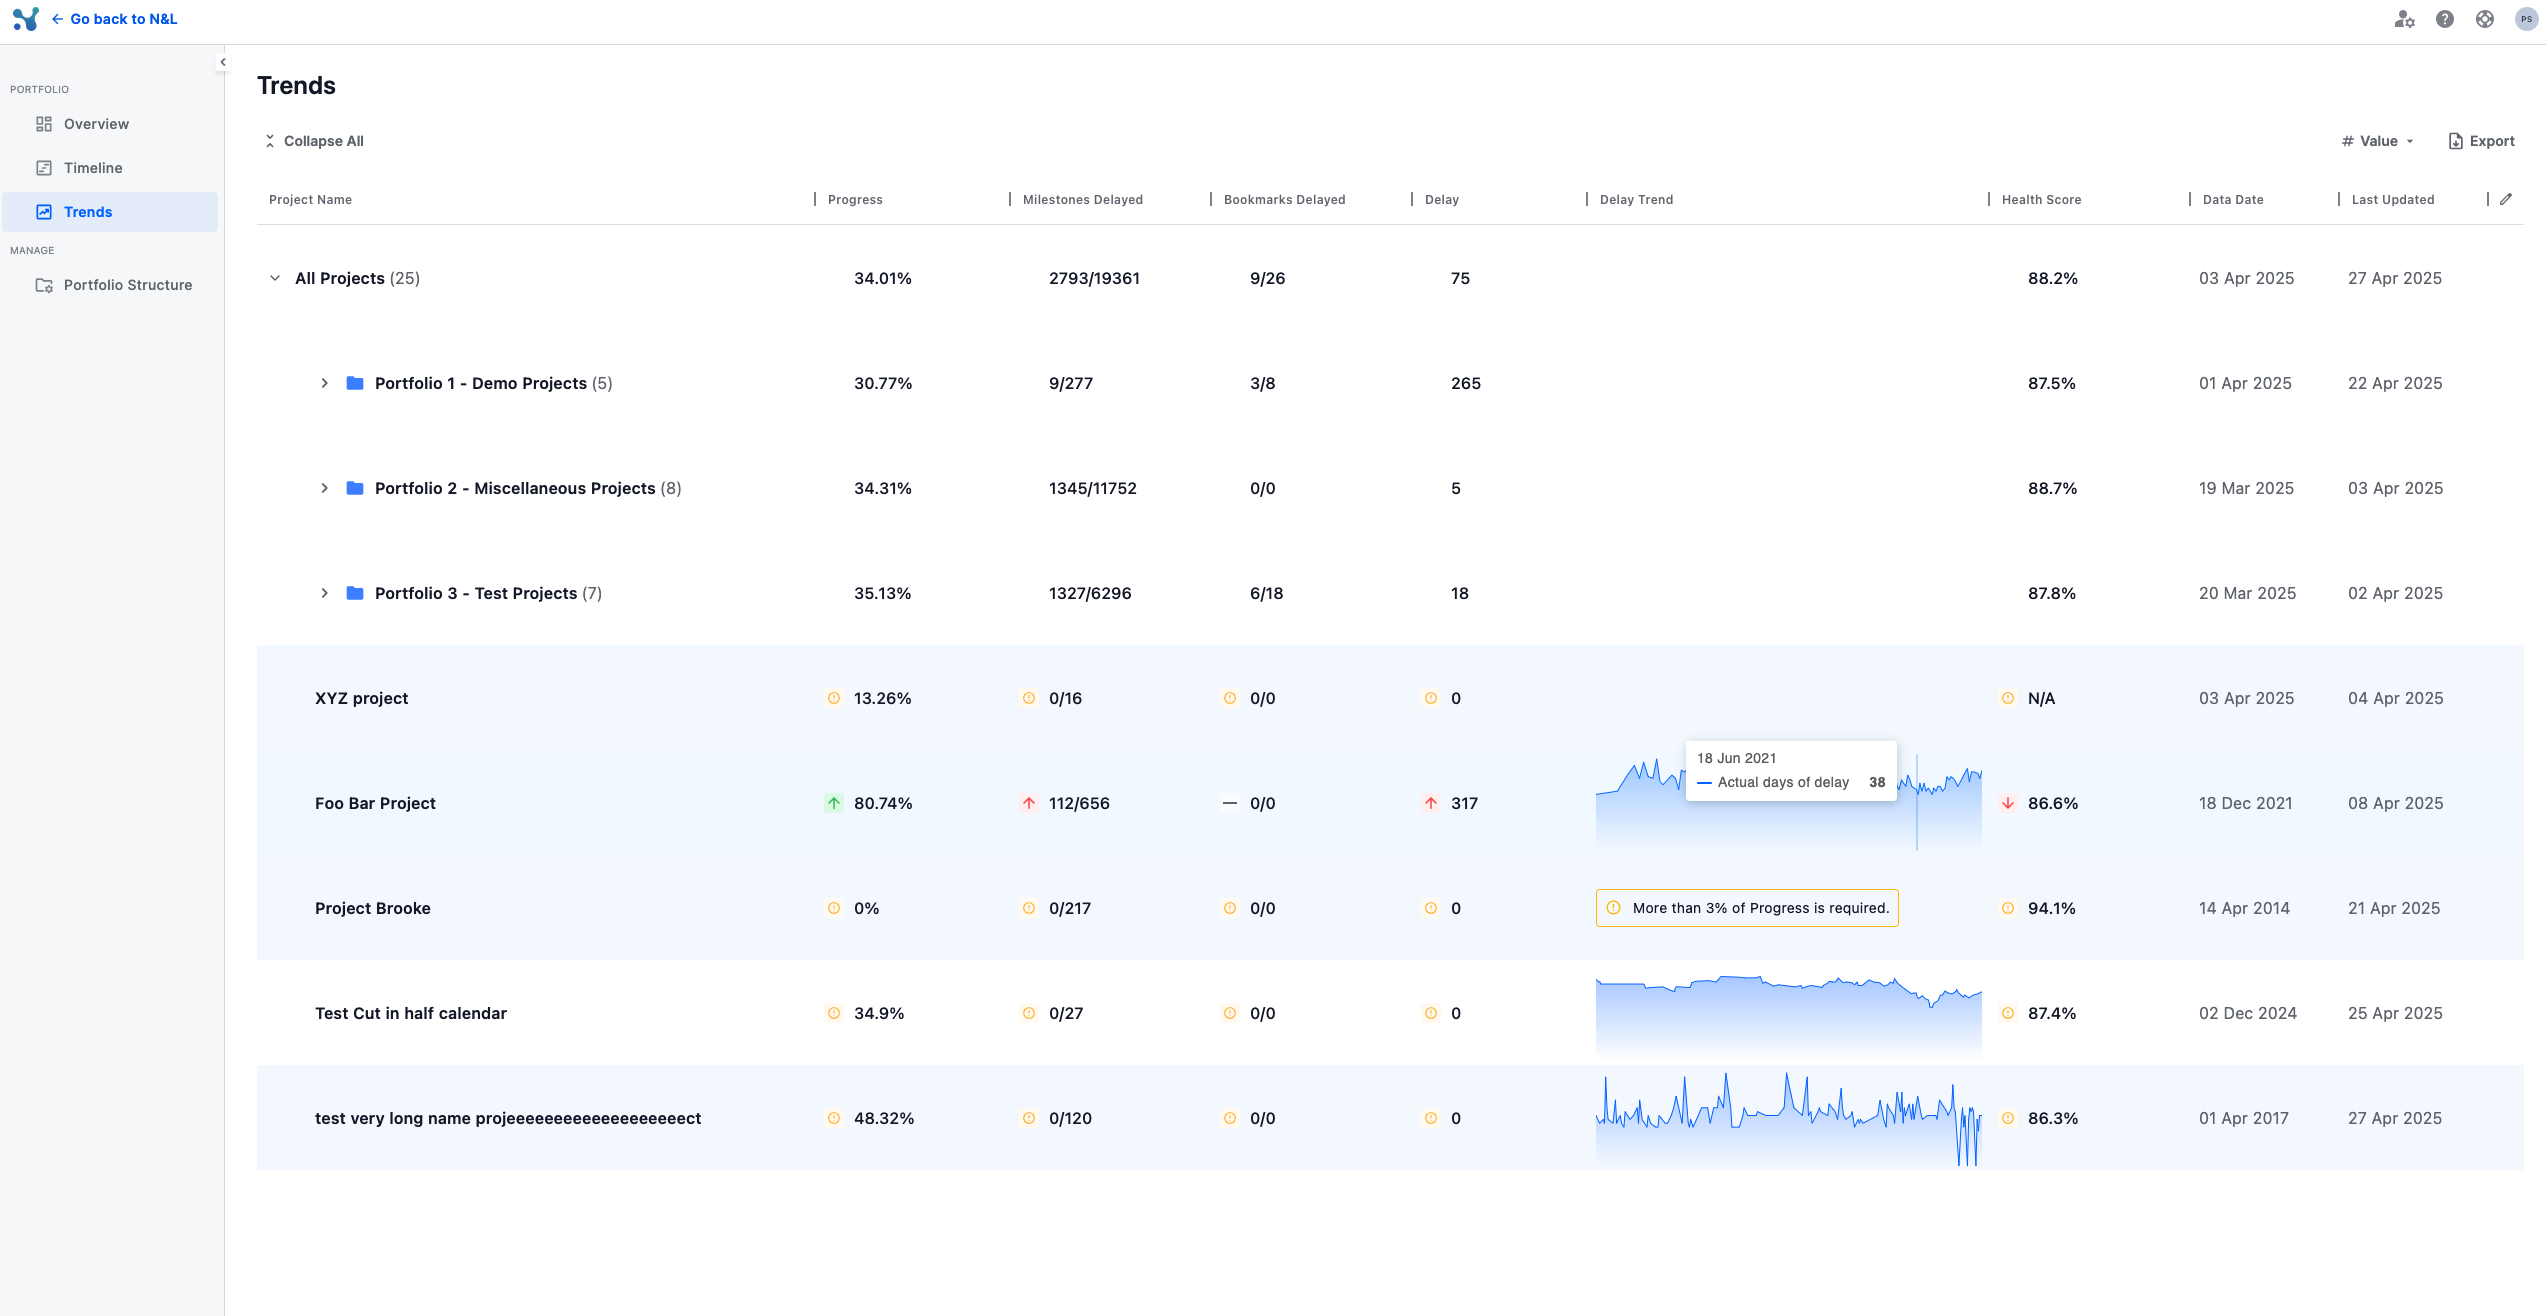
- Trends Mode (Default):
- Displays the latest value for each key performance indicator (KPI) per project.
- An arrow indicator shows the direction of change compared to the previous update.
- Clicking on a KPI opens a trend histogram, showing historical data over time.
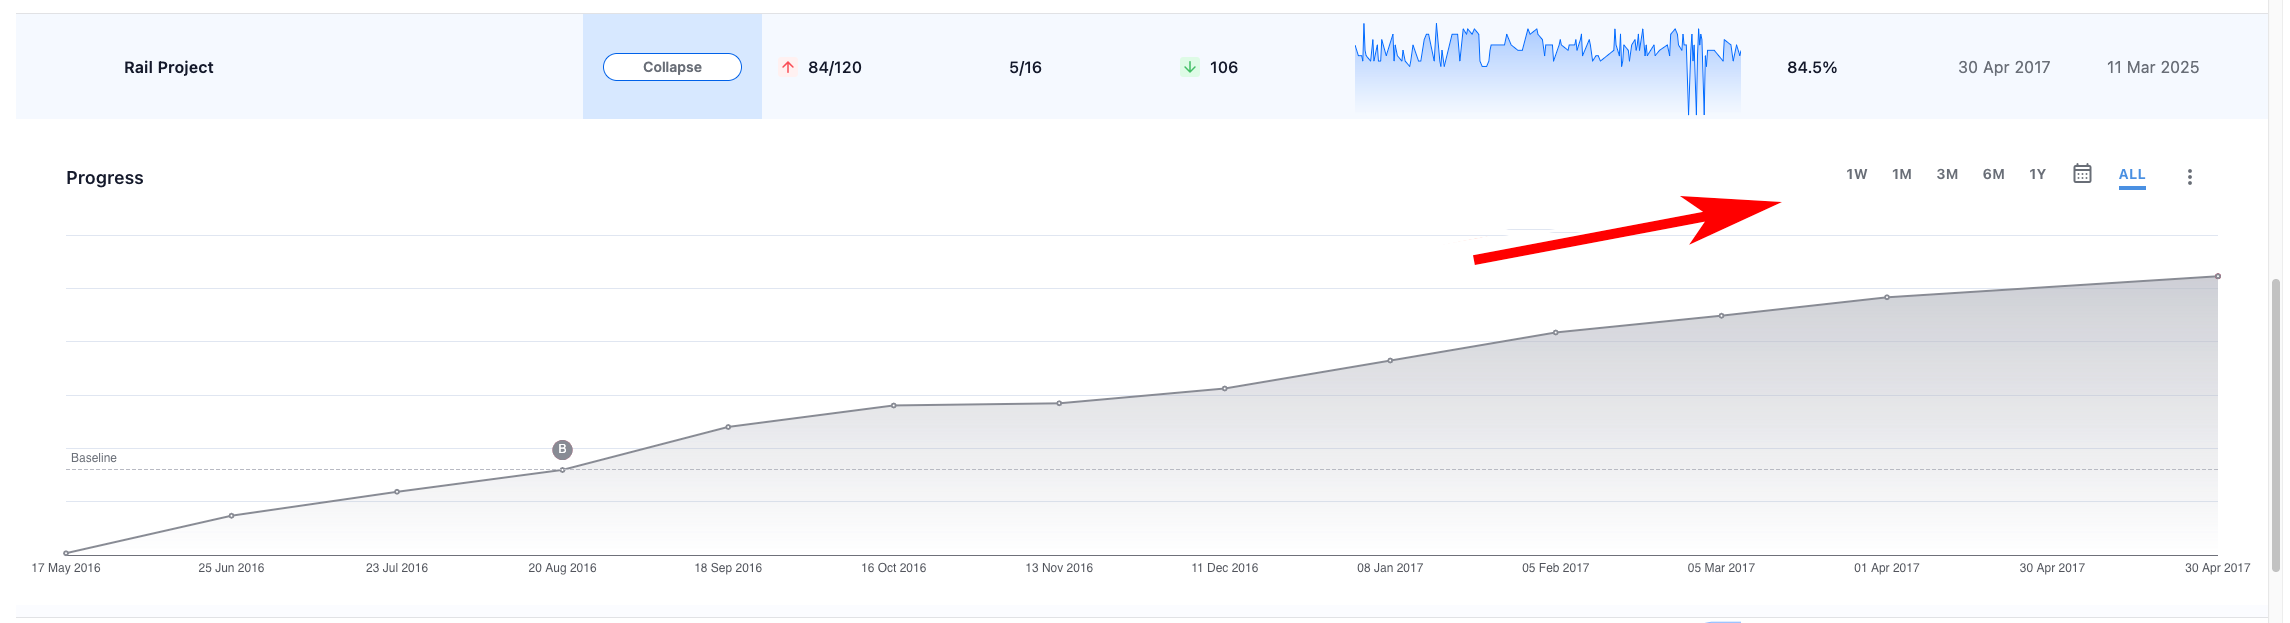
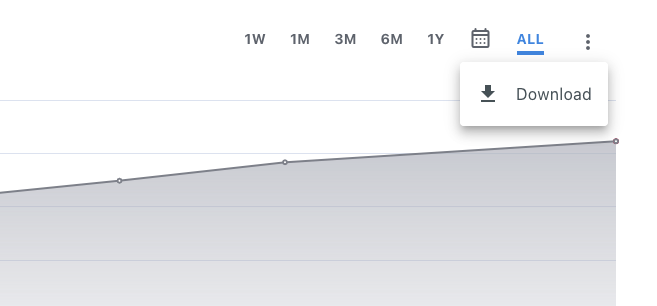
- Users can adjust the time range (1W, 1M, 3M, 6M, 1Y, or ALL) via the controls at the top right.
- Users can export the histogram as an image.
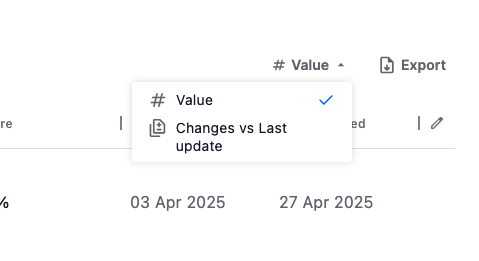
- Changes Compared to Previous Version Mode:
- Displays the delta (change) for each KPI compared to the last version of each project.
The page mode can be altered by the top right section of the page.
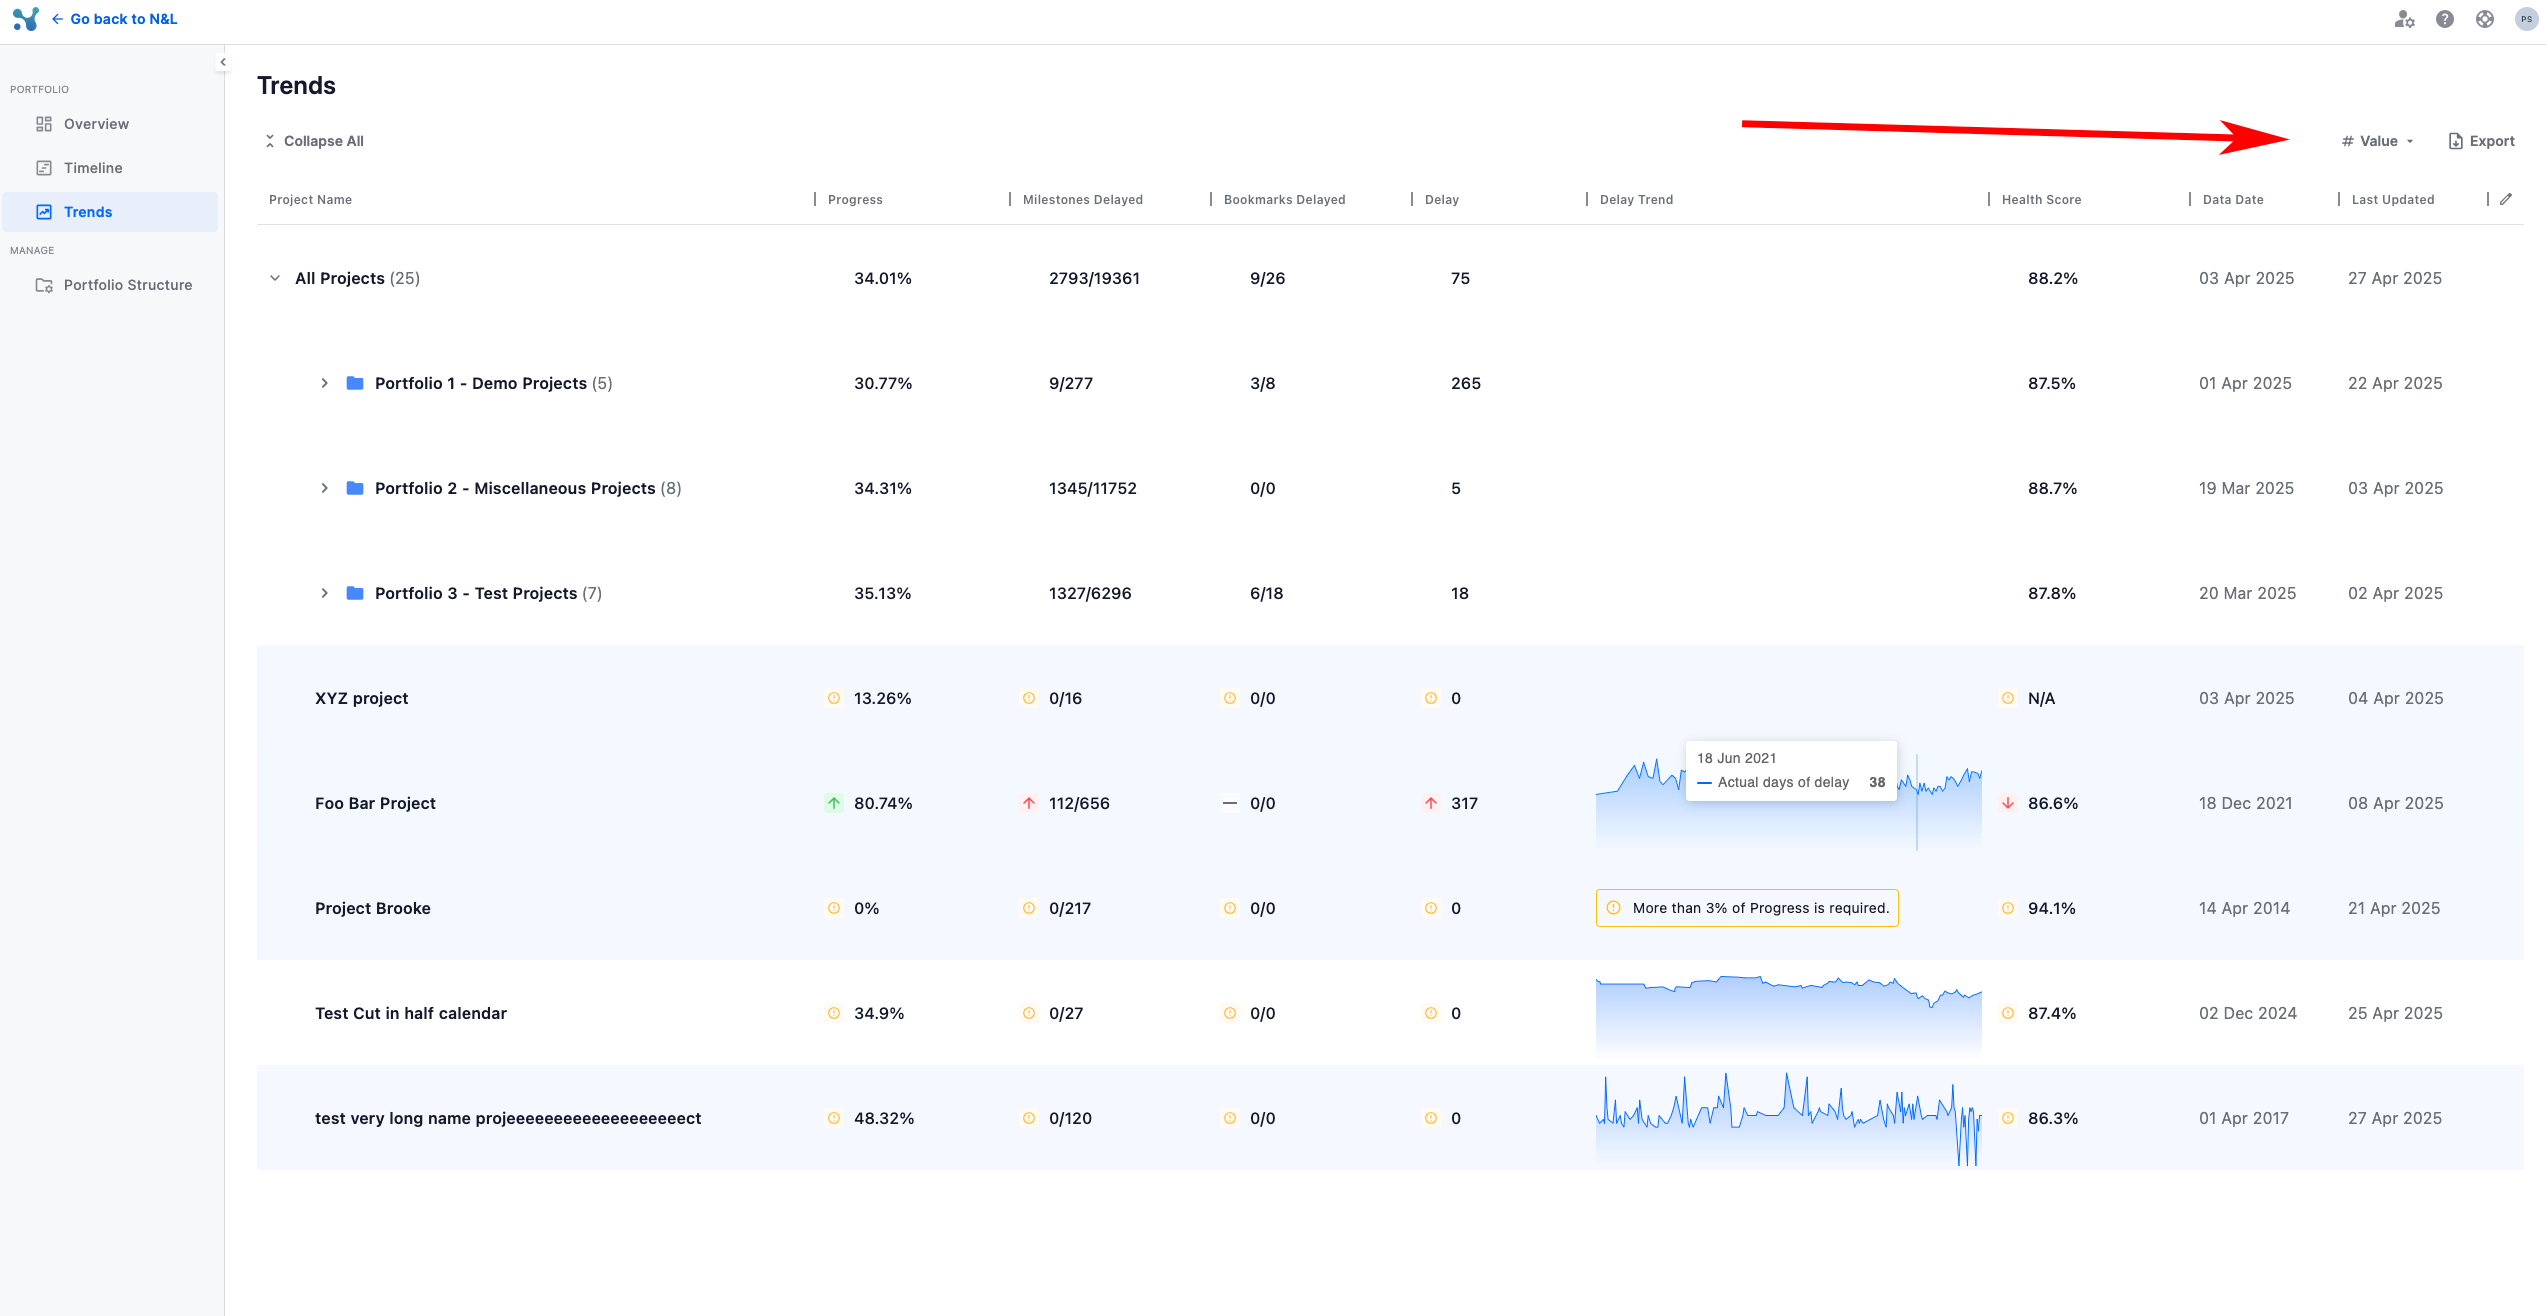
...where the 2 options are shown. The currently activated version is visible through a check mark.
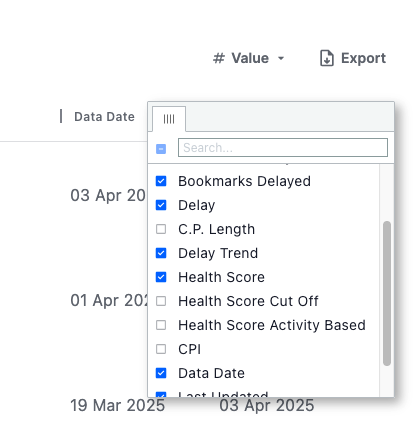
At the top right section of the page one can also modify the shown KPIs.
KPIs Available
By default, a subset of KPIs is shown, but users can customize the table by enabling additional KPIs. Available KPIs include:
- Progress
- Progress vs Baseline
- Milestones Delayed
- Bookmarks Delayed
- Delay
- Critical Path Length (C.P. Length)
- Delay Trend
- Health Score
- Health Score Cut Off
- Health Score Activity Based
- Cost Performance Index (CPI)
- Data Date
- Last Updated
Dedicated KPI Trend Exploration
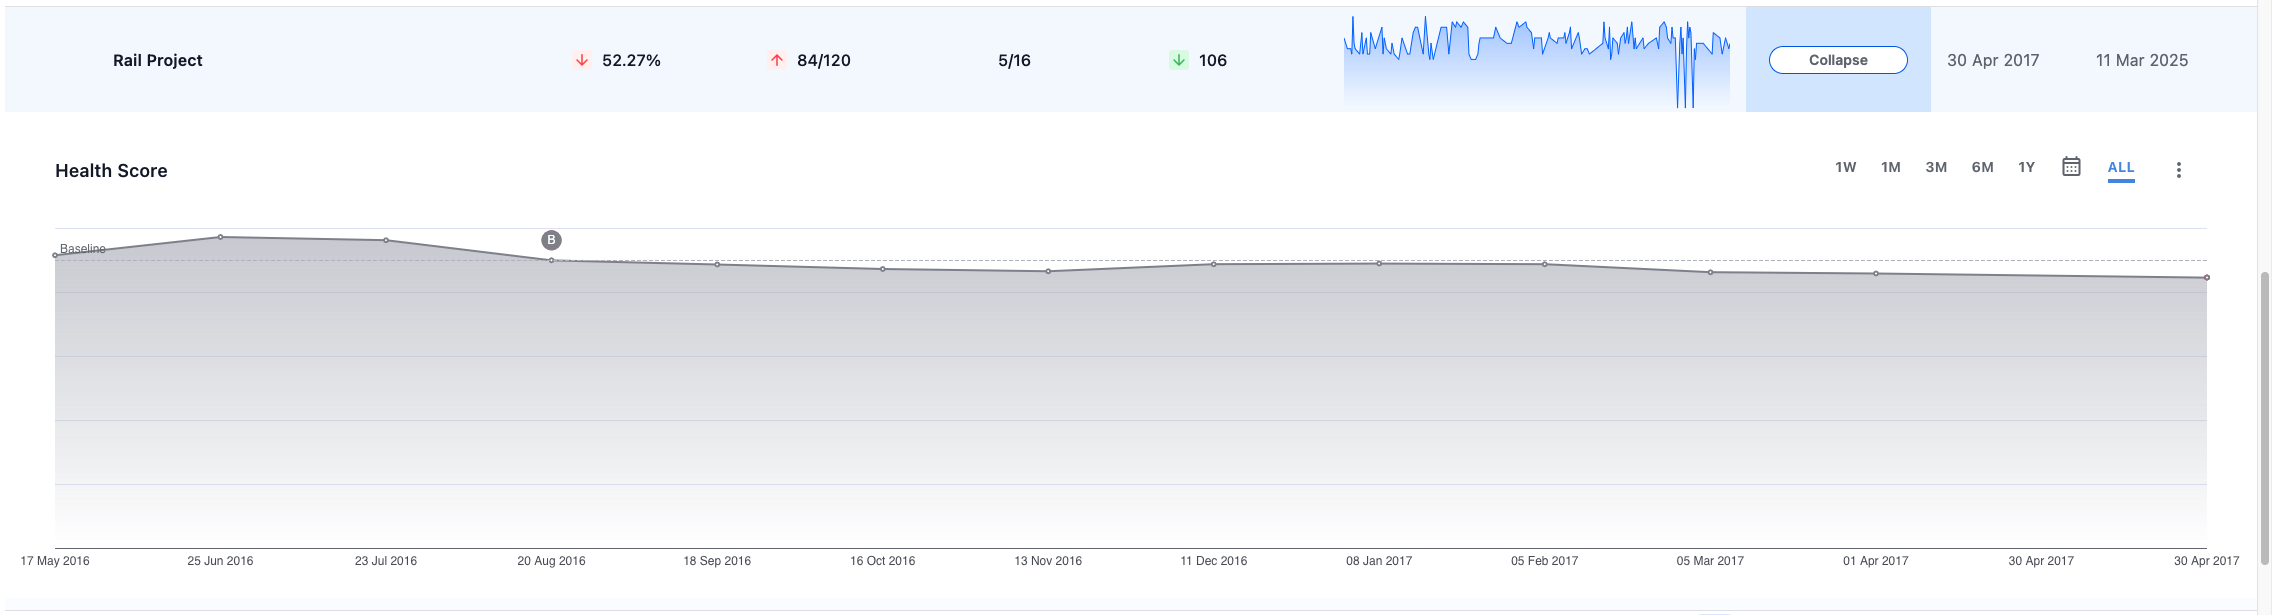
Understanding performance over time is crucial for successful portfolio management. On the Trends page, users can now dive deep into any project KPI with just a click.
When a user clicks on any KPI value in the table, a trend histogram opens, showcasing the evolution of that KPI across all historical project schedule versions. This gives users immediate visual insight into how performance indicators like Progress, Health Score, or Delay have changed over time.
The trend across the lifespan of a project of the health KPI, when expanded.
To support reporting and further analysis, users can also export the histogram as an image, making it easy to include in presentations, share with stakeholders, or archive for record-keeping.
The portfolio feature ensures that every critical KPI is not just a static number but a dynamic story — accessible, visualized, and shareable.
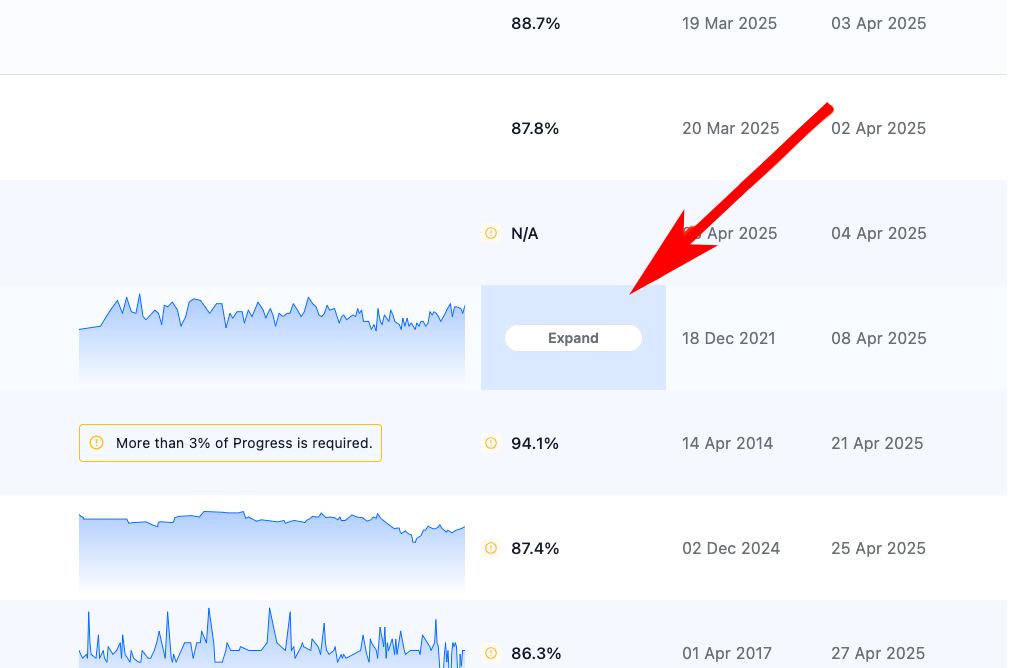
Seamless Deep-Dive into Individual Projects
While the Trends page offers a powerful portfolio-level overview, sometimes users need to zoom into specific projects for more detailed insights.
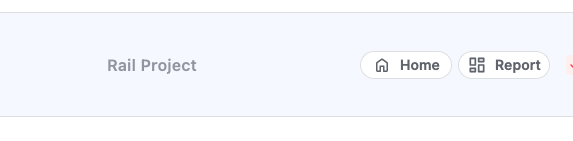
To facilitate this, hovering over any project row reveals two quick-access buttons:
- Home: Opens the project’s main dashboard in a new tab, allowing users to explore the full set of project-specific data, schedules, and updates.
- Report: Opens a detailed project progress report, giving an in-depth view of the project's health, key dates, deliverables, and more.
These shortcuts ensure that moving from high-level portfolio analysis to detailed project investigation is seamless and intuitive.
With a simple click, users can navigate from broad portfolio KPIs to the heartbeat of individual projects, maintaining full visibility across every level of their work.