Release 124 – Understand Delay Contributions at a Glance
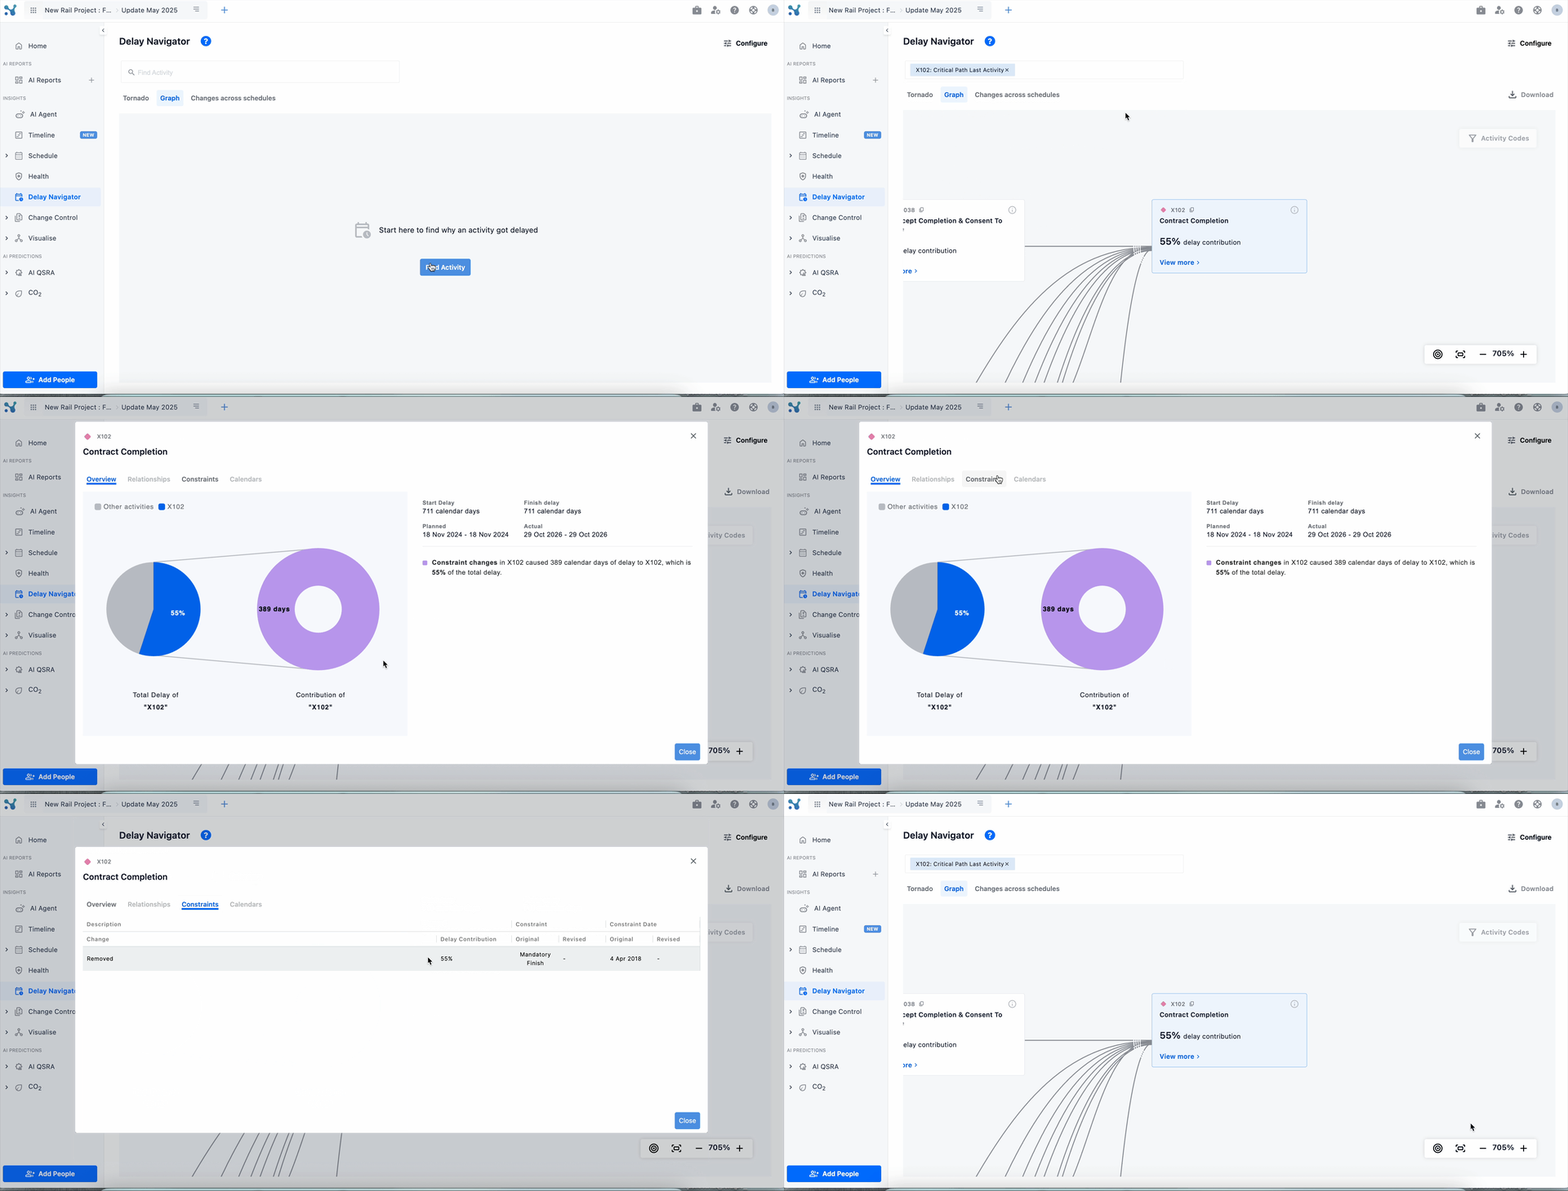
The latest update to Delay Navigator makes it easier to explain why your project is delayed. The new Explanation Card gives you a clear, visual breakdown of how each activity contributes to the delay, including start and finish shifts, duration changes, logic changes, and more. All the information is in one place so you can quickly understand what happened and communicate it clearly. Whether you're investigating root causes or preparing stakeholder updates, this upgrade helps you move faster with more confidence.
What’s New in Release 124?
1. A New Explanation Card

Delay Navigator now includes a pop-up Explanation Card that breaks down the story behind each delay.
Here’s what you can do:
- Understand delay contributions instantly
See how much a specific activity is delaying another, both in days and percentage. - Break it down by type
Delay contributions are now categorized into:- Start or end date shifts
- Duration increases
- Logic changes (new!)
- Constraint changes (new!)
- Calendar changes (new!)
- Addition of new activities
This gives you one clear view that you can quickly interpret and drop into your reports.
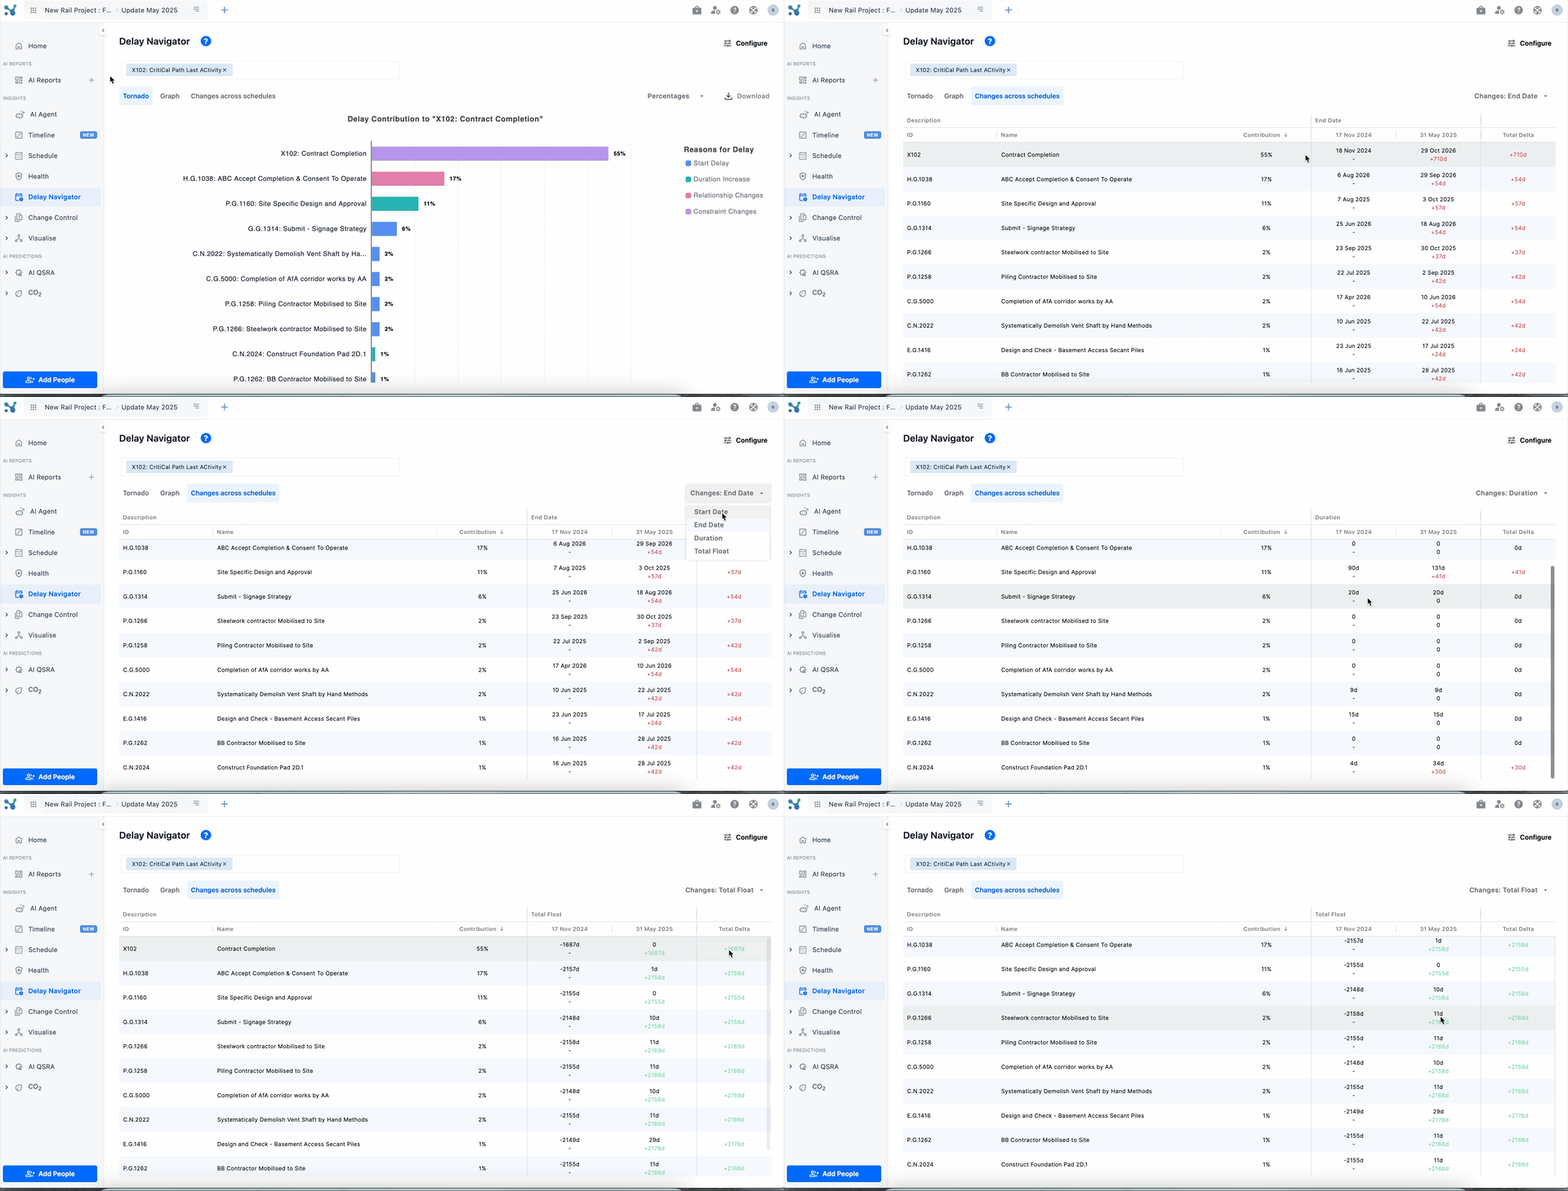
3. Activity Change Timeline Table
We've added a table that shows how activity data has changed across updates. This helps you track when things started going wrong, not just why.
- See historical changes to activities
- Spot patterns over time
- Trace the source of a delay to a specific update
Why These Changes Matter
- Get instant, visual explanations for delays
- Understand not just what changed, but when and how
- Build clearer, more credible reports
- Save time digging through schedule history
These updates make Delay Navigator more powerful, your reports more accurate, and your updates easier to explain.
Stay tuned for our next release! 🚀

