💰 Cost Risk (QCRA)
This screen enables you to:
- Enter base costs on your project's activities and WBS levels
- Apply cost uncertainty distributions to every costed row
- Assign cost risk events from the Cost Risk Register
- Run a Quantitative Cost Risk Analysis (QCRA)
- Review cost risk results for any activity, WBS, or the full project
- Export results and graphs
QCRA works like QSRA, but for cost: it uses Monte Carlo simulations to assess how cost uncertainty and cost risk events affect the overall cost risk profile of your project.
Where to find it
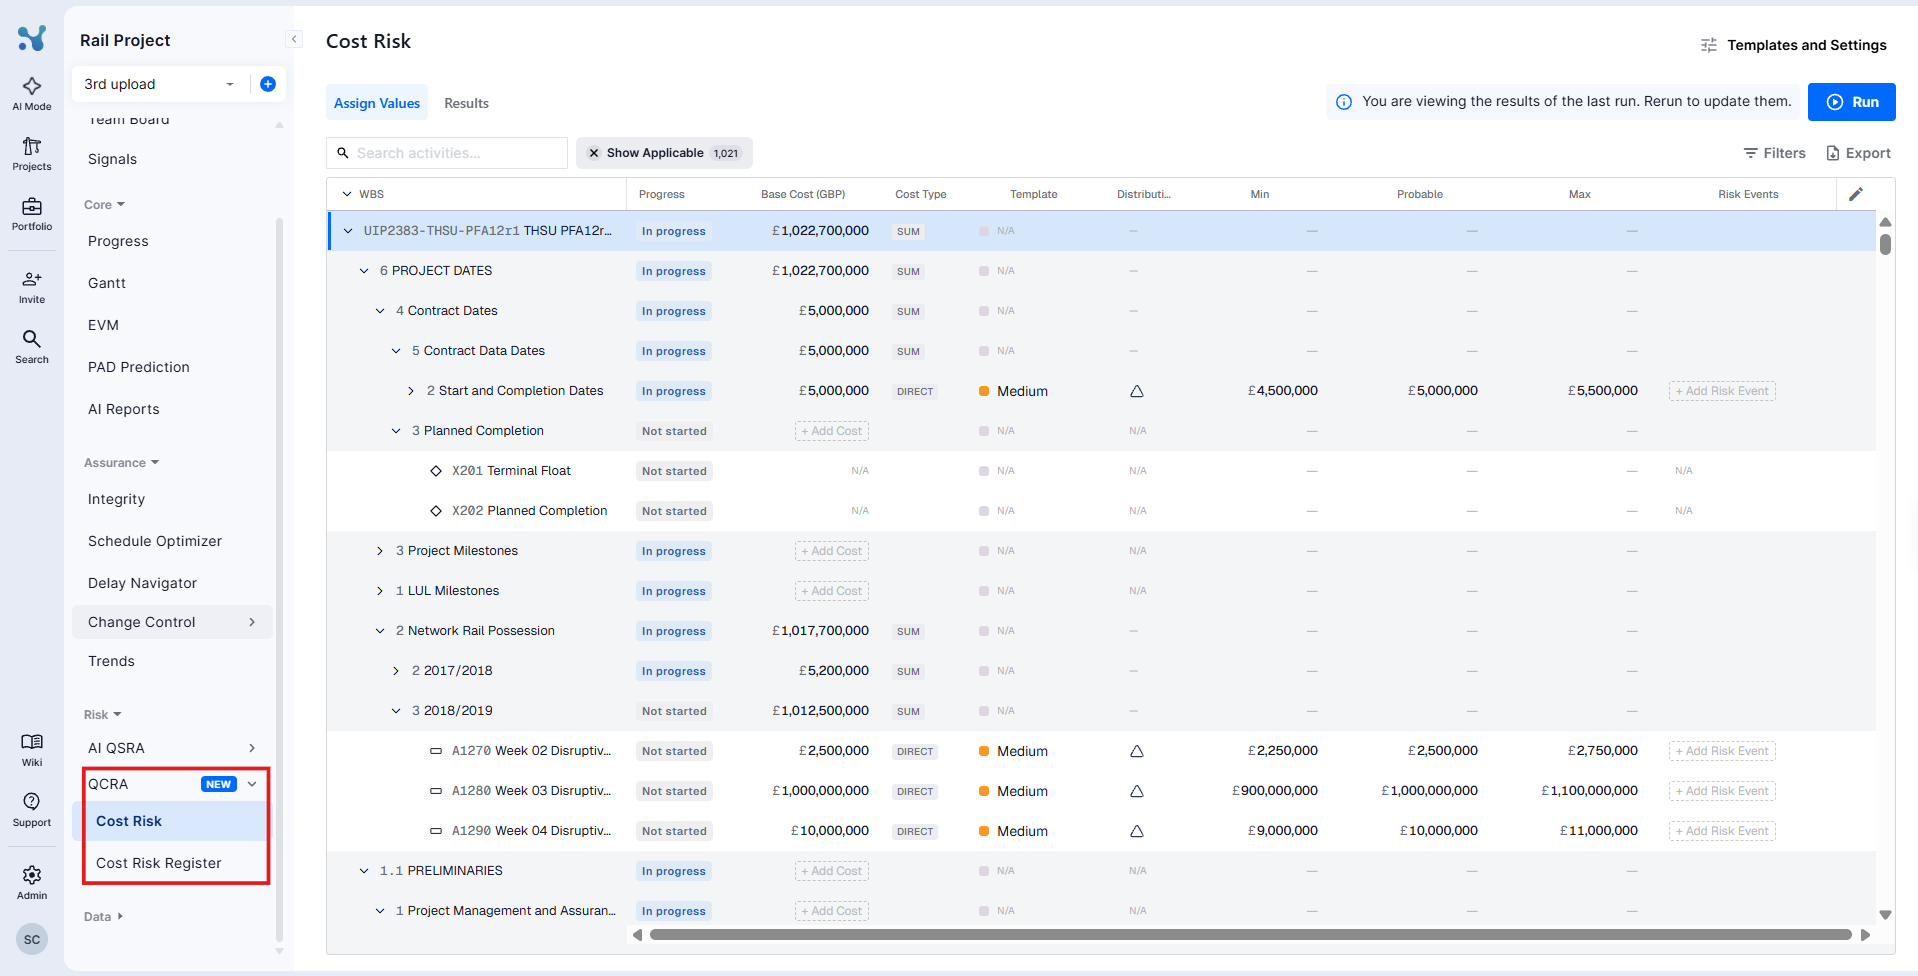
Open the Risk section in the left navigation and expand QCRA:
- Click Cost Risk to open the cost table.
- Click Cost Risk Register to manage your cost risk events.
Entering base costs
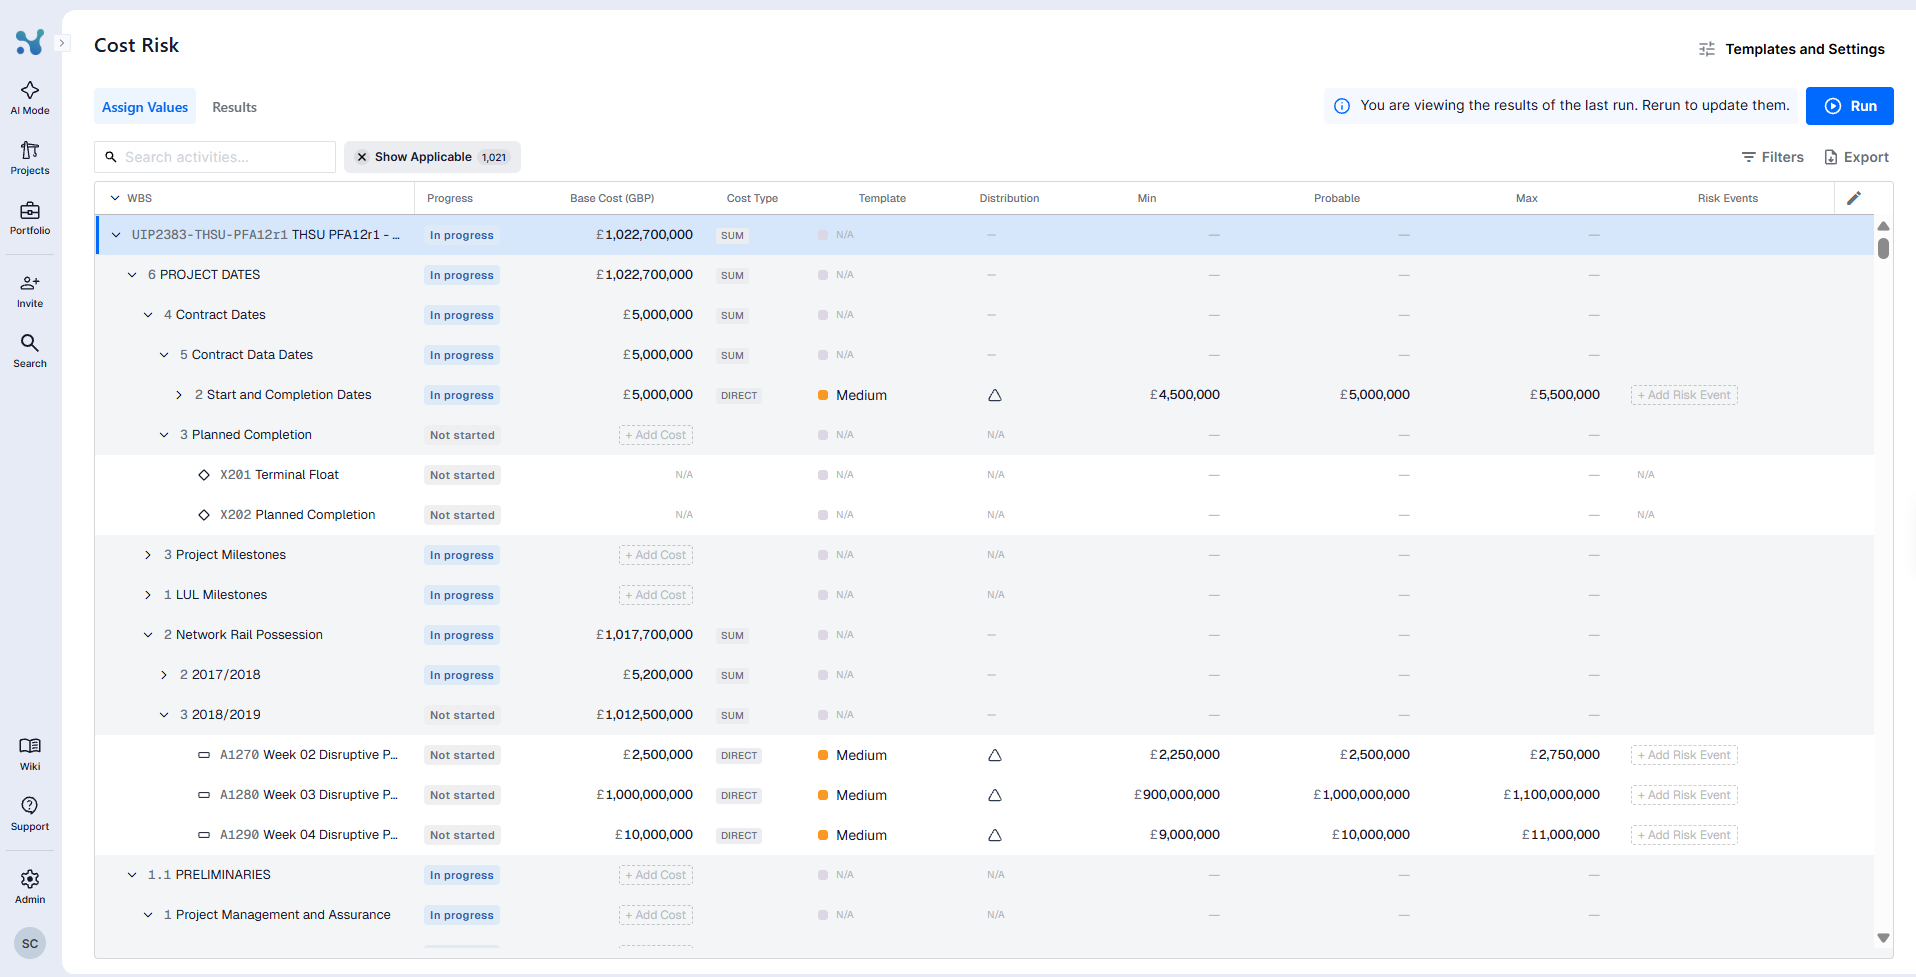
Each row of the table represents a project, WBS level, or activity, and shows the same hierarchy you see across the platform.
- Find the Base Cost column, click + Add Cost on a row and enter the base cost.
- The Cost Type column shows how each row is costed:
- DIRECT: the cost is entered on this row.
- SUM: the cost rolls up from the rows below.
A few rules keep your costs consistent:
- When you enter a cost on a WBS level, the costs of its child activities are cleared, and you can undo this with the toast that appears.
- When a parent level holds the cost, child rows are locked and show a tooltip explaining where the cost is set. You can click + Add Cost on a child to move costing down to the activities.
- Milestones, WBS summary rows, and completed activities cannot carry cost.
- Entering a cost unlocks the uncertainty inputs for that row. A cost of 0 is treated as no cost.
- Clearing a base cost also clears its uncertainty and risk event assignments.
Direct or Sum: who holds the cost
Every cost in QCRA is either a Direct cost or a Sum, and this is the key to how the screen works.
- A Direct cost is a value you type on a row: an activity, a WBS level, or the project itself. Only direct rows carry uncertainty and risk events, because these are the values the simulation samples. You choose the level that matches how your project is estimated: activity by activity, one figure per WBS package, or a single project-level estimate.
- A Sum is not a value you enter. It is the total of the direct costs below the row, giving you a subtotal at every WBS level and the project total, so the tree always adds up and results exist at every level you care about.
The two work together: where you place direct costs decides what gets sampled, and Sums roll everything up into the bigger picture. That is also why entering a cost on a WBS level clears and locks the child rows (the activities under it): the estimate now lives at that level. . If you later want activity-level costing, enter a cost on a child: the WBS cost is removed and the row becomes a Sum of the child costs below it.

Setting cost uncertainty
Once a row has a base cost, you can define its cost uncertainty in two ways:
1. Templates (quick)
Pick one of the five ready-made uncertainty bands (Low, Low-Medium, Medium, Medium-High, High) from the Template column. The band fills Min %, Prob % and Max % for you from its configured values.
2. Manual (per row)
Leave the template empty and enter the values yourself: choose the Distribution first (Single Value, Triangle, Uniform, or BetaPERT), then type the Min, Prob and Max values directly on the row, in the configured currency.
Entering values manually overrides the template on that row, and picking a template again replaces the values.
You can also assign cost risk events to any costed row using the Risk Events column: search the register and pick one or more events, shown as chips.
Uncertainty inputs are only editable where the cost is direct. Rows that roll up from children, or that are locked by a parent cost, show a tooltip explaining why they are not editable.

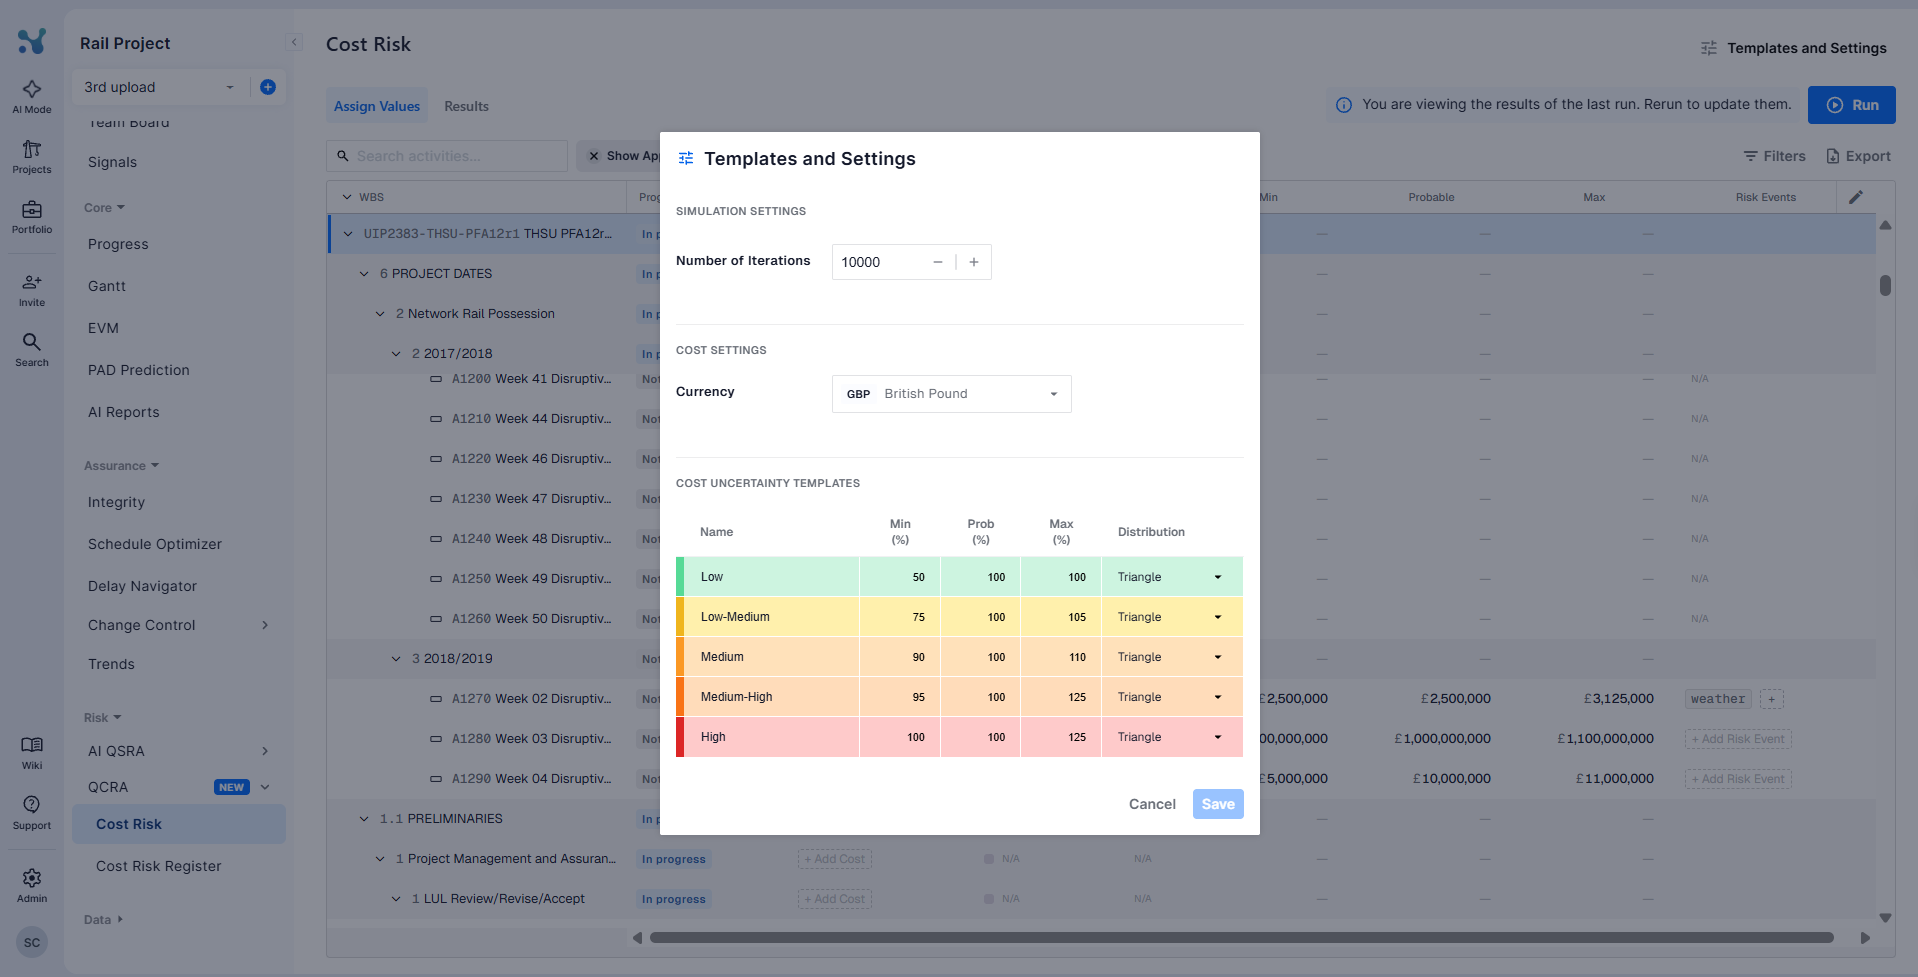
Templates and Settings
Click Templates and Settings in the header to configure:
- Number of Iterations: how many Monte Carlo iterations to run, from 1 to 10,000 (default 10,000).
- Currency: the currency used across the cost table and results. Base currency only, exchange rates are not applied.
- Cost Uncertainty Templates: the five ready-made uncertainty bands (Low, Low-Medium, Medium, Medium-High, High). You can rename each band and set its Min %, Prob %, Max %, and Distribution.
Running the analysis
- Set up at least one base cost, then click Run in the toolbar.
- If any risk event has mitigation values set up, you are asked whether to run with or without mitigation.
- The analysis runs in the background, so you can keep working or close the tab. You will receive a notification when it is done.
- When the run completes, the screen switches to the Results tab automatically.
If you change costs or uncertainties after a run, an info banner tells you that you are viewing the results of the last run. Simply rerun to update them.
Exploring the results
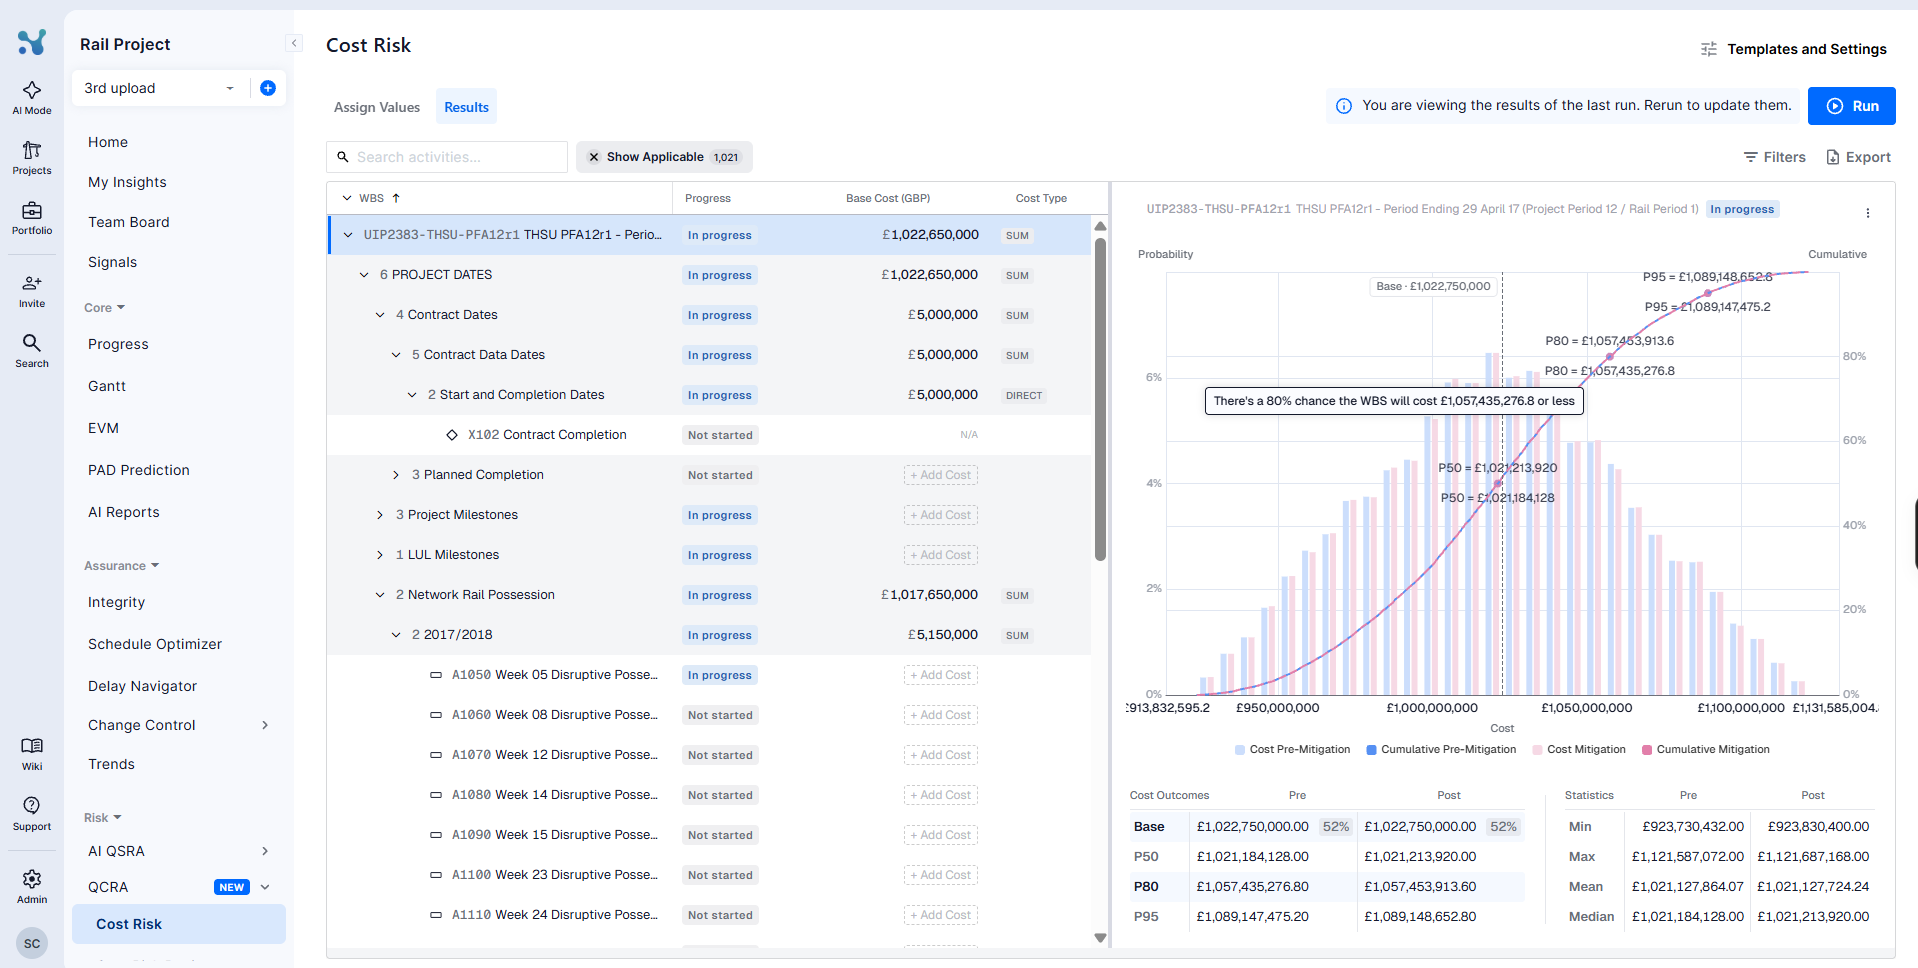
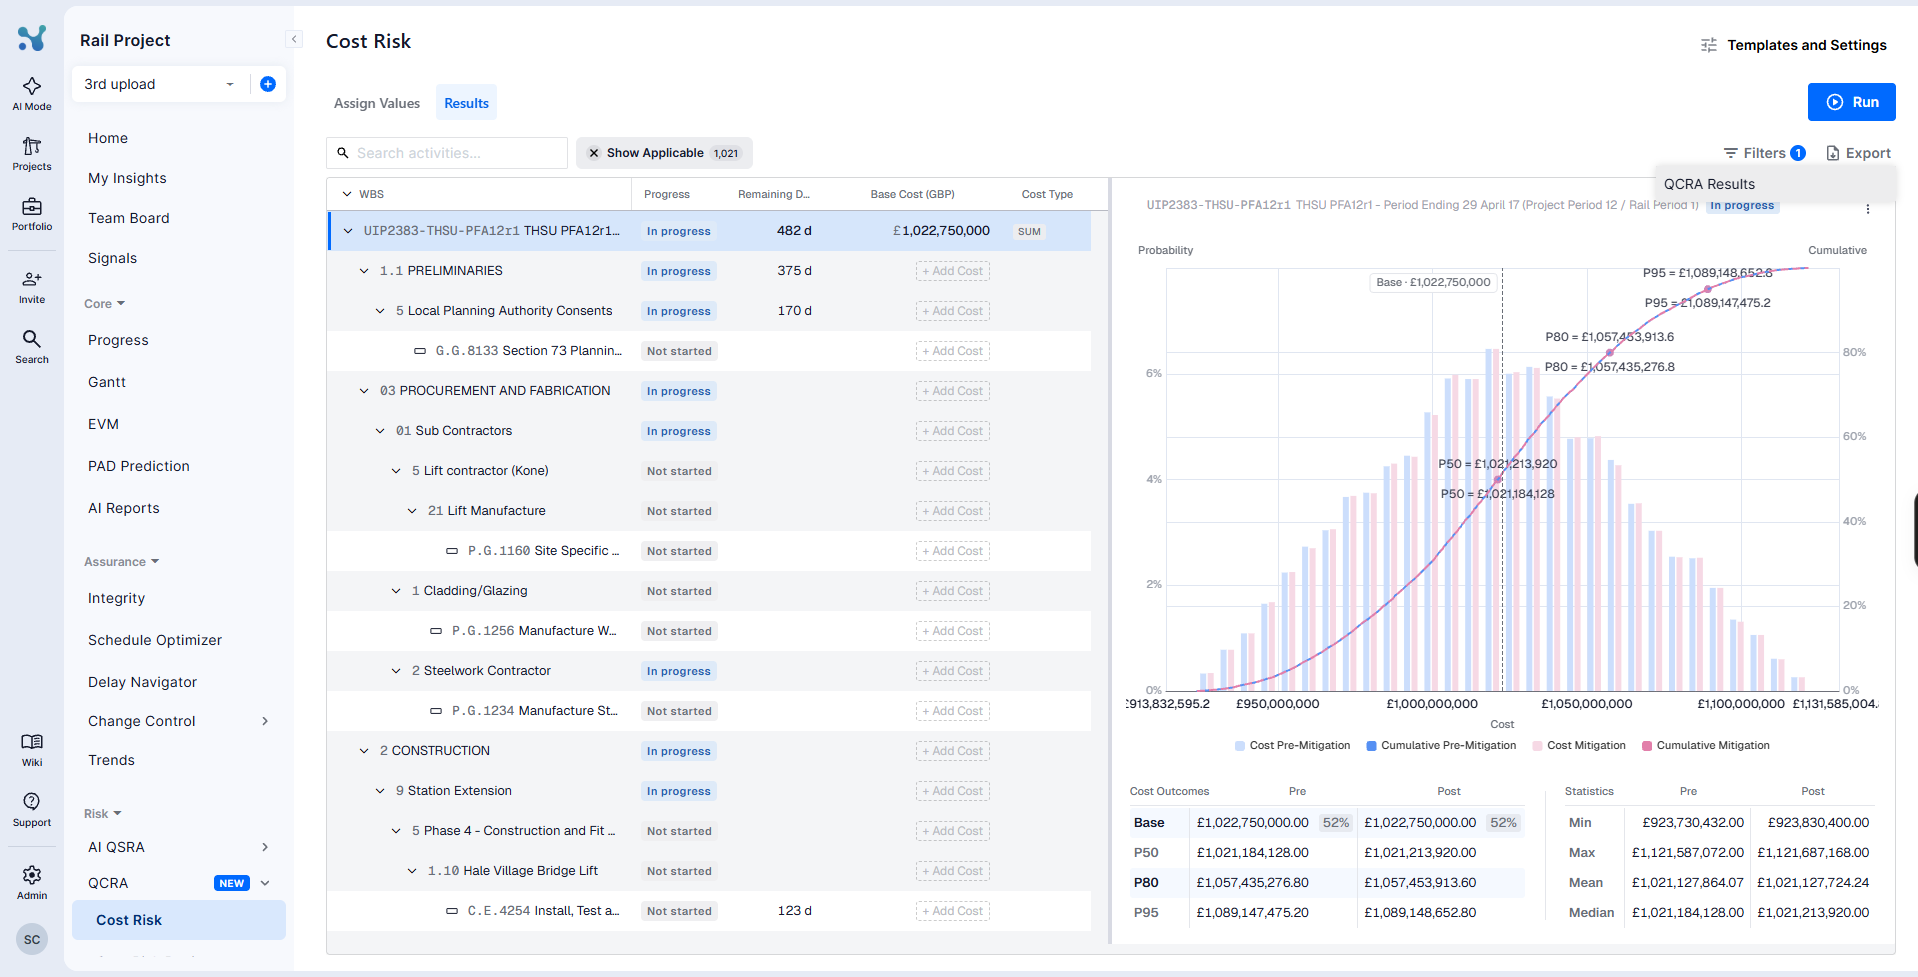
Switch between Assign Values and Results in the toolbar. In the Results view, select any row in the table and the results panel opens beside it.
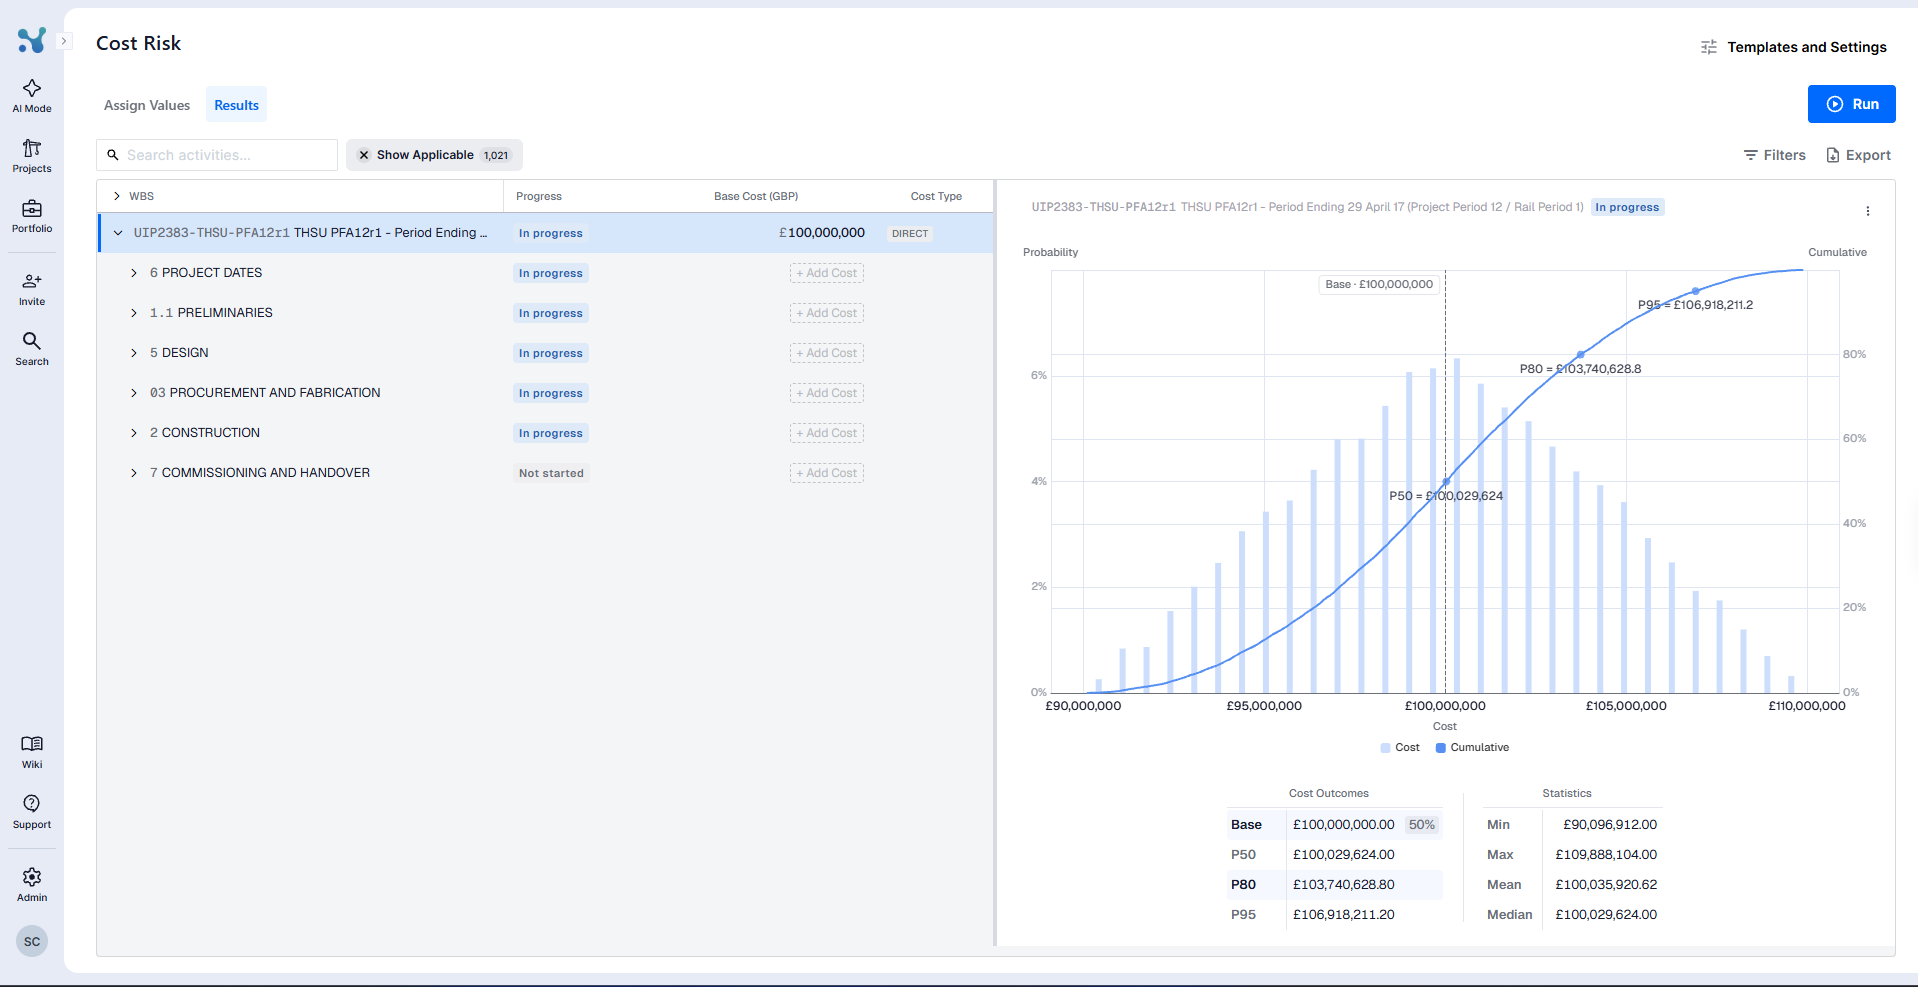
The chart shows:
- The cost distribution as a histogram
- The cumulative probability curve, with markers for P50, P80, and P95
- The base cost as a dashed line, toggled with Show Base Cost in the panel menu
- Pre and post mitigation curves, when a mitigation run exists
Hovering the curve tells you, for example: There's a 80% chance the project will cost £1,018,811 or less. You can zoom on the cost axis with your mouse wheel and reset the zoom at any time.
Below the chart, two tables summarise the numbers:
- Cost Outcomes: Base (with the likelihood of coming in at or below it), P50, P80, P95, each for Pre and Post mitigation.
- Statistics: Min, Max, Mean, Median.
Rows without results explain why: for example, when an activity's cost is estimated at a WBS level, results are only produced for the WBS node that holds the estimate.
Finding the rows you need
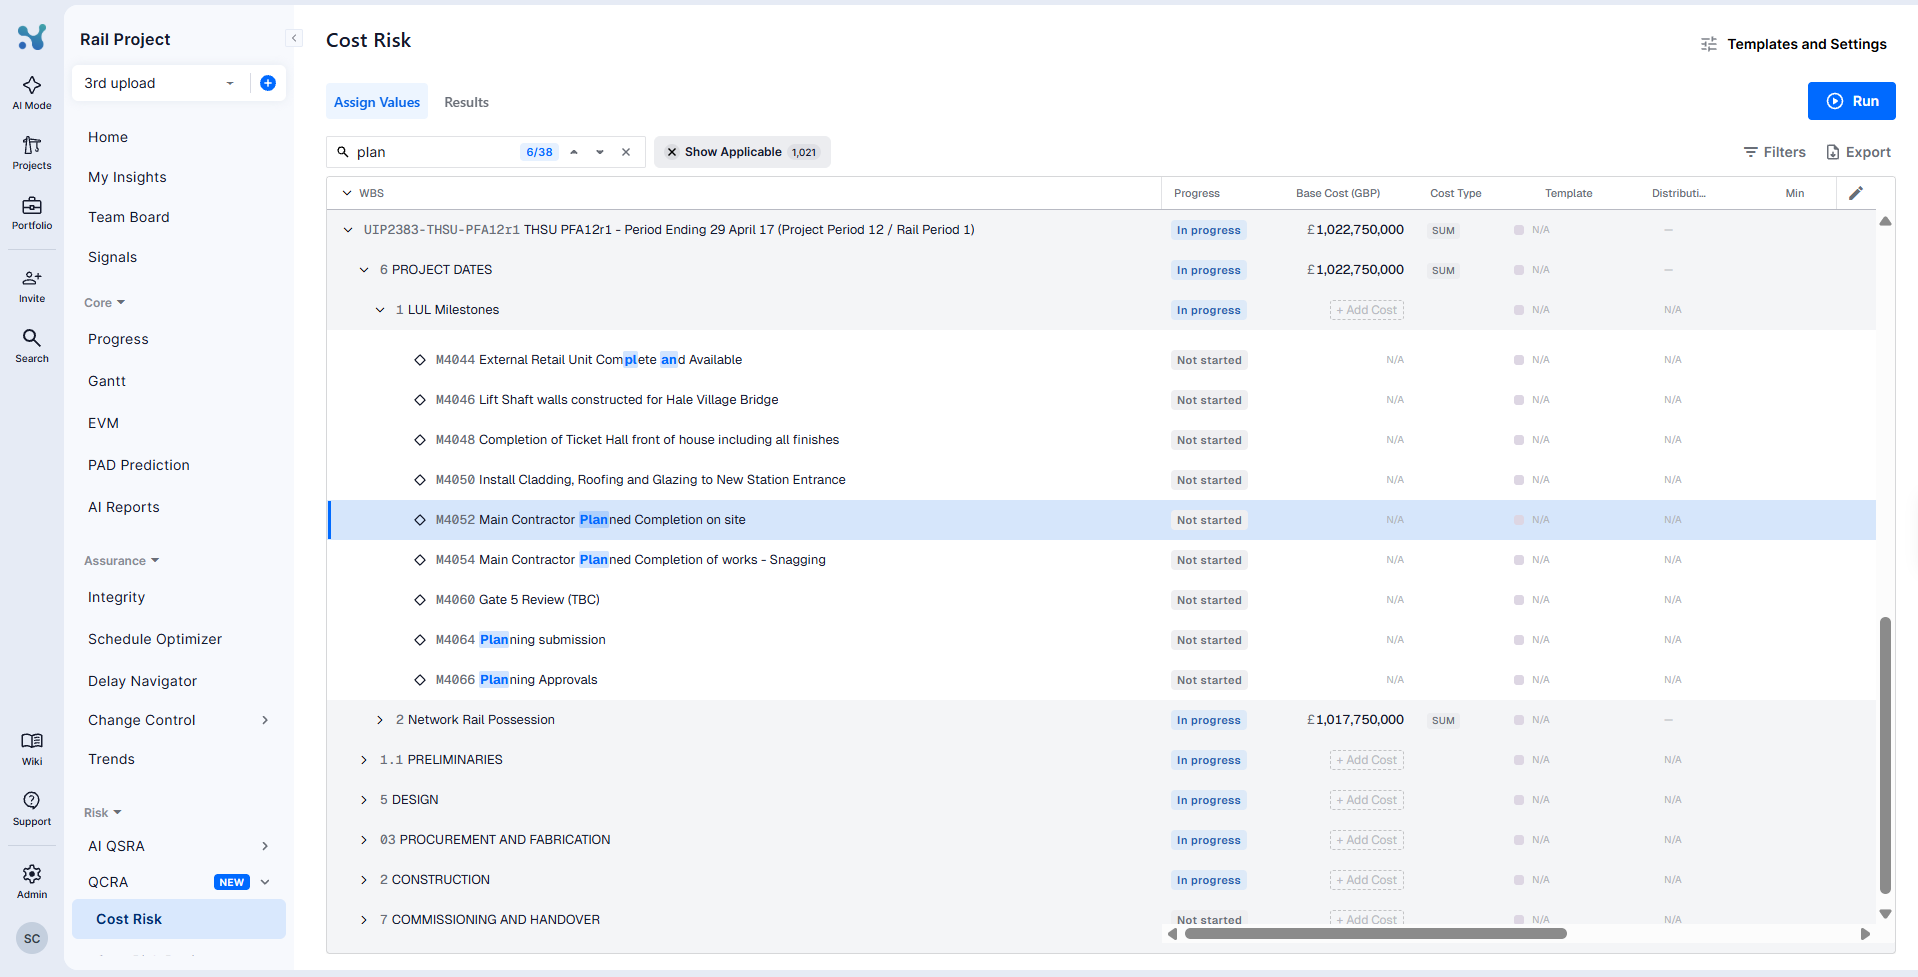
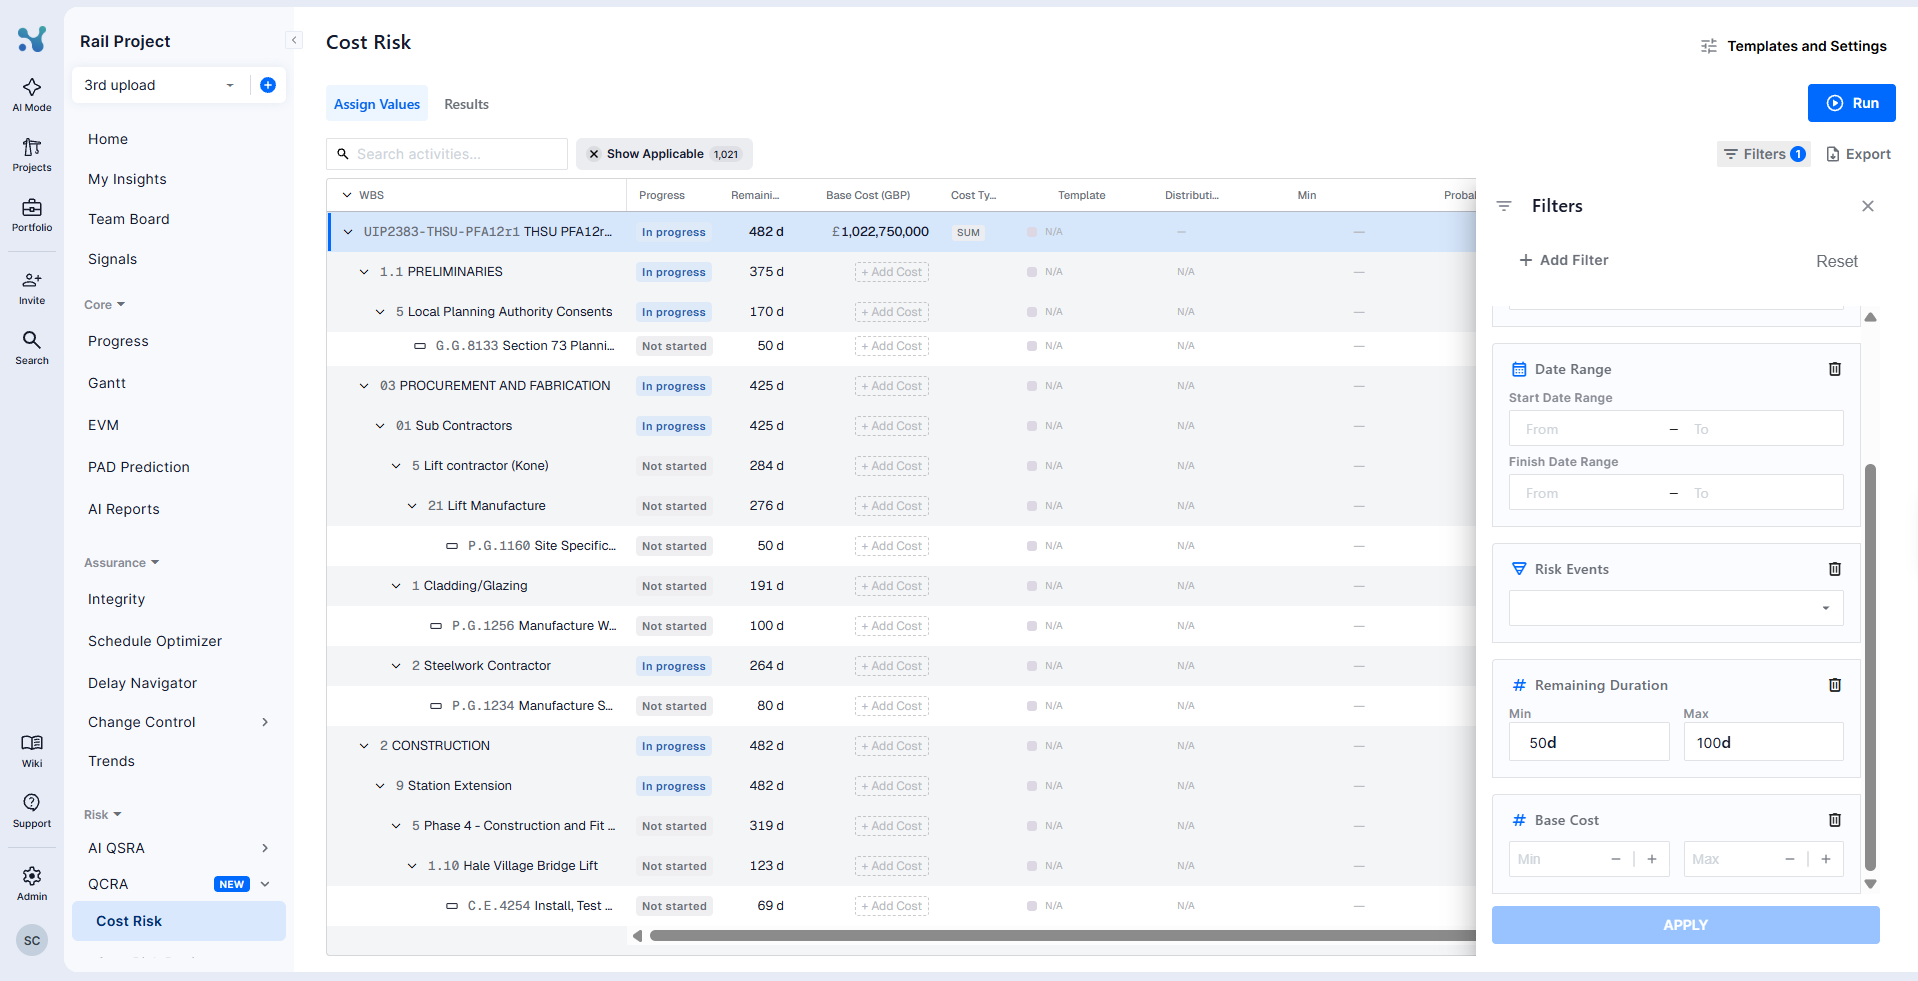
The toolbar helps you work through large schedules:
- Search: fuzzy search across the table, with match counts and navigation.
- Show Applicable: on by default, it hides completed activities, LOEs, and WBS summary rows so you only see the rows where cost inputs can be edited.
- Filters: open the filter drawer to filter the table by column values, including a Base Cost range.
Exporting
On the Cost Risk screen, the Export menu offers QCRA Results: an Excel file with the base costs, distributions, uncertainty, and the resulting percentiles for every row, including the mitigated percentiles when available.
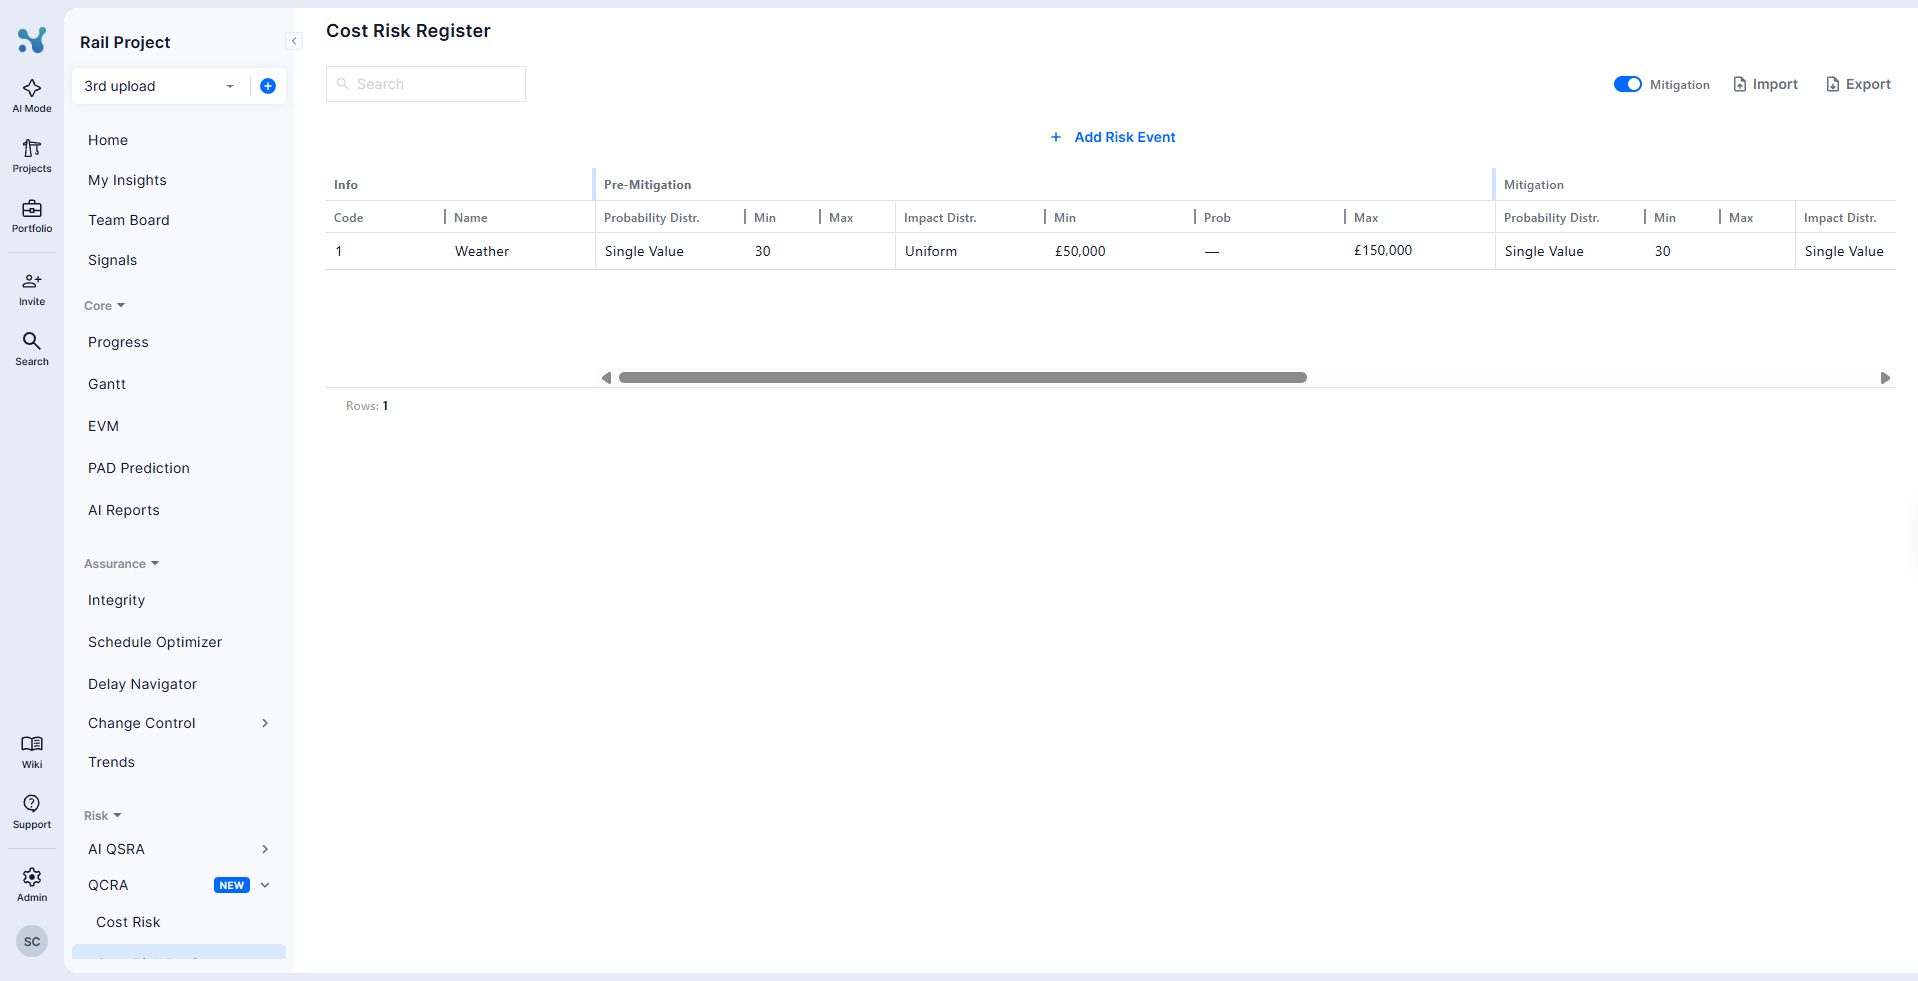
The Cost Risk Register
The Cost Risk Register screen holds the cost risk events you can assign in the cost table.
Each risk event has:
- A unique code and name
- Probability distribution: Single Value or Uniform
- Cost impact distribution: Single Value, Triangle, Uniform, or BetaPERT, with Min, Prob, and Max values
- Optional description, notes, reoccurrence, and independent columns
Turning on the Mitigation switch reveals a second set of columns where you enter the mitigated probability and impact, with a one-click copy of the pre-mitigation values.
Use Import to upload cost risks from an Excel file (a template is available for download), and Export to download the cost risk register.
The import process is identical to the one used for the QSRA Risk Register. For more details, please refer to this article.