Release 134 – API Access and Risk Screen Upgrades
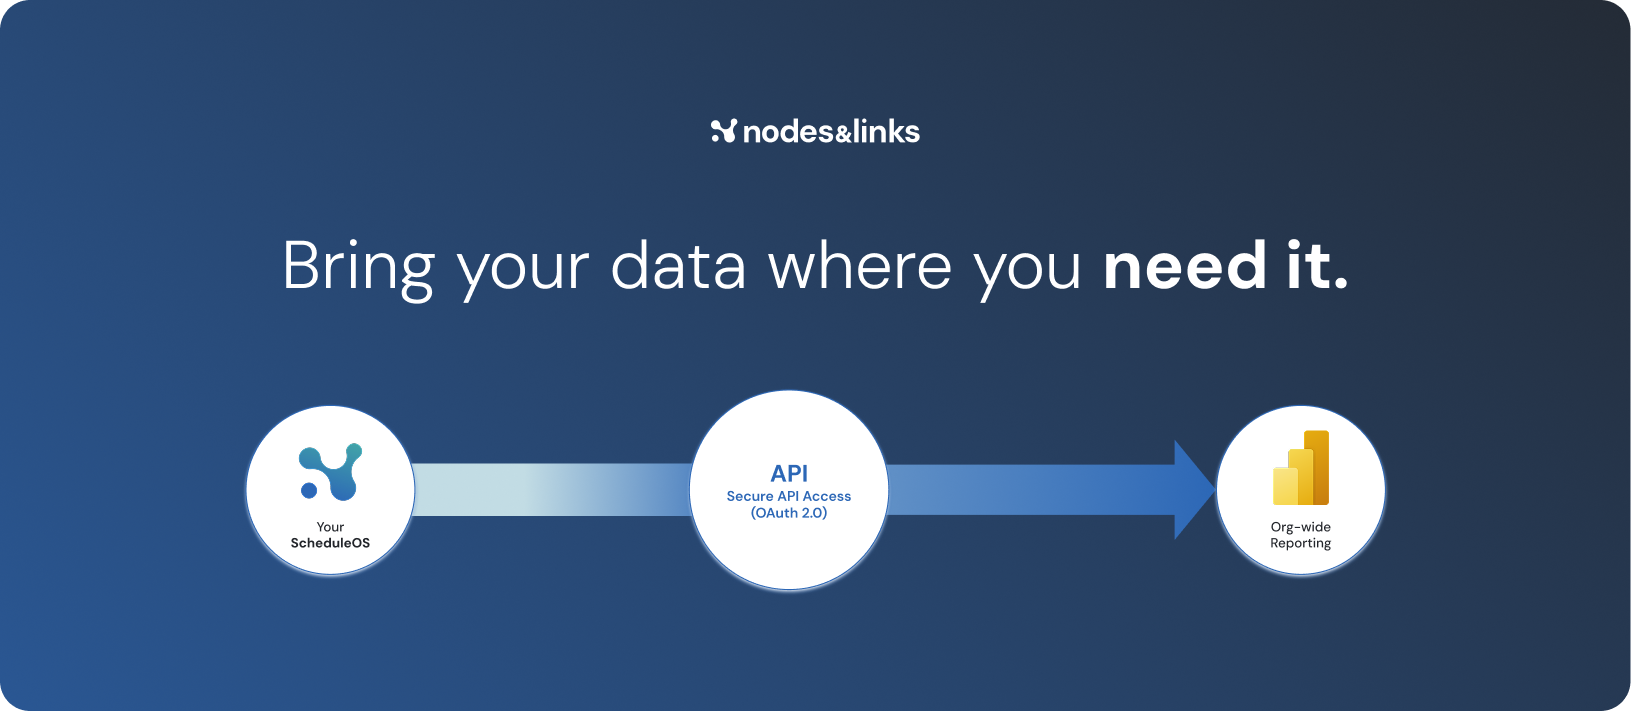
This release unlocks a new way to use Nodes & Links by giving you direct API access to key project data. You can now extract the metrics you need and build custom dashboards that fit your workflow. We've also improved the Risk screen to make comparisons and analysis easier than ever.
What’s New in Release 134?
1. New: API Access to Your Project Data 🔌

You can now connect to Nodes & Links programmatically and pull analytics directly into your own tools, like Power BI or internal dashboards. No manual exports required.
What you can access:
- All projects and schedules on your account
Includes name, data date, baseline status, and more - Project-level progress and performance index
- Overall health score for each project
- All activities across schedules
Includes start and end dates, duration, float, WBS, ACS, and more - Critical path per project
- Top 5 paths to any activity
Perfect for Gantt views or path-based analysis
This is just the beginning. More screens will be supported over time.
📘 Explore the API docs: developer.nodeslinks.com
2. Risk Screen Just Got Smarter
We’ve added new tools to help you understand and compare risk scenarios more easily.
What’s new:
- Risk Drivers view: Compare different mitigation scenarios side by side
- Sortable columns: Quickly find the highest-risk or longest-duration activities
- Refreshed layout: The results screen has been cleaned up for easier reading
Why These Changes Matter
With the new API, you can pull project data directly and use it however you want — in Power BI, internal tools, or custom dashboards. It gives teams more flexibility, faster access, and a way to integrate analytics into their own workflows. This is just the first step, and we’ll continue opening up more data over time.
Stay tuned for the next round. 🚀
